Week 9 - Senstivity Analysis Assignment
Aim:
To perform sensitivity analysis of a methane combustion reaction
Objective:
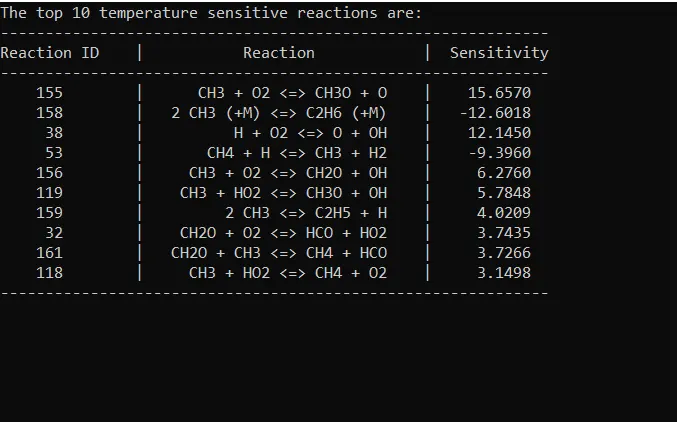
- Write a code that takes all the reactions from the GRI mechanism and calculates 10 most sensitive reactions
- The sensitivity parameter should be with respect to the Temperature (It should find the sensitivity with respect to the temperature not 'OH' as shown in the video)
- Consider the initial conditions as shown in the video
- Your program should show the reaction strings in the order of greatest sensitivity to the least sensitivity
Introduction:
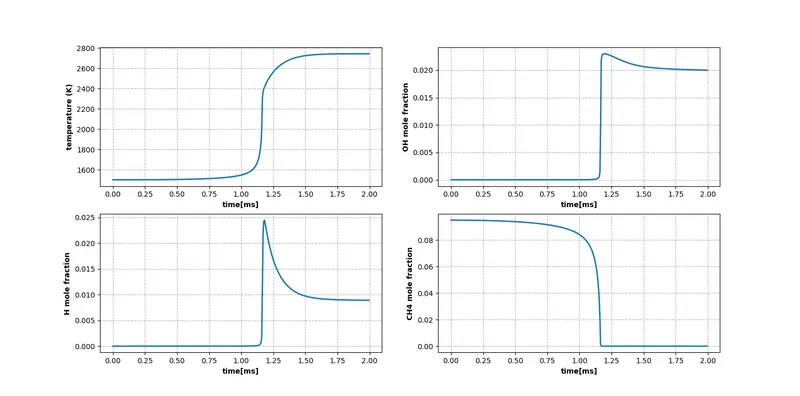
Sensitivity analysis is nothing but a set of processes to get relationship between the parameters and the output model. The main aim of this process is to calculate the ignition delay in the combustion chamber and sensitivity analysis tells which reaction cause more sensitive reaction for ignition delay.
Numerical methods to solve the equations of chemical reactions wrt parameters and time step are computed. Solving ODE of species wrt time integration and difference between old and new values of species wrt parameter tells the sensitivity of reactions.
In this project we used python and cantera to compute the sensitivity of the reactions from GRI 3.0 mechanism file. We are using IdealGasConstPressureReactor file and reactor net file mechanism.
Initial conditions:
T=1500K
Pressure= 1atm
Fuel= CH4 + 2 (O2 + 3.72 N2)
Python code
# import libraries

import numpy as np
import cantera as ct
import matplotlib.pyplot as plt

gas=ct.Solution('gri30.xml')
temp=1500
pressure=ct.one_atm

# to print reactions
react=gas.reaction_equations()
n=gas.n_reactions
reac_ID=np.linspace(1,n,n).astype(int)
N=10
s_max=[0]*n
gas.TPX=temp,pressure,{'CH4':1,'O2':2,'N2':7.52}
r=ct.IdealGasConstPressureReactor(gas)
sim=ct.ReactorNet([r])


for i in range (n):
	r.add_sensitivity_reaction(i)

sim.rtol=1e-6
sim.atol=1e-6

sim.rtol_sensitivity=1e-6
sim.atol_sensitivity=1e-6

# solution array for storing thermodynamic variable

states=ct.SolutionArray(gas,extra=['t'])
for t in np.arange(0,2e-3,5e-6):
	sim.advance(t)

	for j in range (n):
		s=sim.sensitivity('temperature',j)


		if (np.abs(s)>=np.abs(s_max[j])):
			s_max[j]=s
	states.append(r.thermo.state,t=1000*t)


s_abs=np.abs(s_max)

# sorting the reactions
react=[a for b, a in sorted (zip(s_abs,react),reverse=True)]
reac_ID=[a for b, a in sorted (zip(s_abs,reac_ID),reverse=True)]
s_max=[a for b, a in sorted (zip(s_abs,s_max),reverse=True)]

r_plot=react[0:N]
riD_plot=reac_ID[0:N]
sens_plot=s_max[0:N]

print("The top %d temperature sensitive reactions are:" % (N))
print("-------------------------------------------------------------")
print("%8s %4s %18s %12s %12s" % ('Reaction ID','|','Reaction','|','Sensitivity'))
print("-------------------------------------------------------------")
for i in range(N):
	print("%7d %8s %26s %4s %10.4f" % (riD_plot[i],'|',r_plot[i],'|',sens_plot[i]))
print("-------------------------------------------------------------")


H_moles=states.X[:,states.species_index('H')]
OH_moles=states.X[:,states.species_index('OH')]
CH4_moles=states.X[:,states.species_index('CH4')]

plt.figure(1)
plt.barh(r_plot,sens_plot,0.4,color='dimgrey')
plt.xlabel('temperature sensitivity')
plt.gca().invert_yaxis()
plt.grid(linestyle=':',color='black')
plt.title('top ten sensitive reactions')

fig2, ax=plt.subplots(2,2)
plt.subplot(2,2,1)
plt.plot(states.t,states.T,linewidth=2)
plt.grid('both',linestyle='--',linewidth=0.8)
plt.xlabel('time[ms]',fontweight='bold')
plt.ylabel('temperature (K)',fontweight='bold')
plt.subplot(2,2,2)
plt.plot(states.t,OH_moles,linewidth=2)
plt.grid('both',linestyle='--',linewidth=0.8)
plt.xlabel('time[ms]',fontweight='bold')
plt.ylabel('OH mole fraction',fontweight='bold')
plt.subplot(2,2,3)
plt.plot(states.t,H_moles,linewidth=2)
plt.grid('both',linestyle='--',linewidth=0.8)
plt.xlabel('time[ms]',fontweight='bold')
plt.ylabel('H mole fraction',fontweight='bold')
plt.subplot(2,2,4)
plt.plot(states.t,CH4_moles,linewidth=2)
plt.grid('both',linestyle='--',linewidth=0.8)
plt.xlabel('time[ms]',fontweight='bold')
plt.ylabel('CH4 mole fraction',fontweight='bold')
plt.show()
Output:
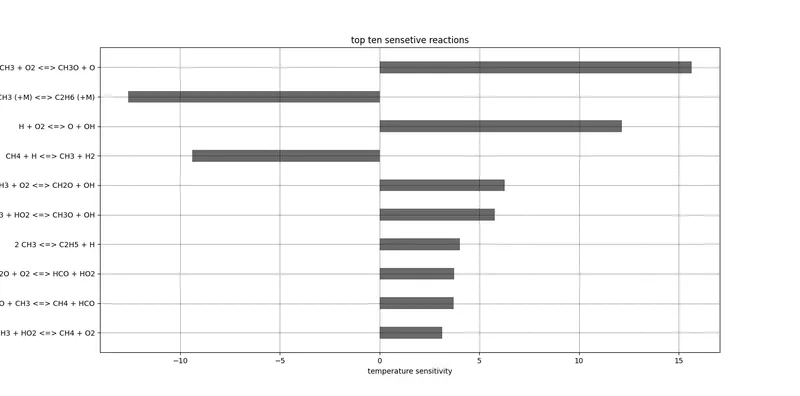
Graphical representation:
Sensitivity reaction
Ignition delay wrt mole fraction of species