Week 9 - Senstivity Analysis Assignment
JORGE LOZANO
Computational Combustion using Python and Cantera
Sensitivity Analysis Assignment
Objective
Use the source code as shown in the video, but alter it to satisfy the following conditions:
- Write a code that takes all the reactions from the GRI mechanism and calculates 10 most sensitive reactions
- The sensitivity parameter should be with respect to the Temperature
- Consider the initial conditions as shown in the video
- Your program should show the reaction strings in the order of greatest sensitivity to the least sensitivity
Documentation
The following paper utilizes the procedure and general knowledge of this project to produce and obtain visual data, resulting in an aid of the sensitivity analysis as follows:
In the present study, a reaction scheme representing the chemistry of ozone depletion and halogen release is processed with two different mechanism reduction approaches, namely, the concentration sensitivity analysis and the principal component analysis. In the concentration sensitivity analysis, the interdependence of the mixing ratios of ozone and principal bromine species on the rate of each reaction in the ODE mechanism is identified. Furthermore, the most influential reactions in different time periods of ODEs are also revealed. By removing 11 reactions with the maximum absolute values of sensitivities lower than 10 %, a reduced reaction mechanism of ODEs is derived. The onsets of each period of ODEs in simulations using the original reaction mechanism and the reduced reaction mechanism are identical while the maximum deviation of the mixing ratio of principal bromine species between different mechanisms is found to be less than 1 %. By performing the principal component analysis on an array of the sensitivity matrices, the dependence of a particular species concentration on a combination of the reaction rates in the mechanism is revealed.(Cao et al. 2016)
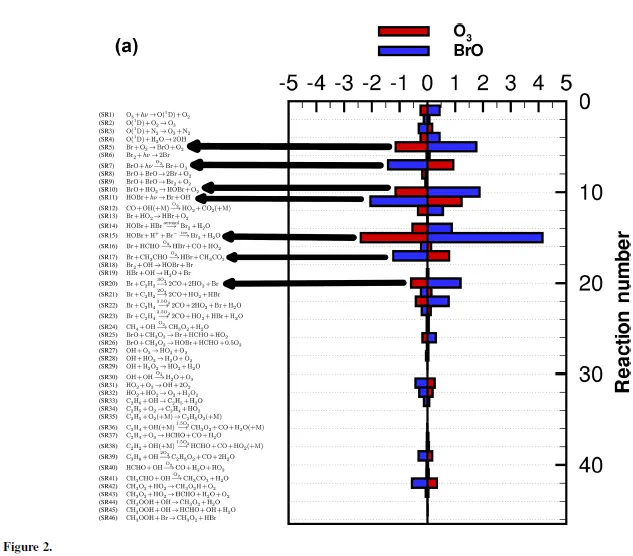
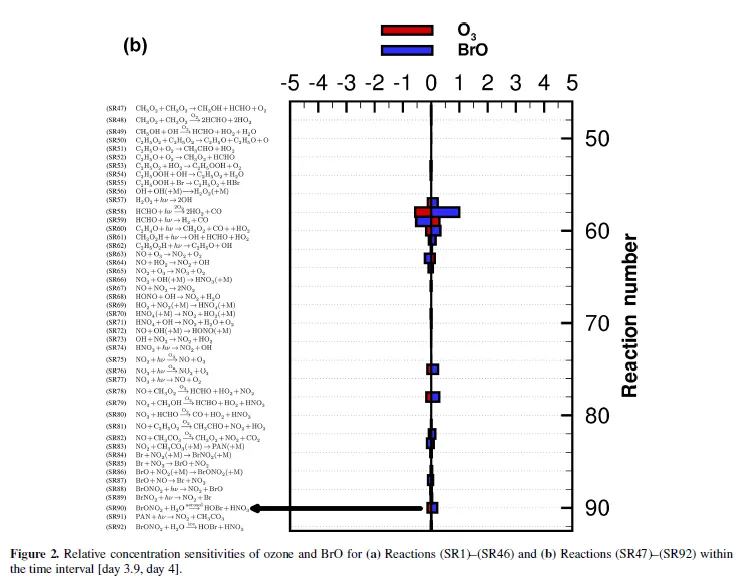
In the present study, two reduction approaches, namely, the concentration sensitivity analysis and the principal component analysis, were applied on a reaction mechanism representing the chemistry of ODEs. The former was performed based on the ratio of the relative change of species concentrations and the variation of a particular reaction rate. The significance of each reaction in the original mechanism for various chemical species was identified. It was found that during the depletion of ozone, reactions associated with HOBr are the most influential reactions as they determine the total bromine loading in the atmosphere within this time period. By removing 11 reactions, which exhibit peak absolute values of the sensitivity coefficients lower than 10 %, a reduced reaction mechanism of ODEs was derived. The difference between the results obtained by using the original reaction mechanism and the reduced reaction mechanism is negligible, which validates the sensitivity analysis.(Cao et al. 2016)
Process
The following code presents a reactor network of reaction mechanisms that will output the most temperature sensitive reaction mechanisms and the mole values for several elements or combustors as well as the temperature generated by them.
import sys
import matplotlib.pyplot as plt
import cantera as ct
import numpy as np

gas = ct.Solution('gri30.xml')

N = 10
Temp = 1500
Pressure = ct.one_atm
gas.TPX = Temp, Pressure,'CH4:1,O2:2,N2:7.52'

r = ct.IdealGasConstPressureReactor(gas,name='R1')
sim = ct.ReactorNet([r])
reactions = gas.reaction_equations()
n = gas.n_reactions
r_id = np.linspace(1,n)

sim.rtol = 1e-6
sim.atol = 1e-15
sim.rtol_sensitivity = sim.rtol
sim.atol_sensitivity = sim.rtol
Tf = [0]*n
states = ct.SolutionArray(gas, extra=['t_in_ms'])

for i in range(n):
	r.add_sensitivity_reaction(i)

for i in np.arange(0,2e-3,5e-6):
	sim.advance(i)
	states.append(r.thermo.state, t_in_ms=i*1e3)
	for j in range(n):
		T = sim.sensitivity('temperature',j)
		if abs(T) >= abs(Tf[j]):
			Tf[j] = T

reactions = [r for s,r in sorted(zip(np.abs(Tf),reactions), reverse=True)]
rid = [r for s,r in sorted(zip(np.abs(Tf),r_id), reverse=True)]
Tf = [T for abs_T, T in sorted(zip(np.abs(Tf),Tf), reverse=True)]

r_id_plt = r_id[0:N]
splt = Tf[0:N]
rplt = reactions[0:N]
for i in range(N):
	print(r_id_plt[i],rplt[i],splt[i])
OH = states.X[:, states.species_index('OH')]
H = states.X[:, states.species_index('H')]
CH4 = states.X[:, states.species_index('CH4')]
CH3 = states.X[:, states.species_index('CH3')]
O = states.X[:, states.species_index('O')]
HO2 = states.X[:, states.species_index('HO2')]
CH3O = states.X[:, states.species_index('CH3O')]

plt.style.use('seaborn-dark-palette')
plt.figure(1)
plt.grid('TRUE')
plt.barh(rplt,splt,height=0.6)
plt.gca().invert_yaxis()
plt.xlabel("SENSITIVITY")
plt.title("TEMPERATURE SENSITIVE REACTIONS: GRI MECHANISM")
plt.tight_layout()
plt.figure(2)
plt.subplot(2,4,1)
plt.plot(states.t_in_ms,states.T)
plt.xlabel('TIME IN MILISECONDS')
plt.ylabel('TEMPERATURE IN KELVIN')
plt.grid('TRUE')
plt.subplot(2,4,2)
plt.plot(states.t_in_ms,OH)
plt.xlabel('TIME IN MILISECONDS')
plt.ylabel('OH MOLE FRACTION')
plt.grid('TRUE')
plt.subplot(2,4,3)
plt.plot(states.t_in_ms,H)
plt.xlabel('TIME IN MILISECONDS')
plt.ylabel('H MOLE FRACTION')
plt.grid('TRUE')
plt.subplot(2,4,4)
plt.plot(states.t_in_ms,CH4)
plt.xlabel('TIME IN MILISECONDS')
plt.ylabel('CH4 MOLE FRACTION')
plt.tight_layout()
plt.grid('TRUE')
plt.subplot(2,4,5)
plt.plot(states.t_in_ms,CH3)
plt.xlabel('TIME IN MILISECONDS')
plt.ylabel('CH3 MOLE FRACTION')
plt.tight_layout()
plt.grid('TRUE')
plt.subplot(2,4,6)
plt.plot(states.t_in_ms,O)
plt.xlabel('TIME IN MILISECONDS')
plt.ylabel('O MOLE FRACTION')
plt.tight_layout()
plt.grid('TRUE')
plt.subplot(2,4,7)
plt.plot(states.t_in_ms,HO2)
plt.xlabel('TIME IN MILISECONDS')
plt.ylabel('HO2 MOLE FRACTION')
plt.tight_layout()
plt.grid('TRUE')
plt.subplot(2,4,8)
plt.plot(states.t_in_ms,CH3O)
plt.xlabel('TIME IN MILISECONDS')
plt.ylabel('CH3O MOLE FRACTION')
plt.grid('TRUE')

plt.show()
Results
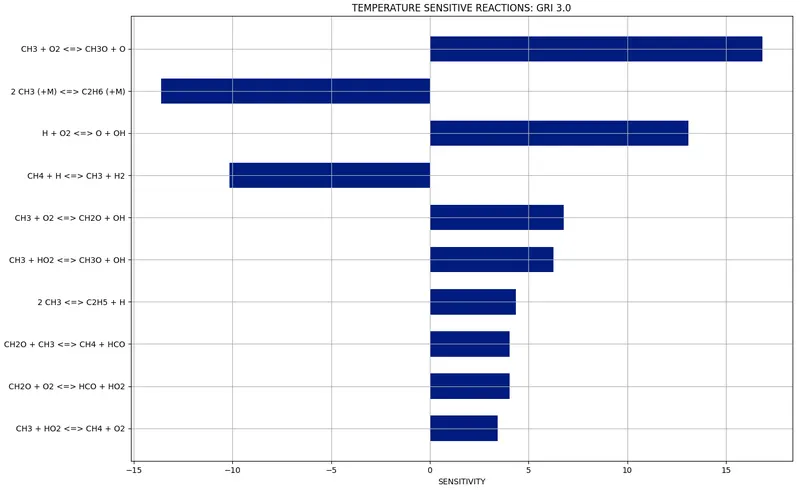
The top 10 reaction mechanisms more sensitive to temperature rates are:
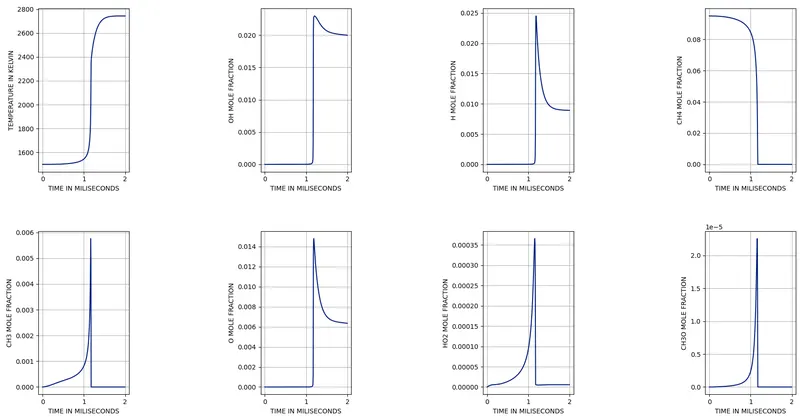
Obtaining as well the mole values for several elements and combustors ideal and critical to this analysis:
Conclusion
The following order of reactions present the top from greatest to least reaction mechanisms sensitive to temperature from the GRI reactions:
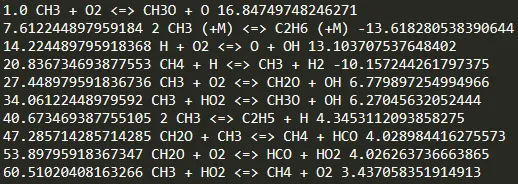
Obtaining only the first 6 reactions as having a greater effect in any system (but not excluding the rest), due to the high value of sensitivity within the mechanism reactions. Meaning that whenever the sensitivity value increases as positive, the rate of reaction increases due to the temperature and vise versa, having a greater effect in simulating these systems with a temporal value. And determining that the CH3 and reaction mechanisms with oxygen produce more and higher temperature sensitive values.
Reference
Cao, Le, Chenggang Wang, Mao Mao, Holger Grosshans, and Nianwen Cao. 2016. “Derivation of the Reduced Reaction Mechanisms of Ozone Depletion Events in the Arctic Spring by Using Concentration Sensitivity Analysis and Principal Component Analysis.” Atmospheric Chemistry and Physics 16 (23): 14853–73. https://doi.org/10.5194/acp-16-14853-2016.