Week 9 - Parametric study on Gate valve.
Introduction :-
The gate valve is the fluid valve that opens by lifting the barrier gate from the path of the fluid flowing thriugh a
pipeline. Gate valves require generally very less space and are and can be fitted along the pipe axis and they hardly restict any fluid flow when they are fully opened. The schematic of the gate valve can be seen below
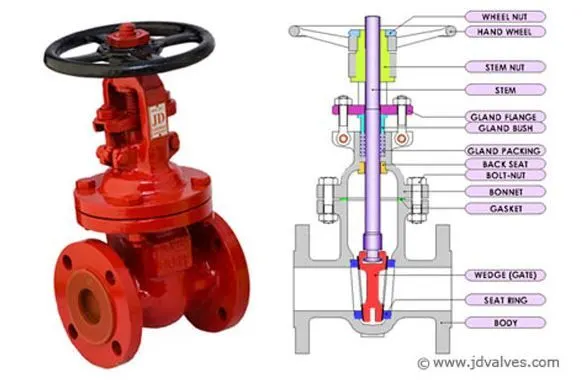
Gate valves rae generally used to shut off the fluid flow inside a pipe line and also to control the fluid flow. When they are fuly opened they hardly restrict any fluid flow, thus offering very low flow resistance when fully opened. Gate valves are generally used for the pipe of diameters larger that that of 2' to the largest pipes. They are simpler to construct in large sizes. The gate can vibrate if it is in partially open state.
Genewrally in pipelines with high pressure the gate valve opening can be quiet difficult due to the high force exerted on the gate. So they are generally connected with a smaller bypass valve to release the pressure and then tray are operated.
Modeling approach :-
CAD clean up/Pre-process-SpaceClaim - Import the geometry which is given. And make some changes like shift the disk upward a little bit (10 mm). Then extract the fluid volume. 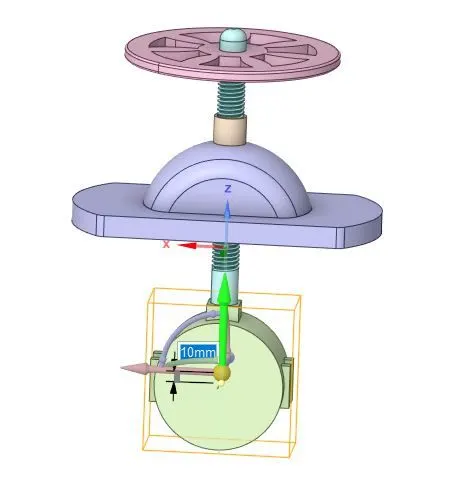
Meshing :-Apply the elements size about and give the proper name selection.
Setup :- In this section, we set up the steady state simulation. Apply gravity in negative Z direction. kε - Realizable - Scalable wall function model is applied for simulation. Assign fluid as water. Apply cellzone condition as water. Applied boundary conditions. Initialize the simulation and apply certain no of iterations.
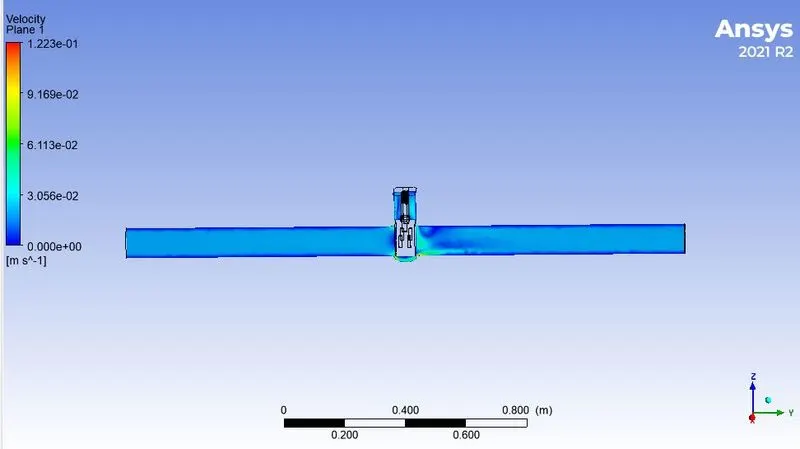
Solution :- we can see the animations of velocity on particular plane and get the mass flow rate at the outlet.
CAD clean up/Pre-process-SpaceClaim :-
Import the geometry which is given.
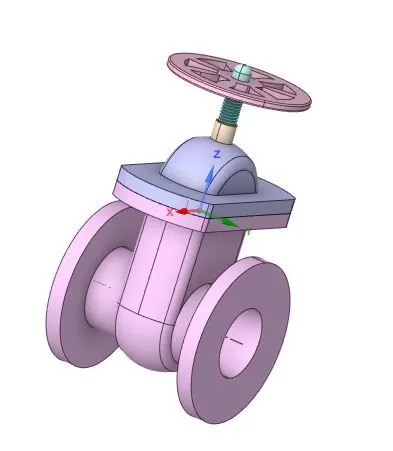
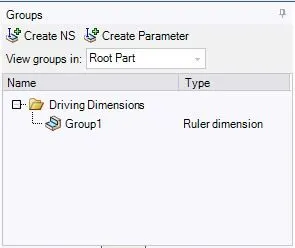
And make some changes like shift the disk upward a little bit (10 mm). And parametrize it.
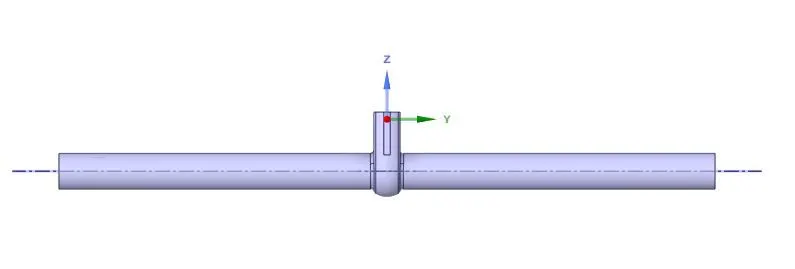
Extract the fluid volume from the geometry. And pull both the end phase till 800 mm as shown in figure below.
Meshing :-
Element size :- 50 mm
No of elements :- 136059
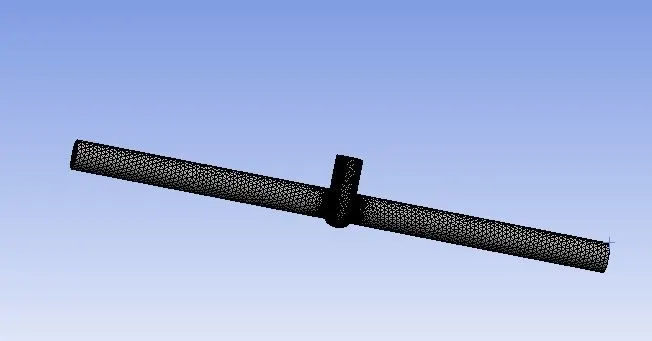
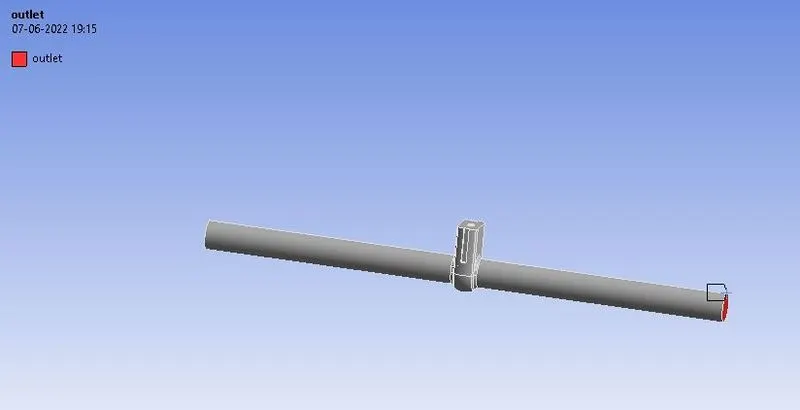
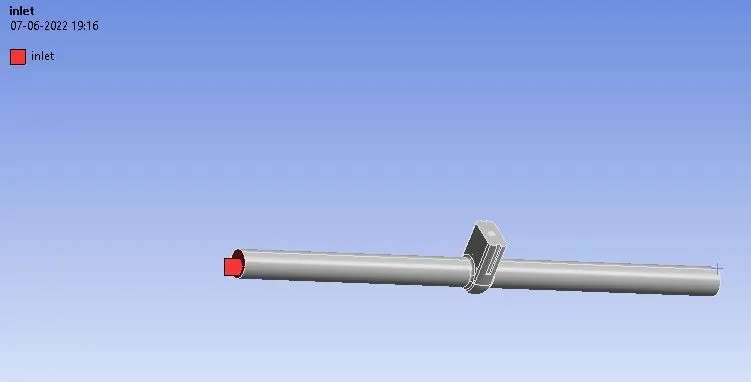
Apply name selection inlet and outlet.
Outlet
Inlet
Mesh metric :-
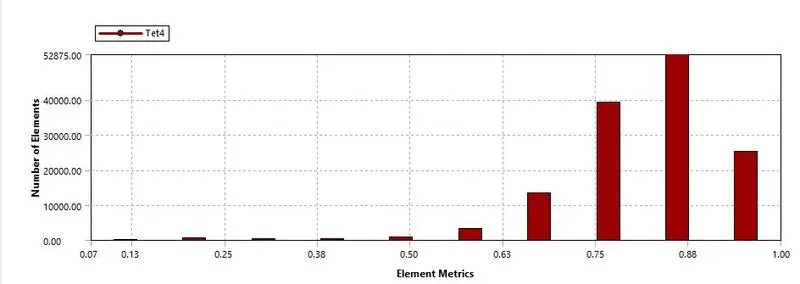
The maximum number of the mesh element have higher quality in the range of 0.75 - 1.
Setup :-
Solver type = Pressure based solver
Gravity = -9.81 (in z direction)
Solver = steady state solver
Model = kε- Realizable - scalable wall function
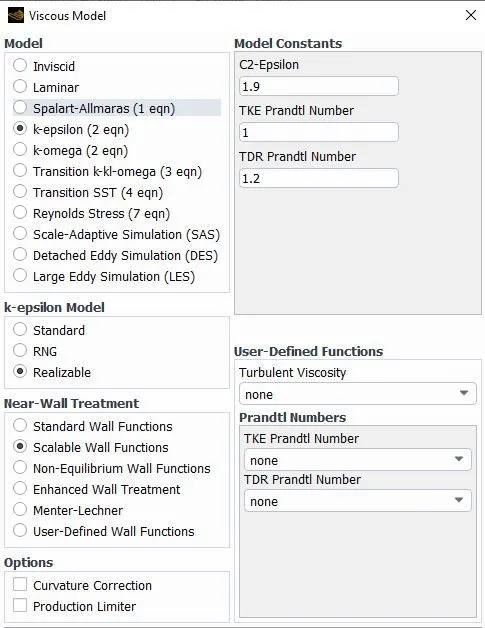
Material - water liquid
cell zone condition - Assign fluid as water.
Boundary condition -
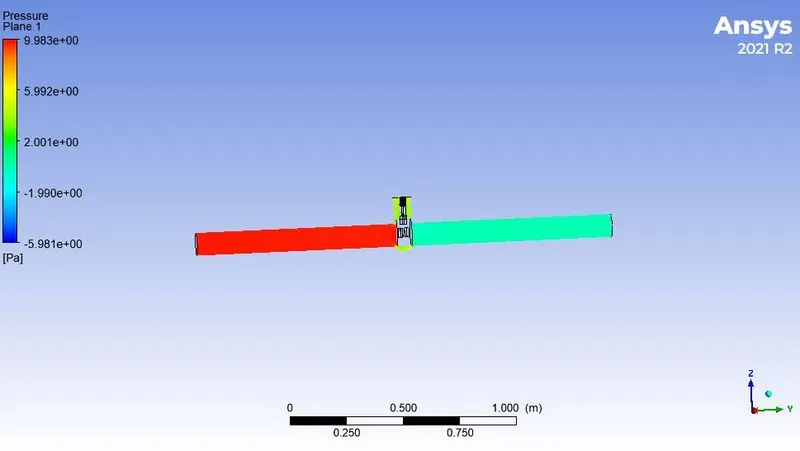
Inlet - Pressure inlet (10 Pa)
Outlet - Pressure outlet
report definition = Mass flow rate at outlet
Now initialize process with hybrid initialization.
Prepare the animation of velocity contour plane.
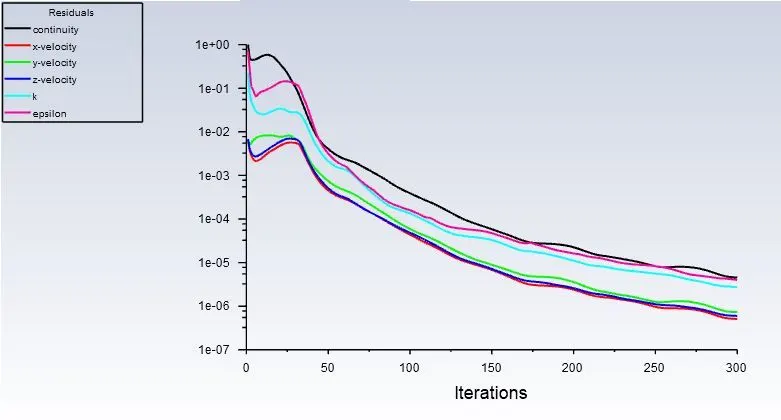
Run the simulation for 300 iterations
Solution :-
Residuals
Mass flow rate at outlet :- 0.1486559 kg/s
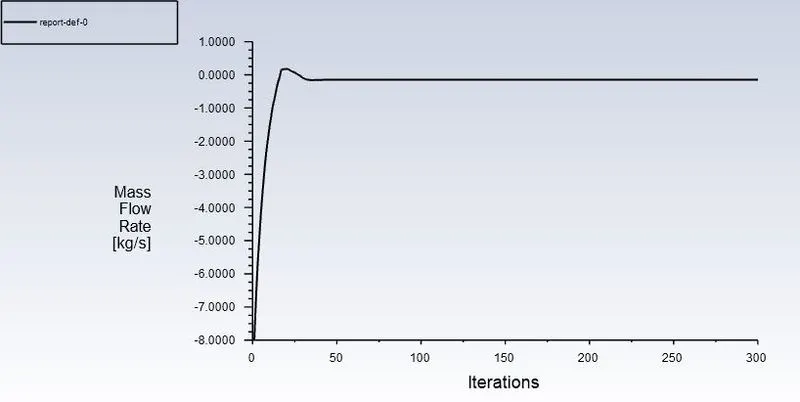
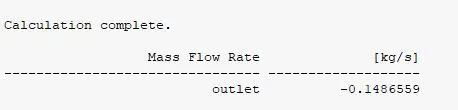
The negative sign indicates that the fluid is coming out of the outlet.
Result (Post-processing) :-
Velocity contour
Pressure contour
Animation:-
https://drive.google.com/file/d/1zWYQSAP_YGS0HzpD_moDx9AwivTkoX65/view?usp=sharing
Flow Factor (Kv):-
Flow factor is the flow coefficient in the metric units. It is basically defined as the flow rate in cubic meters per hour for
water at the constant temperature of 16 degree C with the pressure drop of 1 bar across the valve.
Flow Coefficient (Cv):-
Cv is the flow coefficient in the imperial units. It is basically defined as the flow rate in US Gallons per minute of water
at a constant temperature of 60 degree farenheitand a pressure drop of 1 psi across the vavle. It is used to determine
the flow for various conditions and to select the proper valve for the various applications.
The flow coefficient can be defined as :
Cv = Q √(SG/ΔP)
where,
Q= flow rate in GPM( Gallons per minute )
SG = specific gravity (1 for water)
ΔP= Total Pressure Drop (in psi)
Flow factor Kv=0.864 Cv
| Magnitude of valve displacement (10 mm) | mass flow rate (kg/s) | Flow coefficient Cv | Flow factor Kv |
| 10 | 0.14865 | 61.70562 | 53.31366 |
| 20 | 0.23828 | 99.32592 | 85.8176 |
| 30 | 0.35596 | 150.0744 | 129.6412 |
| 40 | 0.46748 | 194.8669 | 168.365 |
| 50 | 0.56145 | 234.0378 | 202.2087 |
| 60 | 0.65747 | 274.0633 | 236.7970 |
| 70 | 0.71796 | 299.2783 | 258.5765 |
| 80 | 0.76505 | 318.9076 | 275.5361 |
| 90 | 0.82548 | 344.0975 | 297.3003 |
Here we can see that when disk keeps moving upward direction from 10 mm to 90 mm, mass flow rate will be increased. As disk keeps moving upward flow coefficient increases and flow factow also increases as well.
Conclusion :
The negative signs for the mass flow rates imply that the fluid is exiting the domain. The mass flow rate is calculated for the stopper lifts from 10mm to 90mm. The mass flow rate increases with the increase in the lift of the disk. When the stopper is lifted gradually, the space available for the passage of the fluid increases hence the mass flow increases.
When we perform the parametric study, Ansys automatically changes the mesh as per new geometry using the same mesh specifications given earlier, and solves and calculates the output parameters, thereby saving time comparatively if it was done manually.
In the parametric study of the gate valve, it was found that as the valve disk is lifted gradually, the mass flow rate of the fluid increases, and hence the flow factor and flow coefficient increases.