Week 9 - Parametric study on Gate valve.
Aim:- Performing a parametric study on the gate valve simulation by setting the opening from 10 % to 80%.
Objective:-
- Obtain the mass flow rates at the outlet for each design point.
- Calculate the flow coefficient and flow factor for each opening and plot the graph.
- Discuss the results of the mass flow rate and flow coefficient.
Introduction:-
Gate valves are used to shut off the flow of liquids rather than for flow regulation. When fully open, the typical gate valve has no obstruction in the flow path, resulting in very low flow resistance. The size of the open flow path generally varies in a nonlinear manner as the gate is moved. This means that the flow rate does not change evenly with stem travel. Depending on the construction, a partially open gate can vibrate from the fluid flow.
Gate valves are mostly used with larger pipe diameters (from 2" to the largest pipelines) since they are less complex to construct than other types of valves in large sizes.
At high pressures, friction can become a problem. As the gate is pushed against its guiding rail by the pressure of the medium, it becomes harder to operate the valve. Large gate valves are sometimes fitted with a bypass controlled by a smaller valve to be able to reduce the pressure before operating the gate valve itself.
Gate valves without an extra sealing ring on the gate or the seat are used in applications where minor leaking of the valve is not an issue, such as heating circuits or sewer pipes.
Parametric study
A Parametric study is a study that influences design variables in the product design model to explore design alternatives that can effectively support product concept designs. A parametric study is simple and easy to perform as long as the mapping between CAD and simulation models has been established.
Procedure:-
Geometry
Importing the geometry in space claim
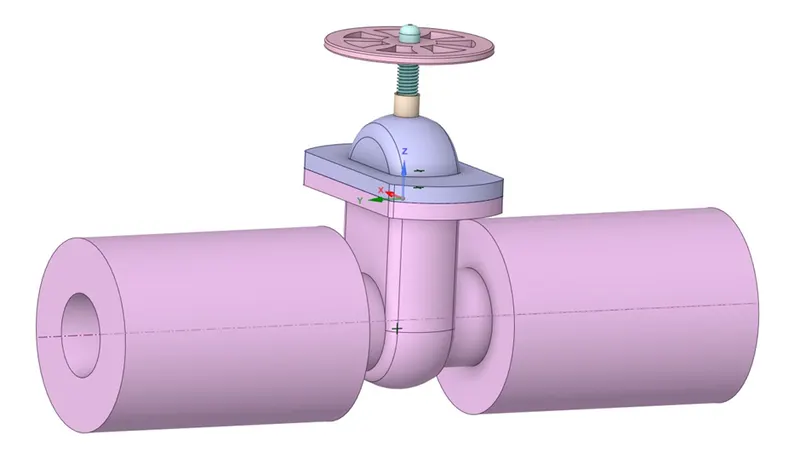
After importing the geometry and hiding the ‘Bottom’ part, we can see the ‘Gate Disc’
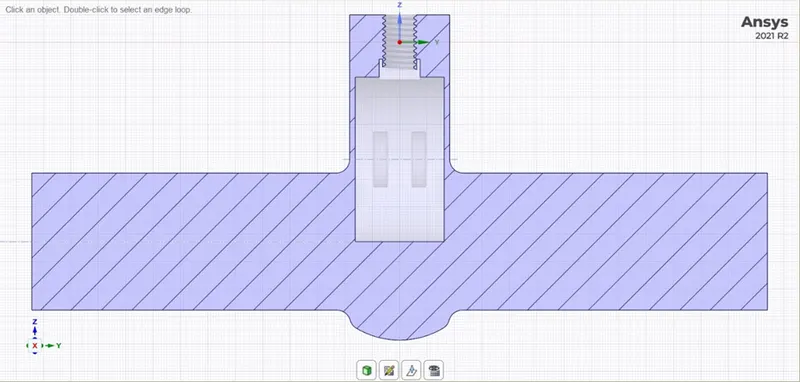
Selecting the ‘Gate Disc’ component and moving it upward by 10mm as shown below
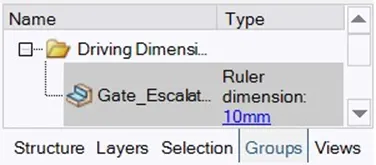
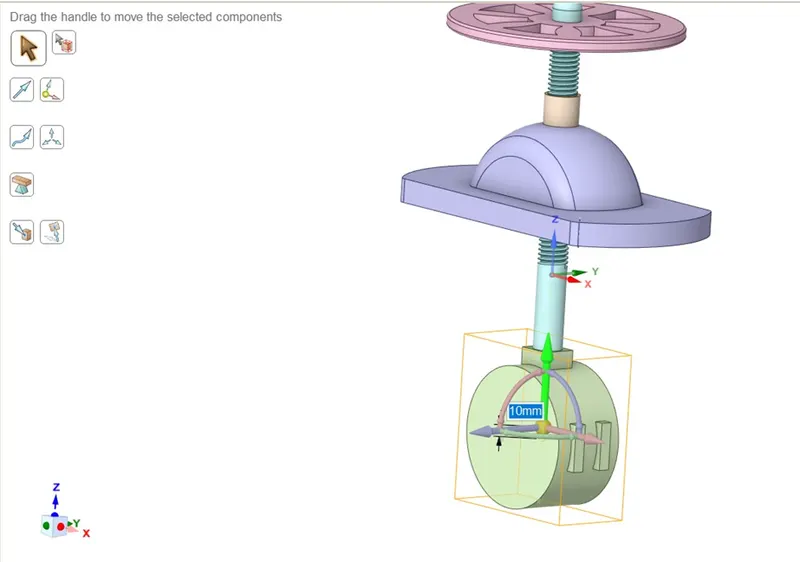
Under ‘Group’ create ‘Script parameter’ so that we can vary the lift and continue with the simulation directly.
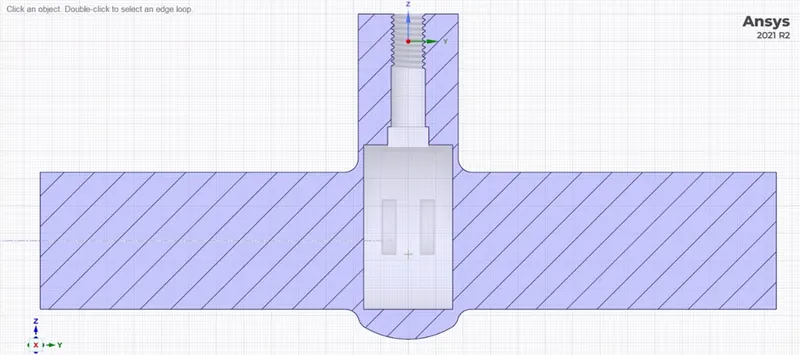
Extracted Volume of fully closed valve
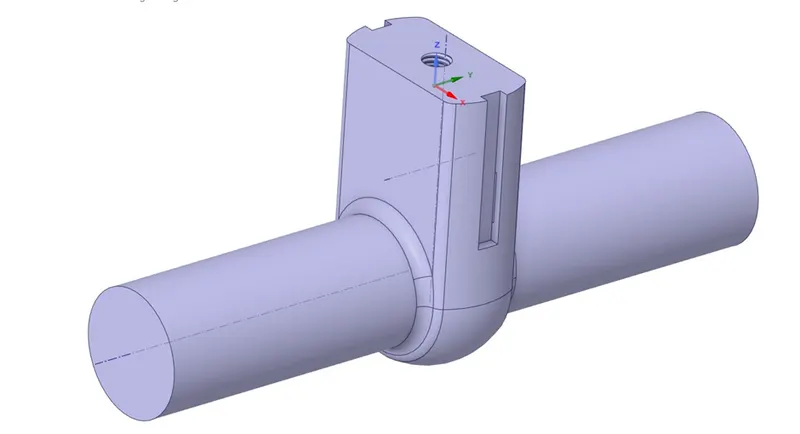
Sectional view of fully closed valve
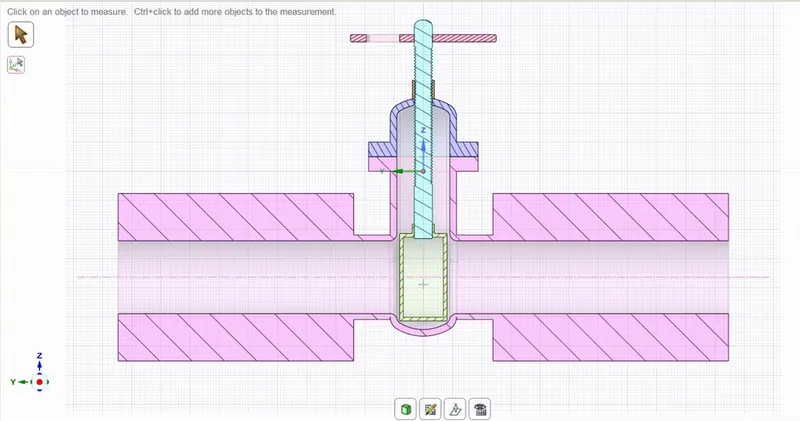
After creating the fluid volume, hiding all the parts and supressing it for physics. As the simulation would be performed on the Extracted volume part only
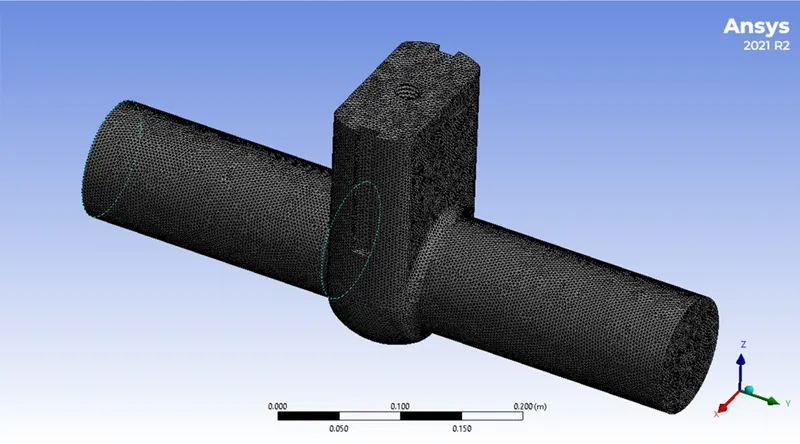
Meshing
Meshing of the extracted volume is done with 3mm mesh size
Setup
Analysis type: Steady State
Solver: Pressure based
Material Specification
Material: Water
Density: 998.2 `(kg)/m^3`
Viscosity: 0.001003 `(kg)/(m*s)`
Selecting Realizable ‘K-epsilon’ Viscous model with Scalable Wall Functions
Boundary conditions:
Inlet
Type: Pressure-Inlet
Gauge Pressure: 10 Pa
Outlet
Type: Pressure-outlet
Gauge Pressure: 0 Pa
Wall
Type: Wall
Wall motion: Stationary wall
Shear condition: No slip
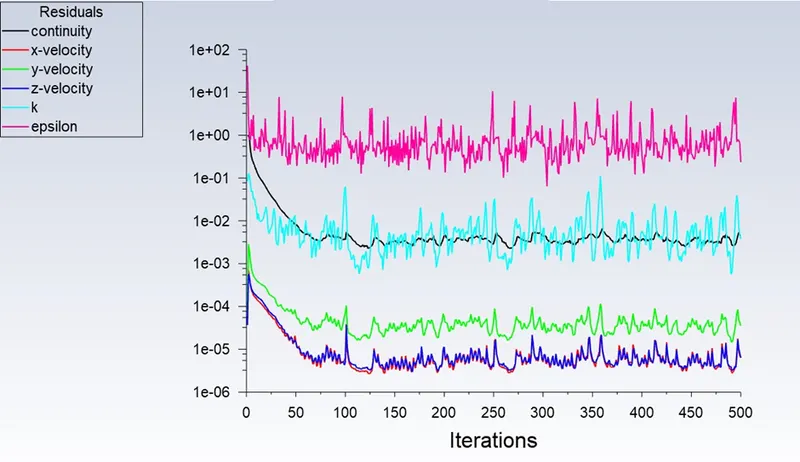
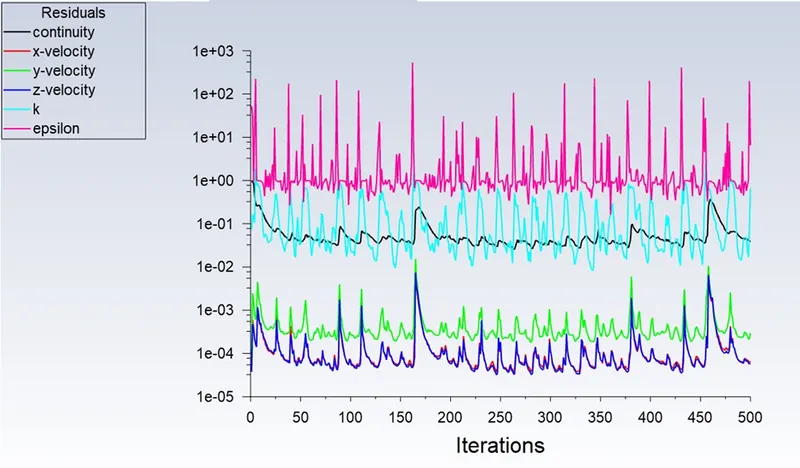
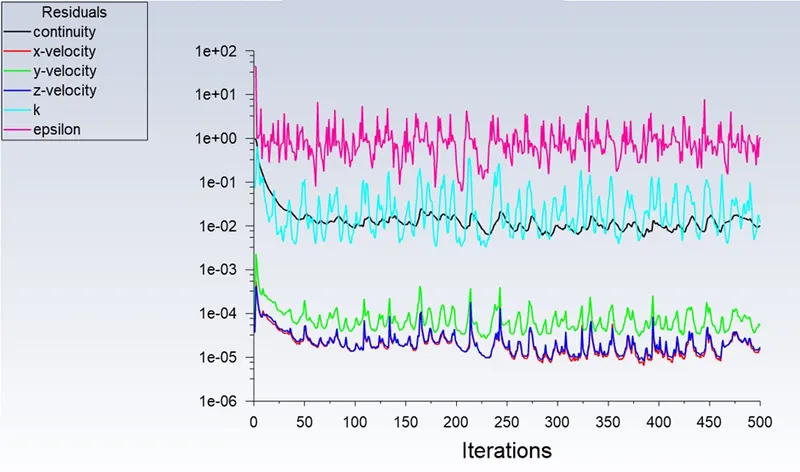
The solution is then Initialized with “Standard Initialization” and run for 500 iterations
Results
Flow coefficient
The flow coefficient of a device is a relative measure of its efficiency at allowing fluid flow. It describes the relationship between the pressure drop across an orifice valve or other assembly and the corresponding flow rate.
Mathematically the flow coefficient `C_v` can be written as
`C_v = Q*sqrt(S_g/(DeltaP))`
Where
Q is the flow rate in US gallons per minute
`S_g` is the specific gravity
`DeltaP` is the pressure drop across the valve in psi
The use of flow coefficient offers a standard method of comparing valve capacities and sizing valves for specific applications that is widely accepted by industry. The general definition of the flow coefficient can be expanded into equations modelling the flow of liquids, gases and steam using the discharge coefficient
Flow Factor
The metric equivalent flow factor is calculated using metric units
`K_v = Q*sqrt(S_g/(DeltaP))`
Where
Q is the flow rate in cubic meters per hour
`S_g` is the specific gravity
`DeltaP` is the pressure drop across the valve in bar
`K_v` can be calculated from `C_v` using the equation
`K_v = 0.865*C_v`
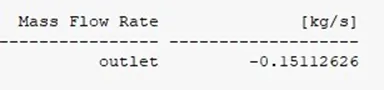
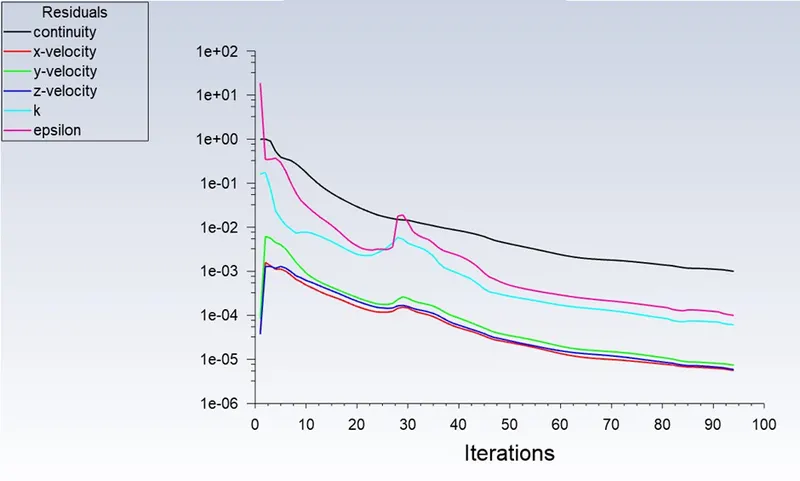
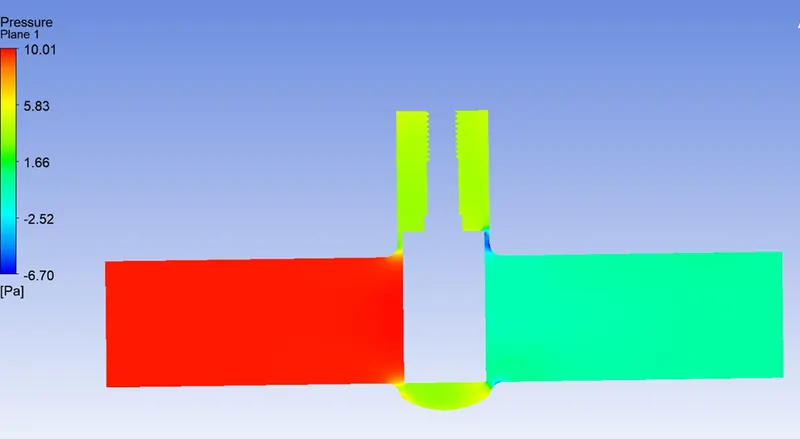
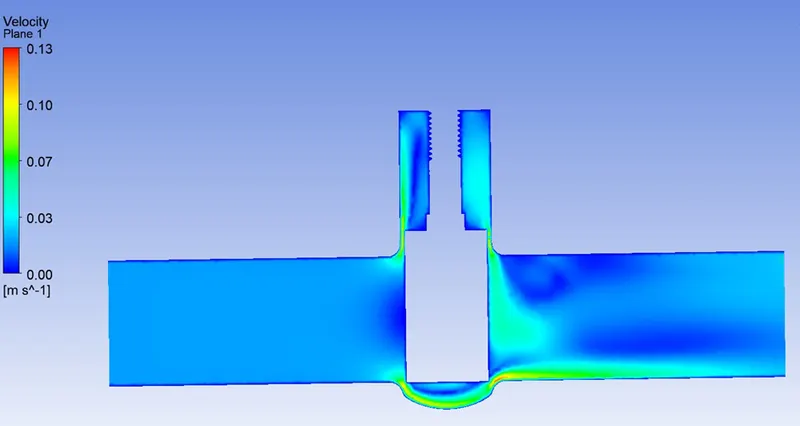
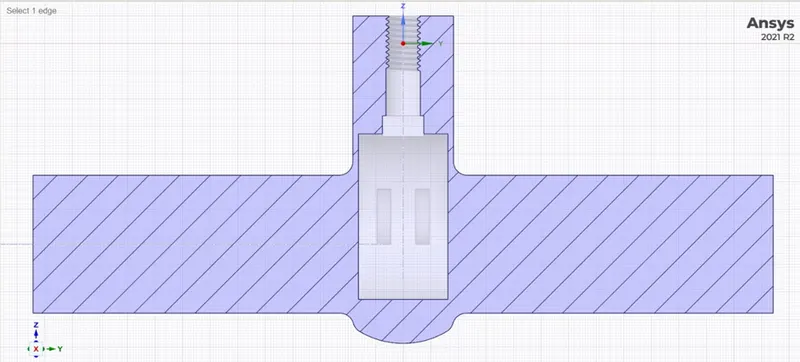
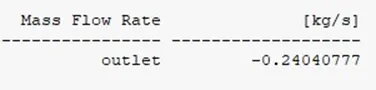
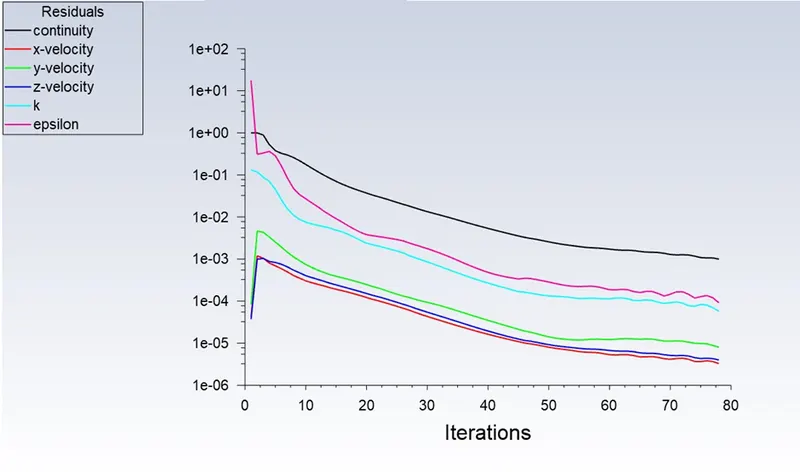
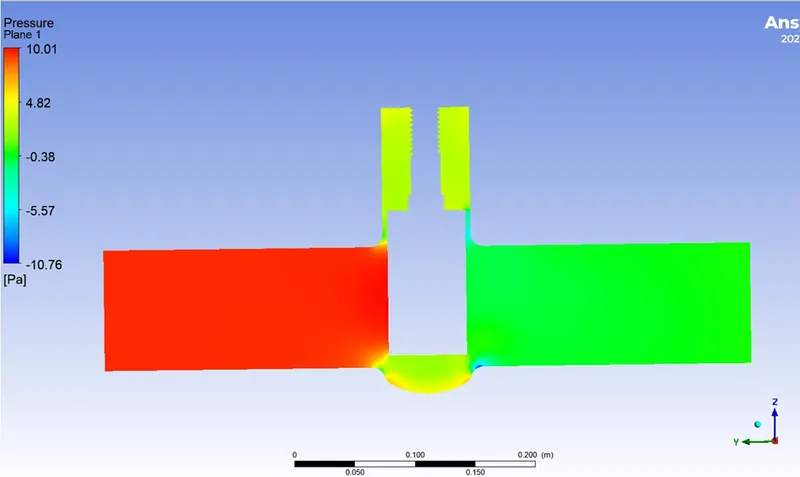
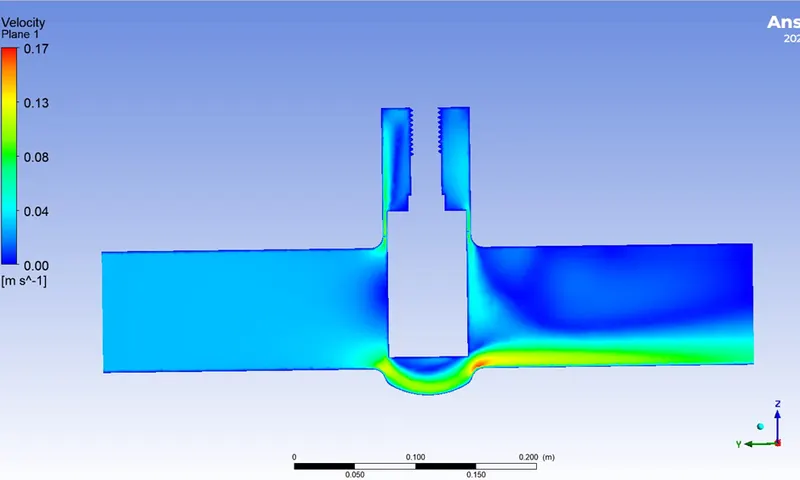
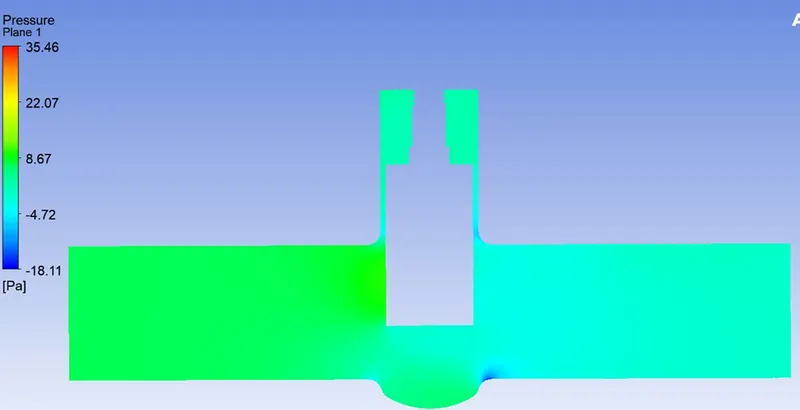
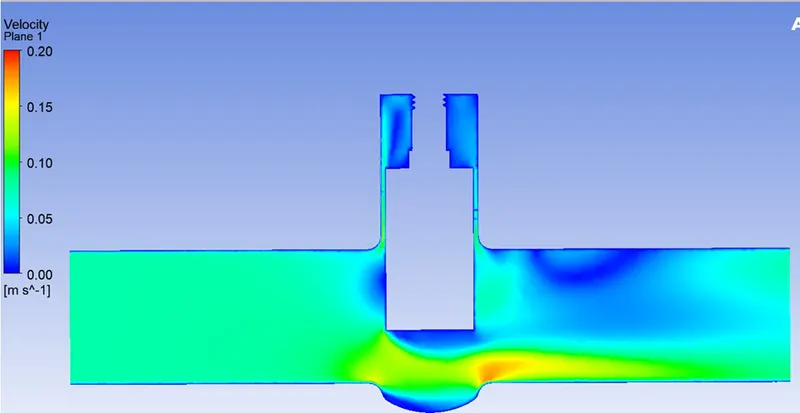
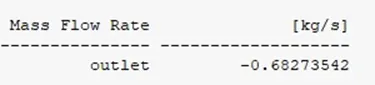
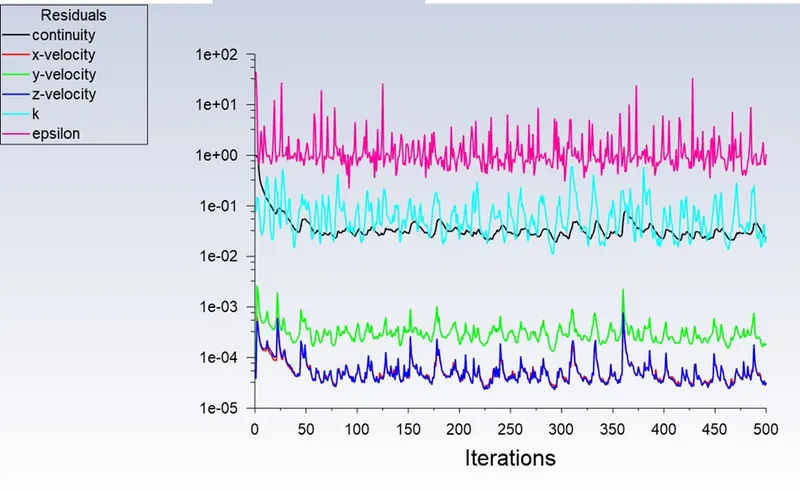
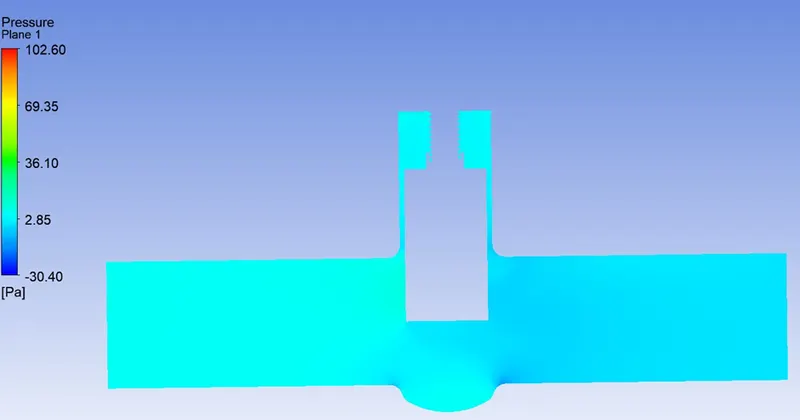
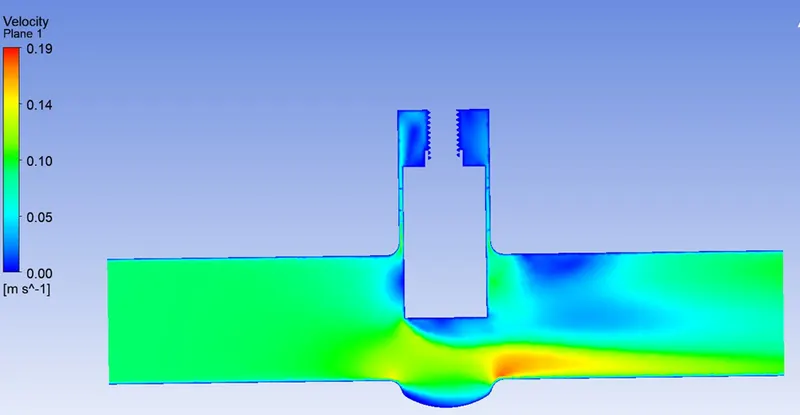
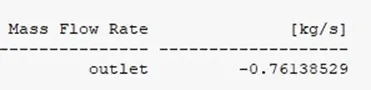
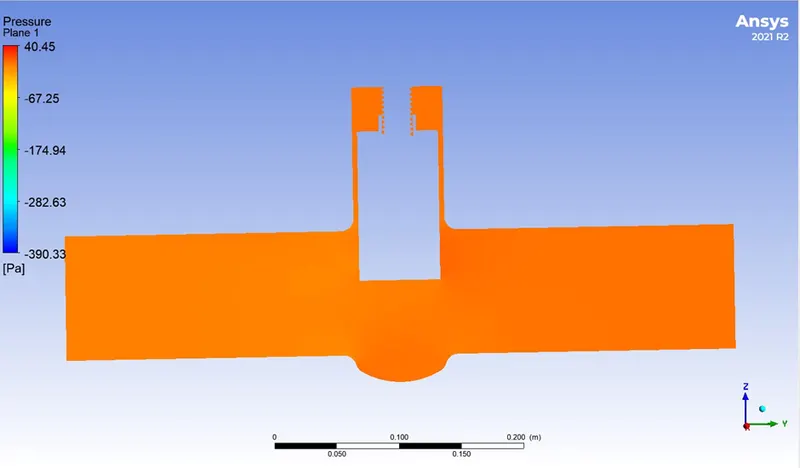
The Sectional view of Lift, Mass Flow Rate, Residuals, Pressure contour and Velocity contour respectively are shown below for each case
10% Lift
20% Lift
30% Lift
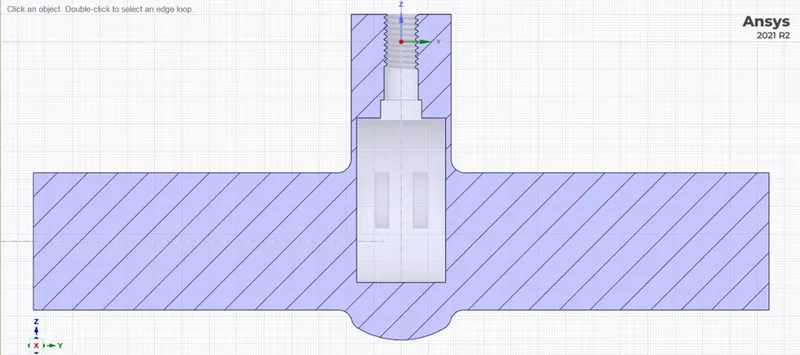
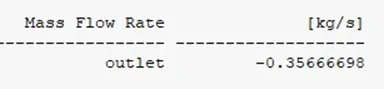
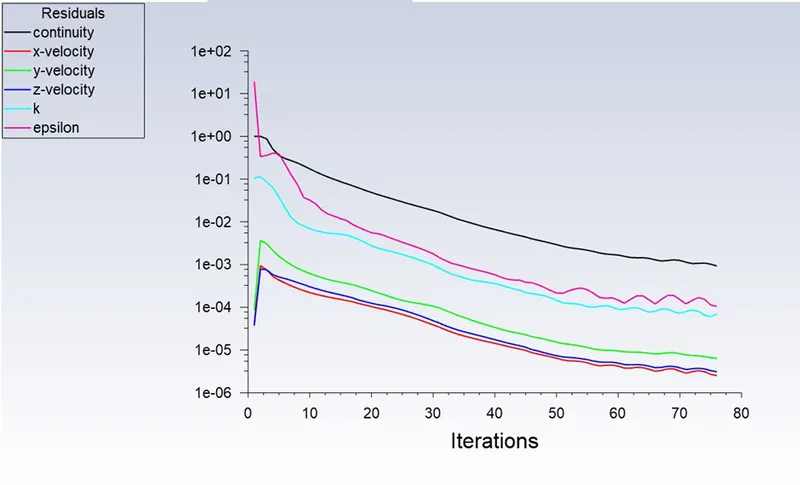
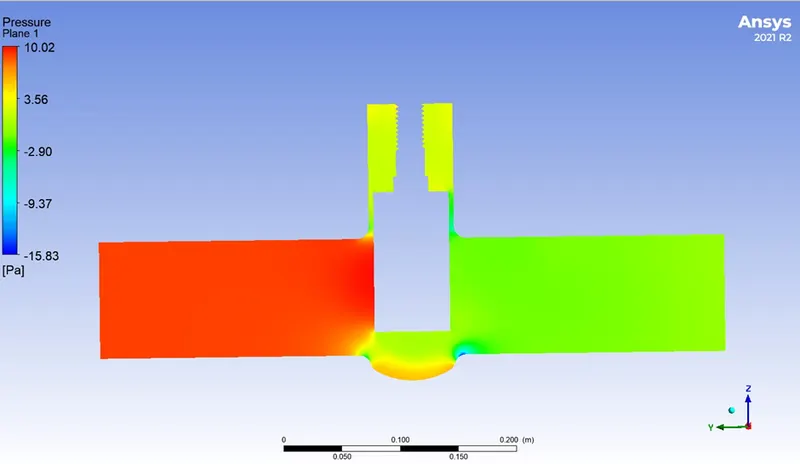
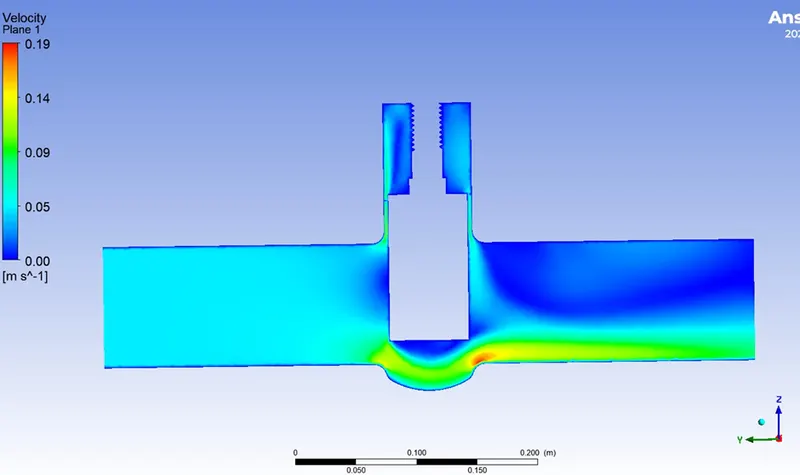
40% Lift
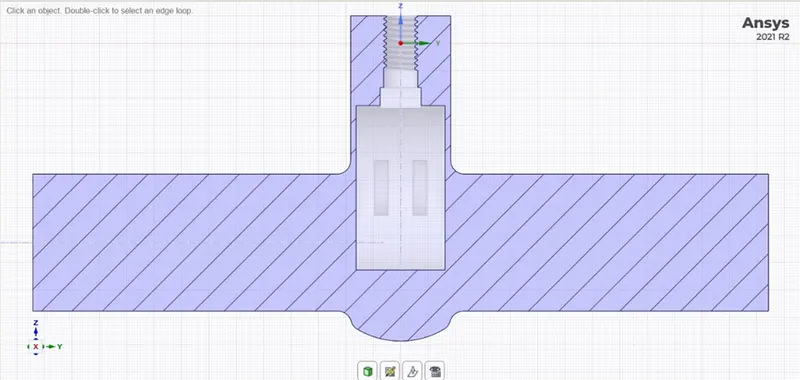
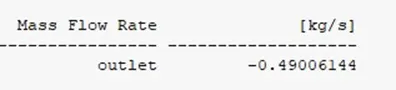
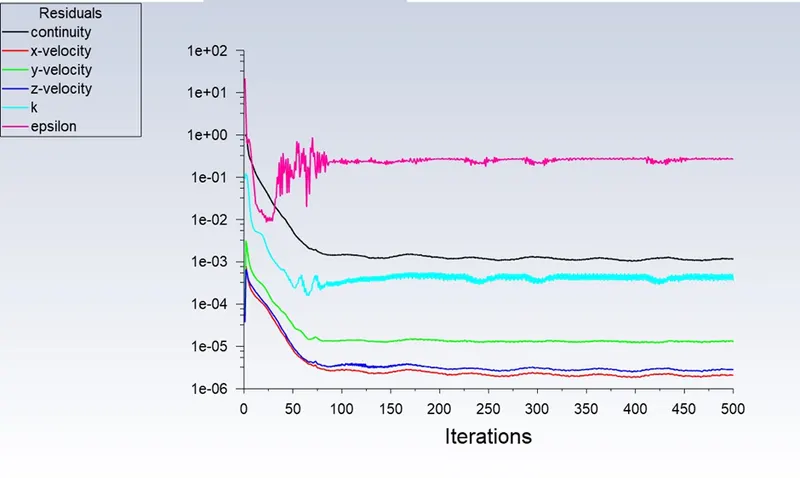
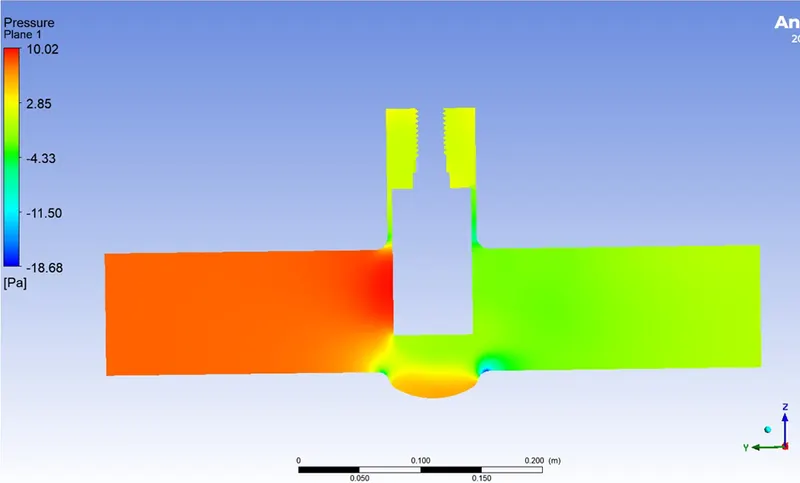
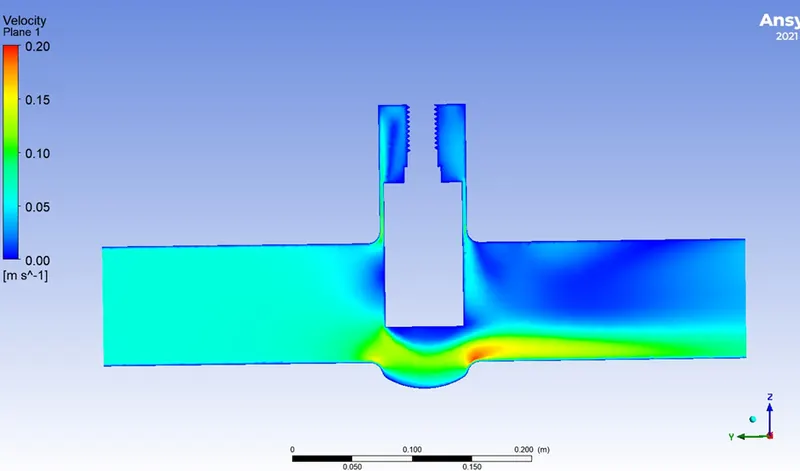
50% Lift
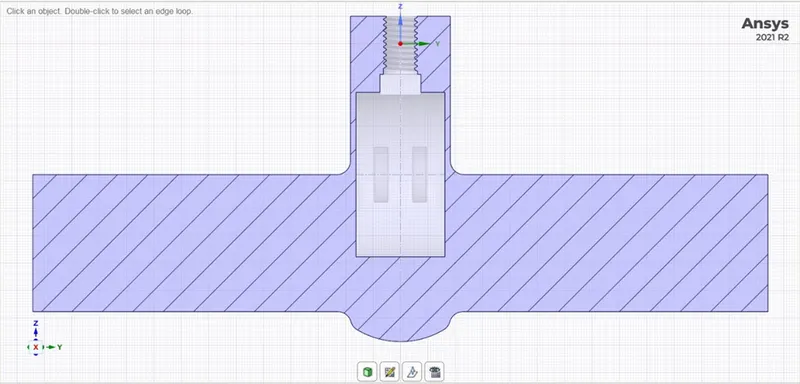
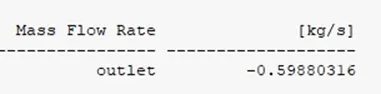
60% Lift
70% Lift
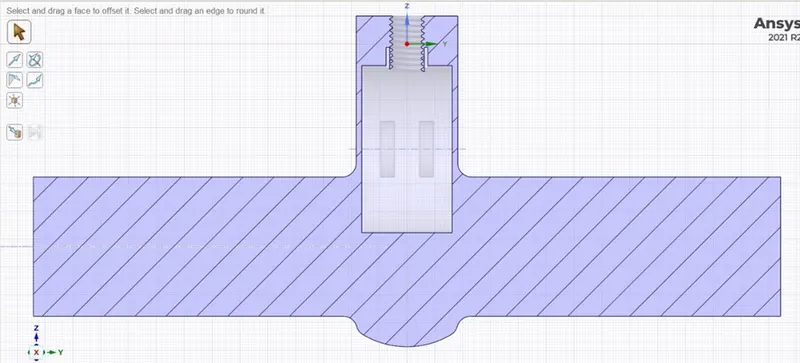
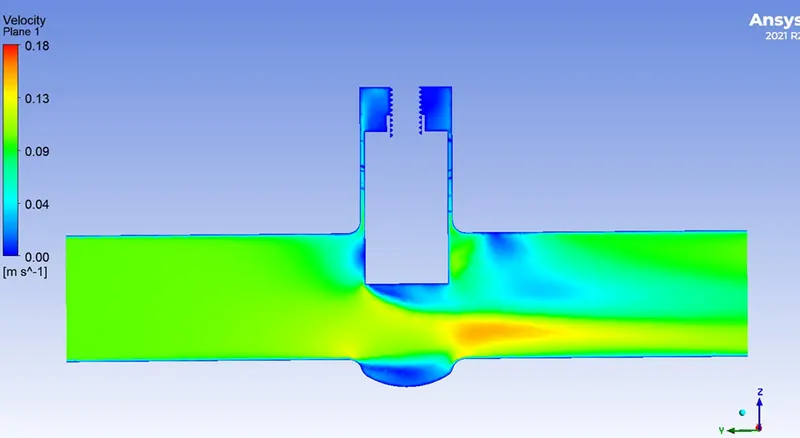
80% Lift
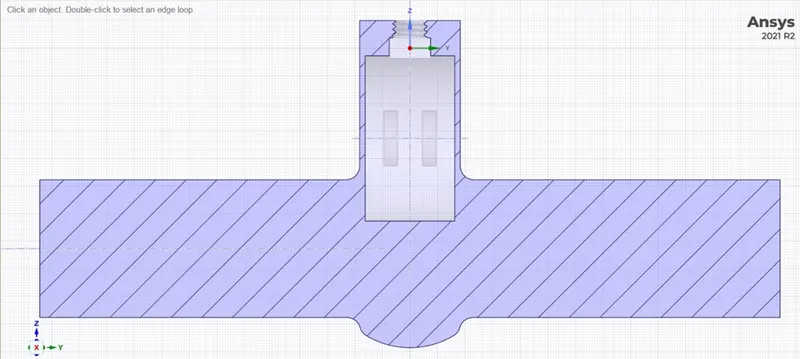
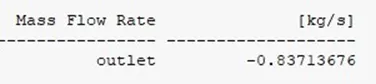
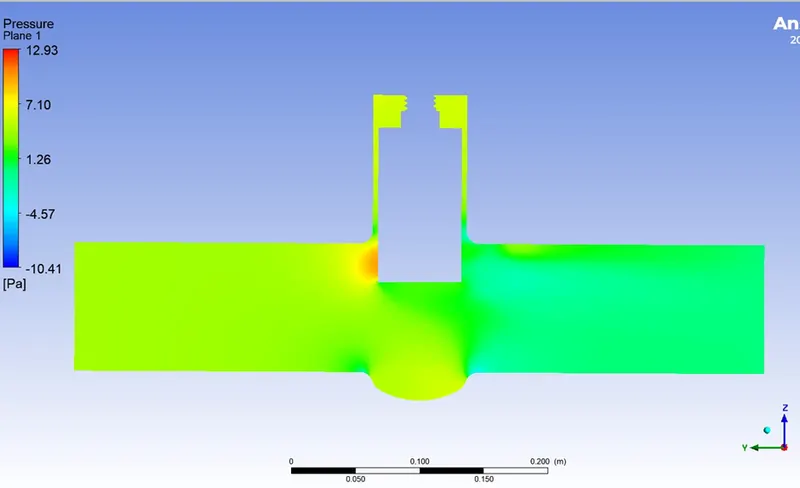
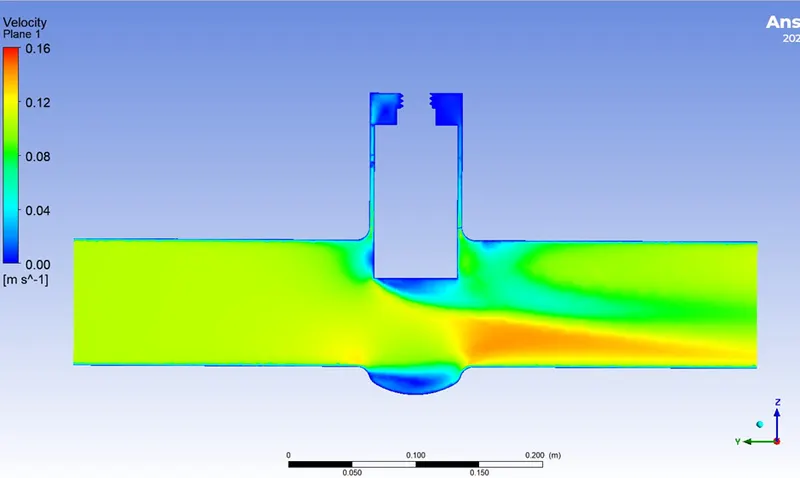
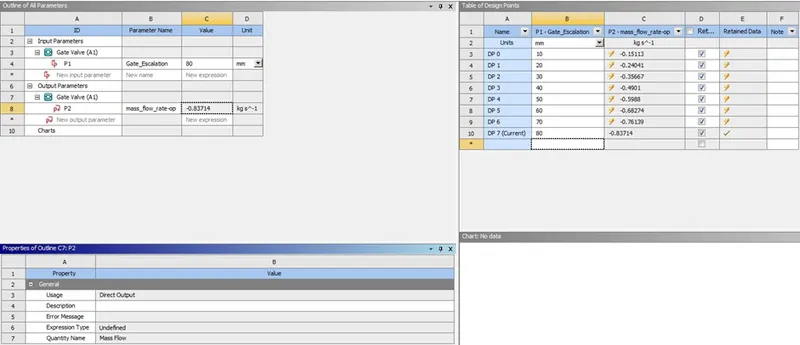
The negative sign in Mass Flow Rate indicates that the mass is flowing out of the valve
|
Lift (%) |
Mass flow rate `((kg)/s)` |
Flow coefficient `(C_v)` |
Flow factor `(K_v)` |
|
10 |
0.15113 |
0.047791 |
0.041339 |
|
20 |
0.24041 |
0.07602 |
0.0657573 |
|
30 |
0.35667 |
0.112788 |
0.097561 |
|
40 |
0.4901 |
0.154983 |
0.13406 |
|
50 |
0.5988 |
0.189357 |
0.163793 |
|
60 |
0.68274 |
0.215901 |
0.186754 |
|
70 |
0.76139 |
0.240772 |
0.208267 |
|
80 |
0.83714 |
0.264726 |
0.228987 |
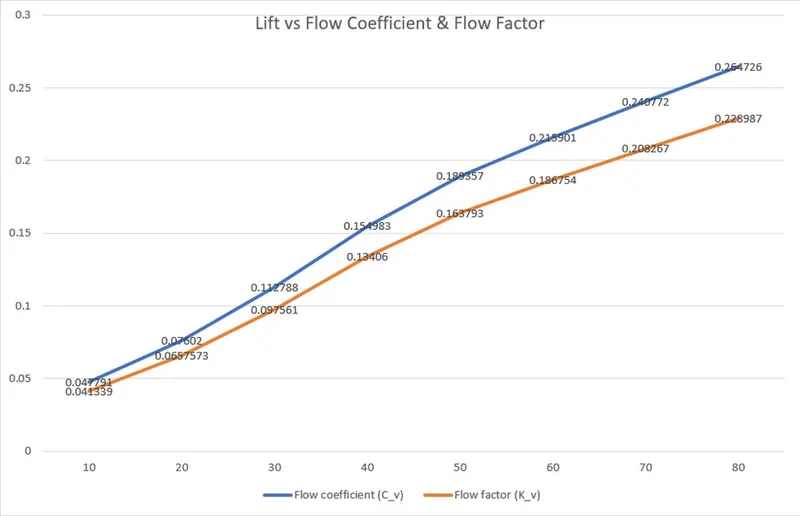
Below is Graph of Lift vs Flow Coefficient and Flow Factor
Conclusion
As it can be seen above in the graph that as the lift of the valve increases, the mass flow rate increases and so the Flow Coefficient and the Flow Factor
The Flow Coefficient and the Flow Factor increases almost linearly with the lift
Thus parametric study helps to analyse the different positions of valve opening and gives the benefit to get easy and quick results