Project 2 - Rankine cycle Simulator
AIM:-
- Creating a Rankine Cycle Simulator using MATLAB.
- The code should calculate the state points of the Rankine Cycle based on user inputs.
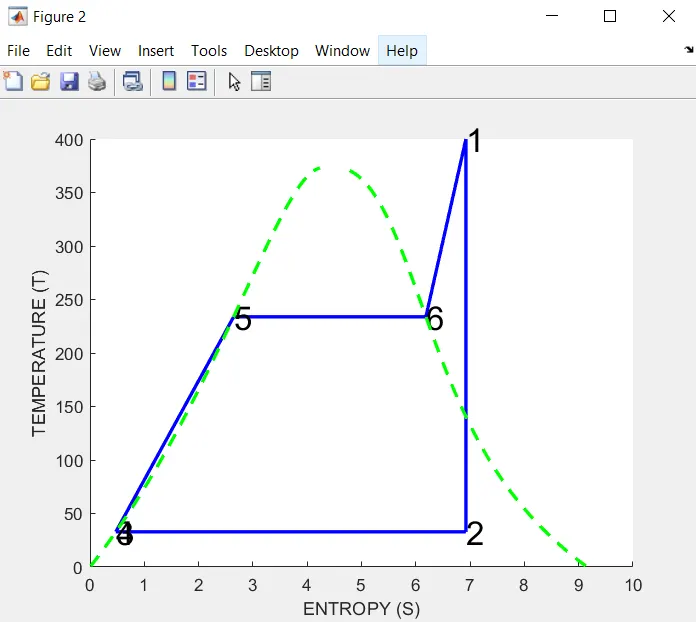
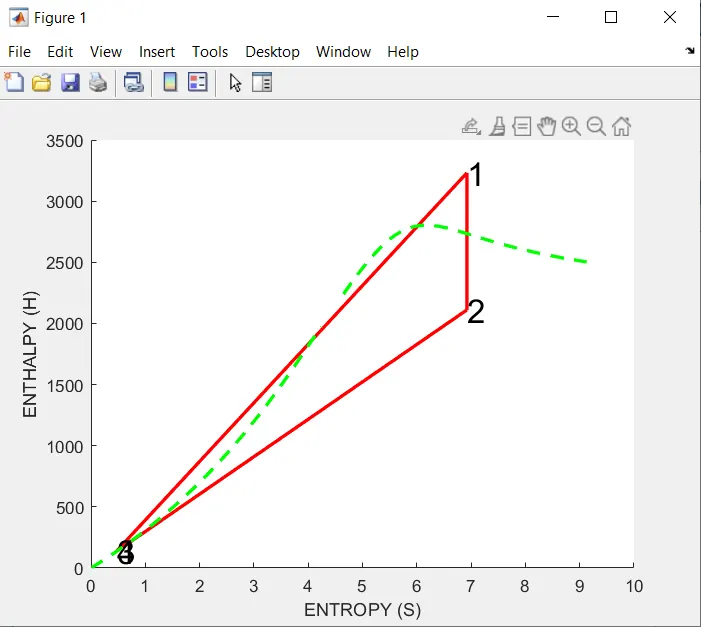
- Then, plotting the corresponding T-s and h-s plots for the given set of inputs.
- The presentation of your code will be taken into consideration while grading.
- Attaching a report explaining the working of a rankine cycle simulator and also the research done by me.
Theory:-
The Rankine cycle is the fundamental operating cycle of all power plants where an operating fluid is continuously evaporated and condensed. The selection of operating fluid depends mainly on the available temperature range
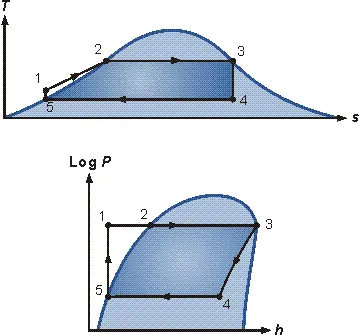
The pressure-enthalpy (p-h) and temperature-entropy (T-s) diagrams of this cycle are given in the figure. The Rankine cycle operates in the following steps:
- Isobaric Heat Transfer. High pressure liquid enters the boiler from the feed pump (1) and is heated to the saturation temperature (2). Further addition of energy causes evaporation of the liquid until it is fully converted to saturated steam (3).
- Isentropic Expansion. The vapor is expanded in the turbine, thus producing work which may be converted to electricity. In practice, the expansion is limited by the temperature of the cooling medium and by the erosion of the turbine blades by liquid entrainment in the vapor stream as the process moves further into the two-phase region. Exit vapor qualities should be greater than 90%.
- Isobaric Heat Rejection. The vapor-liquid mixture leaving the turbine (4) is condensed at low pressure, usually in a surface condenser using cooling water. In well designed and maintained condensers, the pressure of the vapor is well below atmospheric pressure, approaching the saturation pressure of the operating fluid at the cooling water temperature.
- Isentropic Compression. The pressure of the condensate is raised in the feed pump. Because of the low specific volume of liquids, the pump work is relatively small and often neglected in thermodynamic calculations.
Figure 1. Rankine cycle.
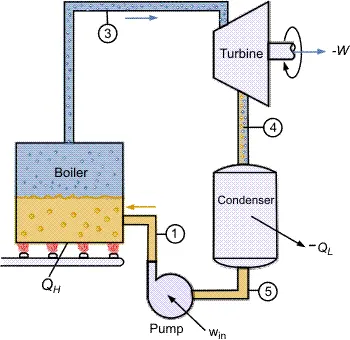
Figure 2. T-s and p-h diagrams.
The efficiency of the cycle is given by
`eta_t=(W_T -W_p)/Q_s`
Where,
`eta_t`=Thermal efficiency of the cycle
`W_t`=Work produced by turbine
`W_p`=Work consumed by pump
`Q_s`=Heat supplied in the boiler
PROGRAM:-
There is a Function named ‘XSteam’ from where I have extracted the data’s
P1=input('Inlet Pressure: ');
T1=input('Inlet Temperature: ');
P2=input('Outlet Pressure: ');
gamma=1.4;

P4=P1;
P3=P2;
%Calculating temperatures
index=(gamma-1)/gamma;
T2=T1*((P2/P1)^index);

%For calculating H-S diagram
%At state 1
H1=XSteam('h_pT',P1,T1);
S1=XSteam('s_pT',P1,T1);

%At state 2
S2=S1;
T2=XSteam('T_ps',0.05,S2);
%calculating saturated liquid and vapour entropies
s_f1=XSteam('sL_p',0.05);
s_g1=XSteam('sV_p',0.05);
s_fg1=s_g1-s_f1;

%Calculating dryness fraction
x1=(S2-s_f1)/s_fg1;
%Calculating saturated liquid and vapour enthalpies
h_f1=XSteam('hL_p',0.05);
h_g1=XSteam('hV_p',0.05);
h_fg1=h_g1-h_f1;
H2=h_f1+x1*h_fg1;

%At state 3
H3=XSteam('hL_p',0.05);
S3=XSteam('sL_p',0.05);
T3=XSteam('T_ps',0.05,S3);
v3=XSteam('vL_p',P2);

%At state 4
S4=S3;
H4=XSteam('h_ps',30,S4);

%Calculating the curve of saturated liquid and vapour line
temp=linspace(1,373,500);
for i=1:length(temp)
    h_liquid(i)=XSteam('hL_T',temp(i));
    h_vapour(i)=XSteam('hV_T',temp(i));
    s_liquid(i)=XSteam('sL_T',temp(i));
    s_vapour(i)=XSteam('sV_T',temp(i));
end

%for calculating T-S diagram

%At state 2
T2=XSteam('T_ps',P2,S2);
%At state 3
T3=XSteam('T_ps',P2,S3);
%At state 4
T4=XSteam('T_ps',P1,S4);
%calculating Temperatures and Entropies at saturated points
S_sat_L=XSteam('sL_p',P1);
S_sat_V=XSteam('sV_p',P1);
T_sat_L=XSteam('T_ps',P1,S_sat_L);
T_sat_V=XSteam('T_ps',P1,S_sat_V);

%Calculating all the outputs
W_turbine=H1-H2;
W_pump=v3*(P1-P2);
W_net=W_turbine-W_pump;
Q_supplied=H1-H4;
Efficiency=(W_net/Q_supplied)*100;
Steam_rate=3600/(W_turbine-W_pump);

%printing all the values
fprintf('At state 1:\n P1: %f bar\n T1: %f C\n H1: %f kJ/kg\n S1: %f kJ/kg-K\n',P1,T1,H1,S1);
fprintf('At state 2:\n P2: %f bar\n T2: %f C\n H2: %f kJ/kg\n S2: %f kJ/kg-K\n',P2,T2,H2,S2);
fprintf('At state 3:\n P3: %f bar\n T3: %f C\n H3: %f kJ/kg\n S3: %f kJ/kg-K\n',P3,T3,H3,S3);
fprintf('At state 4:\n P4: %f bar\n T4: %f C\n H4: %f kJ/kg\n S4: %f kJ/kg-K\n',P4,T4,H4,S4);
fprintf('Work of Turbine is: %f kJ/kg\n',W_turbine);
fprintf('Work of Pump is: %f kJ/kg\n',W_pump);
fprintf('Net work is: %f kJ/kg\n',W_net);
fprintf('Heat supplied is: %f kJ/kg\n',Q_supplied);
fprintf('Efficiency is: %f\n',Efficiency);
fprintf('Rate of Steam is: %f kg/kWh\n',Steam_rate);


%plotting the graph of H-S
figure(1)
hold on
plot([S1,S2],[H1,H2],'linewidth',2,'color','r');
plot([S2,S3],[H2,H3],'linewidth',2,'color','r');
plot([S3,S4],[H3,H4],'linewidth',2,'color','r');
plot([S1,S4],[H1,H4],'linewidth',2,'color','r');
text(S1,H1,'1','Fontsize',20)
text(S2,H2,'2','Fontsize',20)
text(S3,H3,'3','Fontsize',20)
text(S4,H4,'4','Fontsize',20)

%plotting saturated curve
plot(s_vapour,h_vapour,'--','linewidth',2,'color','g');
plot(s_liquid,h_liquid,'--','linewidth',2,'color','g');
xlabel('ENTROPY (S)');
ylabel('ENTHALPY (H)');

%plotting the graph of T-S
figure(2)
hold on
plot([S1,S2],[T1,T2],'linewidth',2,'color','b');
plot([S2,S3],[T2,T3],'linewidth',2,'color','b');
plot([S3,S4],[T3,T4],'linewidth',2,'color','b');
plot([S4,S_sat_L],[T4,T_sat_L],'linewidth',2,'color','b');
plot([S_sat_L,S_sat_V],[T_sat_L,T_sat_V],'linewidth',2,'color','b');
plot([S_sat_V,S1],[T_sat_V,T1],'linewidth',2,'color','b');
text(S1,T1,'1','Fontsize',20)
text(S2,T2,'2','Fontsize',20)
text(S3,T3,'3','Fontsize',20)
text(S4,T4,'4','Fontsize',20)
text(S_sat_L,T_sat_L,'5','Fontsize',20)
text(S_sat_V,T_sat_V,'6','Fontsize',20)

%plotting saturated curve
plot(s_liquid,temp,'--','linewidth',2,'color','g');
plot(s_vapour,temp,'--','linewidth',2,'color','g');
xlabel('ENTROPY (S)')
ylabel('TEMPERATURE (T)')
PLOTS:-
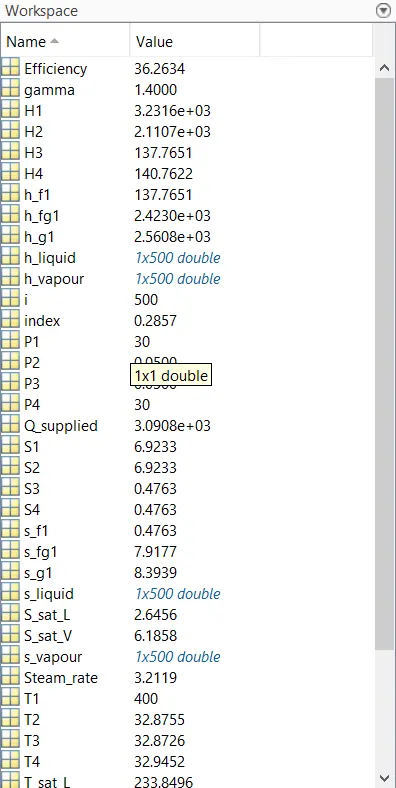
WORKSPACE:-
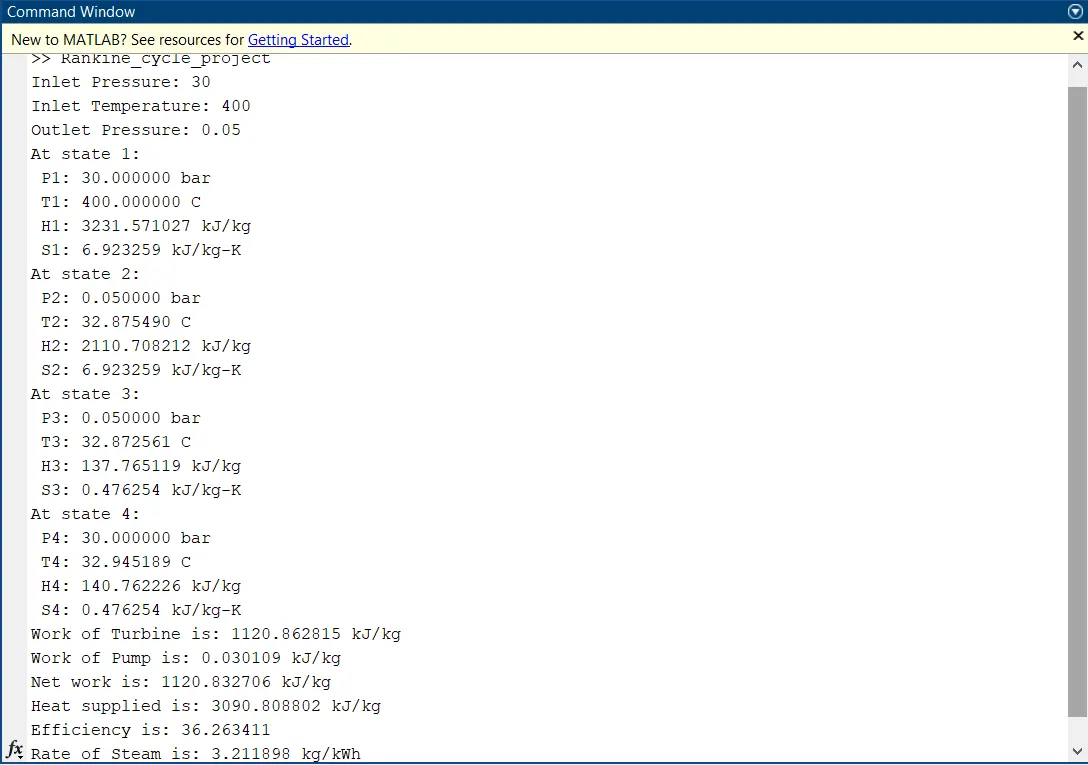
RESULTS:-
EXPLAINATION:-
- The program will take the inputs from the user i.e Inlet pressure, Inlet Temperature, Outlet Pressure
- After that we will extract all the quantities required for calculation and plotting the graph from the Function ‘XSteam’, Using XSteam(‘function’,in1,in2). Where ‘function’ means what we have to find at points ‘in1’ & ‘in2’ respectively. For Example: XSteam('h_pt',1,20) Returns the enthalpy of water at 1 bar and 20 degC.
- After the extraction of all the data we will plot the graphs of T-S, H-S.
- Using ‘fprintf’ we will print the results that we have calculated
CONCLUSION:-
Hence we have calculated and plotted all the points and all the outputs asked in the above Project using the Function ‘XSteam’.