Week 9 - Parametric study on Gate valve.
AIM:
The objective of the report is to perform a parametric study on Gate valve using Ansys fluent and validate the results. Parametric study is to be performed for different valve opening percentages and parameters such as mass flow rate, Pressure drop, flow coefficient and flow factor are plotted.
THEORY:
A control valve is used to control fluid flow by varying the size of the flow passage as directed by a signal from a controller. Along with the flow rate of fluid, different flow parameters such as pressure, temperature and other variables are also controlled using control valves.
Depending on the action of the closure membrane, control valves are classified into two types -
- Sliding stem - These valves use linear motion to move a closure member into and out of a seating surface. Some common examples are Gate valve, Globe valve, Diaphragm valve, Pinch valve.
- Rotary - These valves use rotational motion to turn a closure member into and out of a seating surface. Some common examples are Ball valve, Butterfly valve, Plug valve.
Gate Valve -
In Industries most commonly used control valves are gate valves. In this report, simulation is performed on the gate valve. Gate valve is primarily designed to start or stop a flow in a straight-line flow of fluid and situations where minimum flow restrictions are needed. In general, the gate valves are actuated by using a handwheel or motor.
Advantages -
- Very low frictional losses.
- Dual flow direction is possible.
- There are low-pressure drop when valve is opened fully and when it is tightly sealed.
Dis-Advantages -
- Maintainance and repair of gate valves are complex.
- Leakages occurs in gate valves when they are not tightly sealed.
Some commonly used gate valves are Knife gate valve, Solid wedge gate valve, Flexible wedge gate valve, Split wedge (or) Parallel disks gate valve.
Flow Parameters-
In fluid mechanics, losses occurs in the pipe flows and pipe fittings are termed as major and minor losses. The accurate estimation of energy losses that occurs in pipe fittings are important to estimate the correct size of pump required to drive the flow.
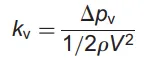
1) Loss coefficient in valves - The loss coefficient(Kv) in the valves is estimated from the pressure drop across the valves.
2) Flow Coefficient - The flow coefficient of a device is a relative measure of its efficiency at allowing the fluid flow. Cv is the flow coefficient expressed in imperial units. The size of the valve is estimated by using flow coefficient.
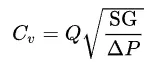 , where Q - flow rate expressed in US gallons per minute
SG - Specific gravity
ΔP - Pressure drop in PSI
3) Flow Factor - The flow factor is also known as the flow coefficient of a device expressed in metric units.
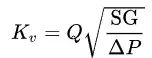 , where Q - flow rate expressed in m3/hr
SG - Specific gravity
ΔP - Pressure drop in bar
Kv = 0.862 Cv
PROCEDURE:
In this report, parametric study of gate valve card is performed for different valve openings from 10% to 80%.
Step 1 - Geometry
First import the cad model in space claim.
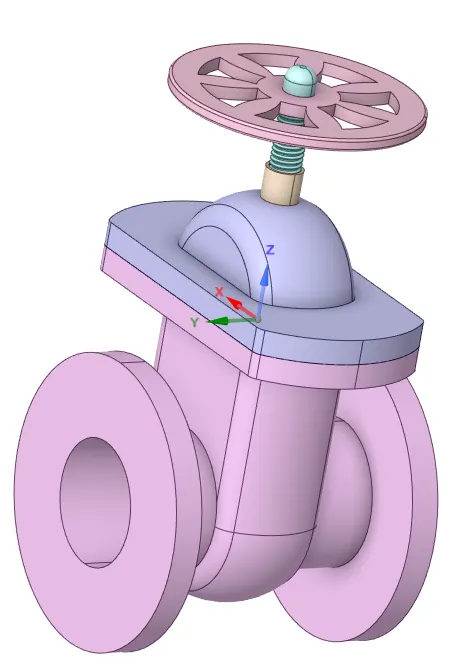
The cad model contains the following parts.
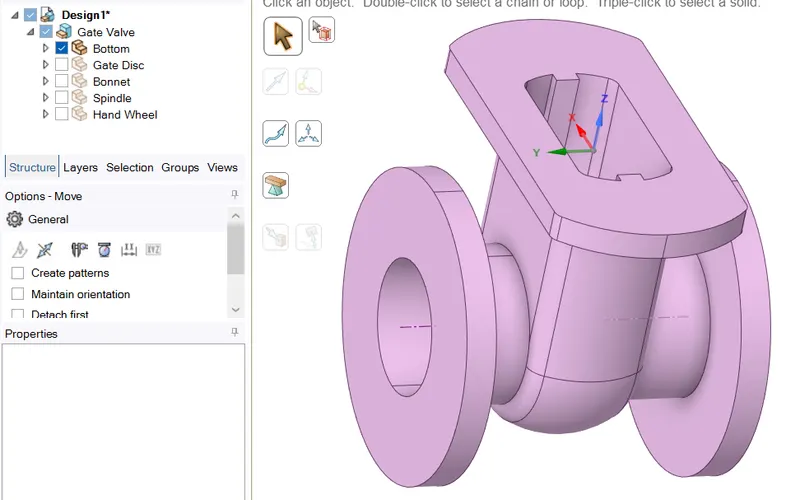
1) Bottom - is the main part of the valve that connects the pipe.
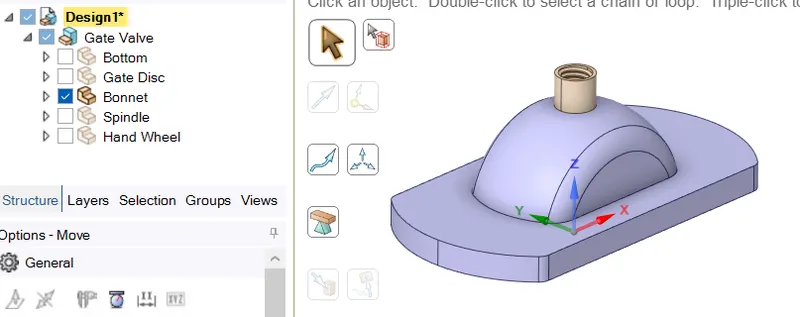
2) Bonnet - is placed above the bottom part, which prevents leaking of fliud.
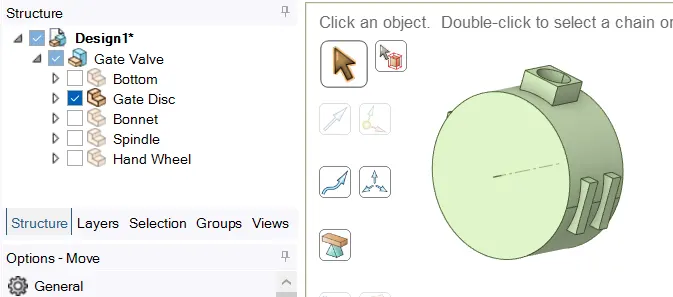
3) Gate Disc - is the closure membrane that obstructs the fluid flow.
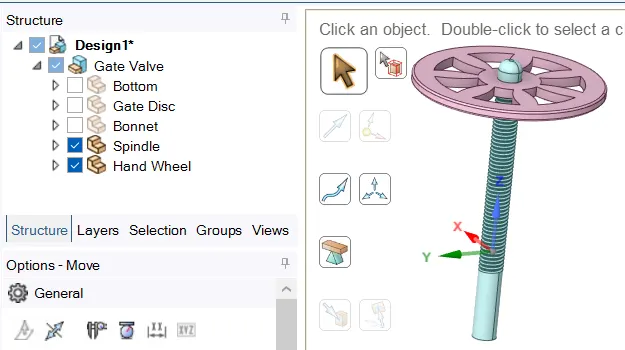
4) Spindle and Hand wheel - is attached to the gate disc. Rotating the hand wheel will actuates the linear motion to the gate disk.
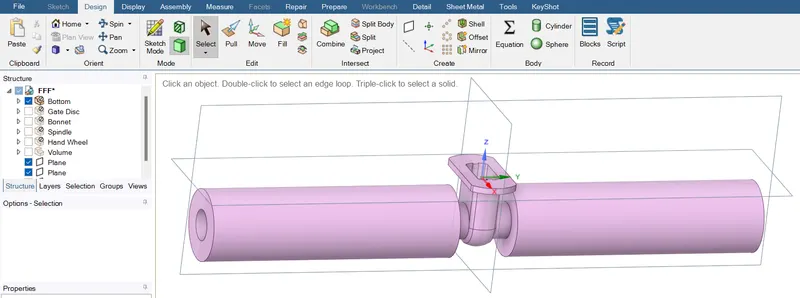
Next, to visualize fluid flow accurately, extend the faces by 800mm on both sides by Design -> Pull as shown in the fig.
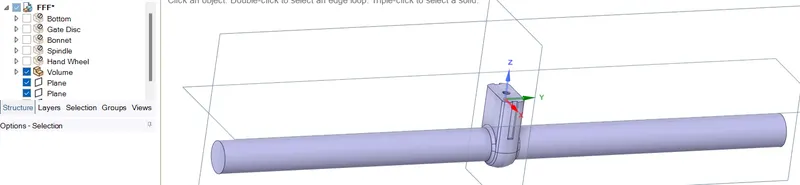
Next, extract the fluid volume inside the bottom part by Prepare -> Volume extract.
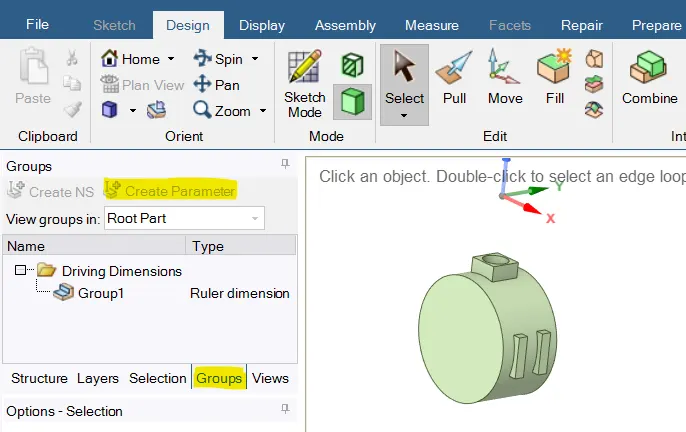
Next, move the gate disc along the z-direction Design -> Pull and parametrize the lift component by Groups -> Create parameter.
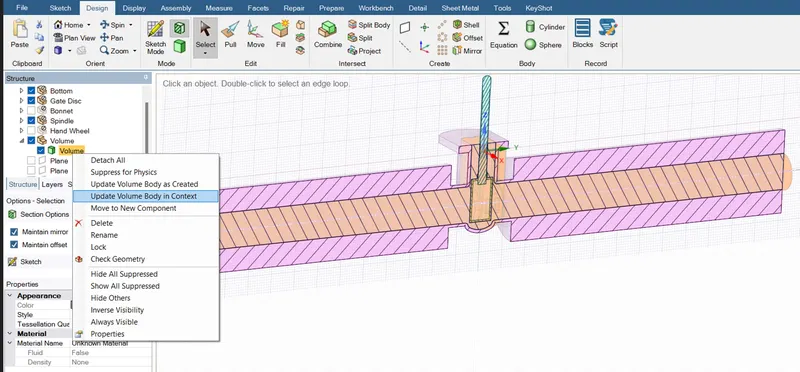
Next, in order to adapt the fluid volume according to the lift generation, by checking Bottom, Gate Disc, Spindle and update the volume body in the contex as shown in the fig. Suppress all the solid geometries.
Step 2 - Mesh
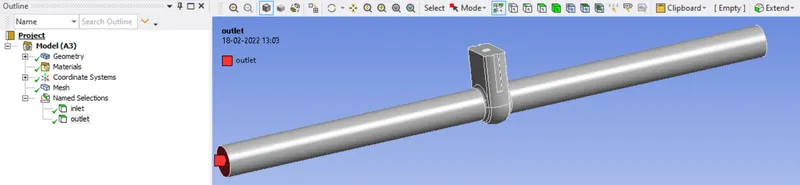
First, before generating the mesh, assign names to the boundaries in named selection as shown in the fig.
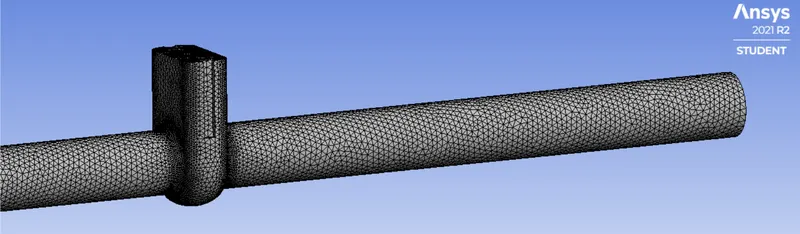
Next, generate mesh of element size 10mm. A total of 1,91,504 elements are generated.

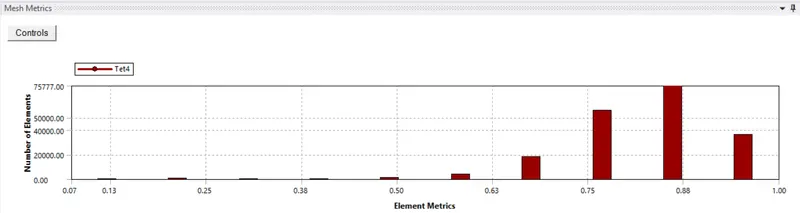
Since, the minimum element quality is 12%, the generated mesh is can produce accurate results.
Step 3 - Setup
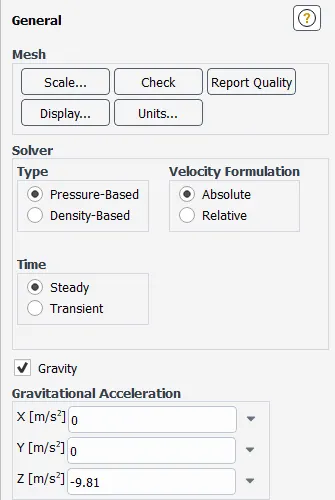
Solver type - Pressure based, Velocity formulation - Absolute, Time - Steady, enable gravity effects.
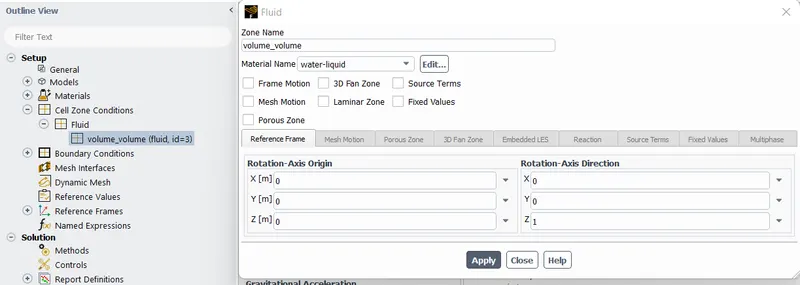
Material - h20 liquid and assign water to fluid volume.
Boundaries -
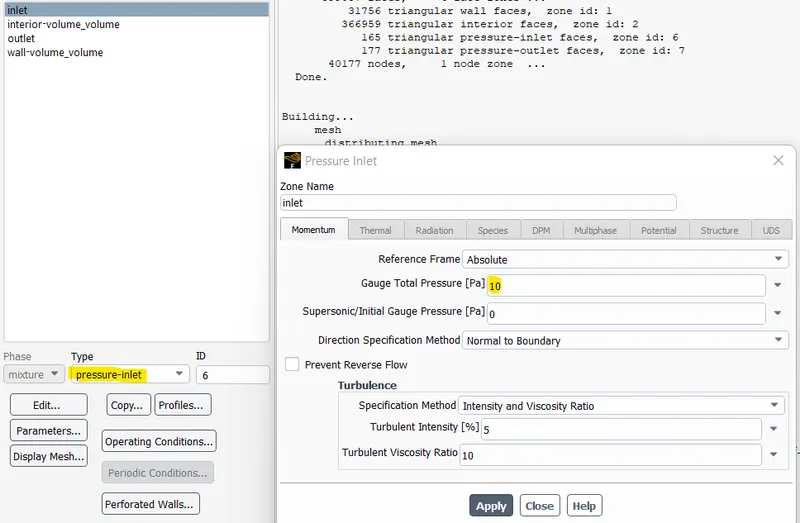
1) Inlet - Pressure type, of value 10 gauge Pa
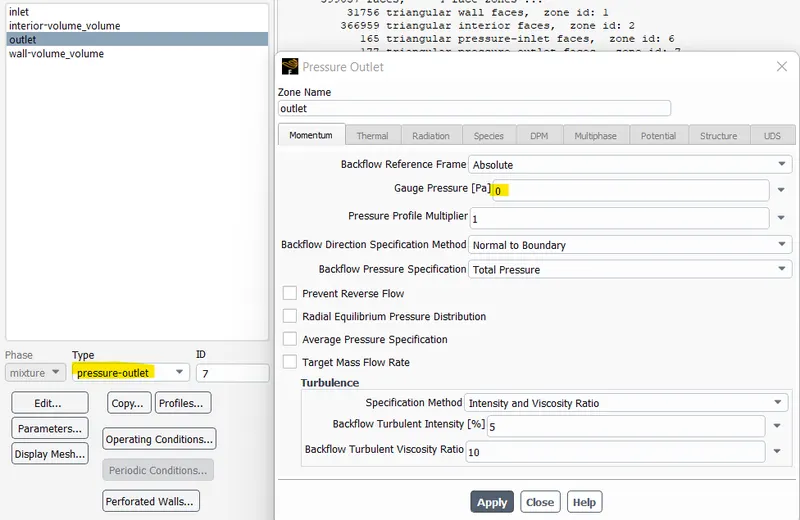
2) Outlet - Pressure type, of value zero gauge Pa
3) Wall - no slip boundaty conditions.
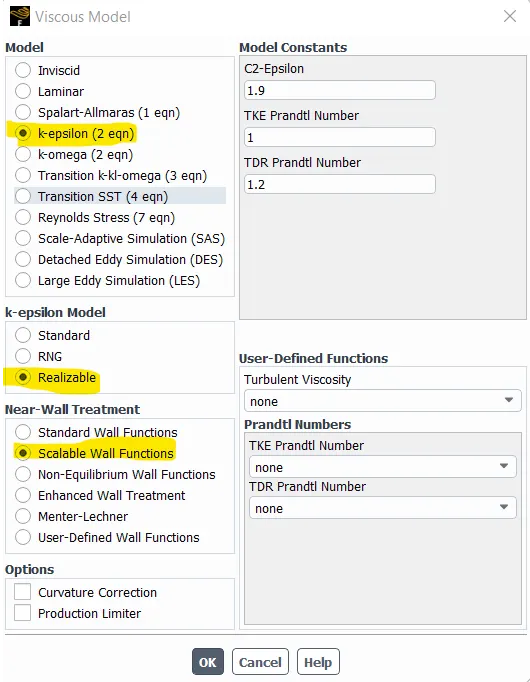
Viscous model - k - epsilon Turbulence model, with realizable and scalable wall functions is used.
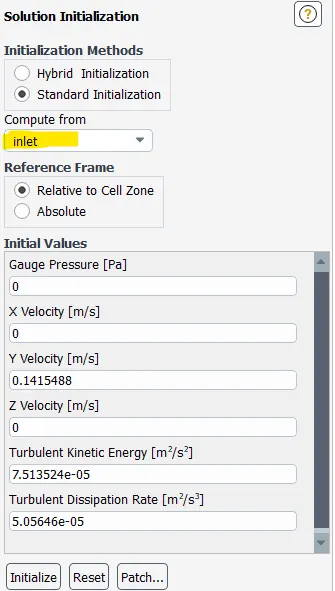
Initialize the model with standard method and compute from inlet.
Report types -
1) Compute pressure at inlet and outlet by area-weighted average
2) Compute mass flow rate at outlet by flux mass flow
In Ansys fluent, new report expressions are generated that are not defined inbuilt functions by Solutions -> Definitions -> New -> Expressions.
3) Compute flow coefficient
4) Compute flow factor
3) Compute pressure drop
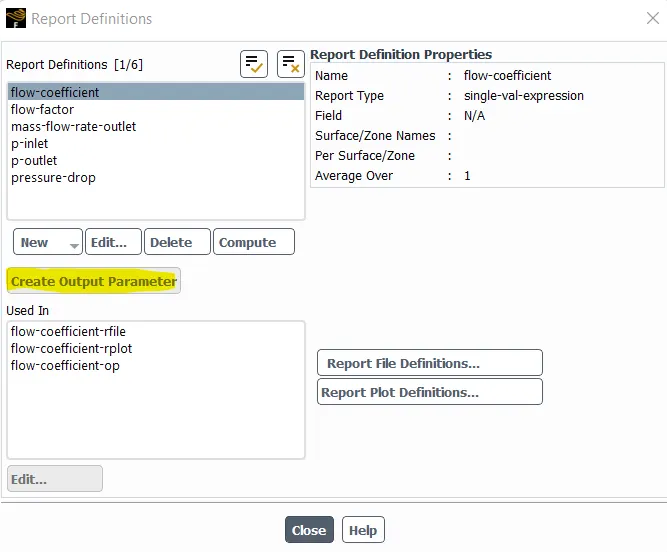
In report definitions, check output parameter such that the quantity is parametrized.
Contour -
Create velocity contour and velocity vector on the yz plane
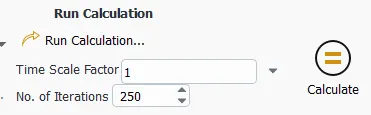
Perform simulation with 250 no.of iterations
Step 4 - Results
The results discussed in this section are for 10% valve opening.
The following fig shows the velocity contour and velocity vector plots of the gate valve.
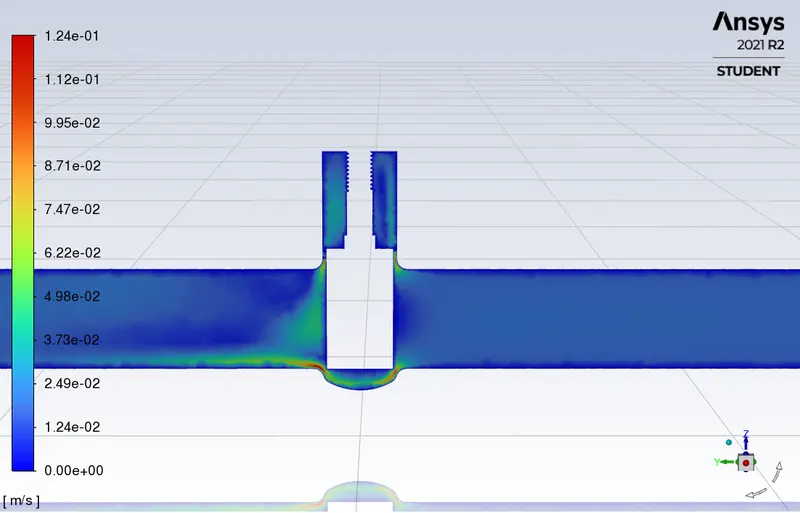
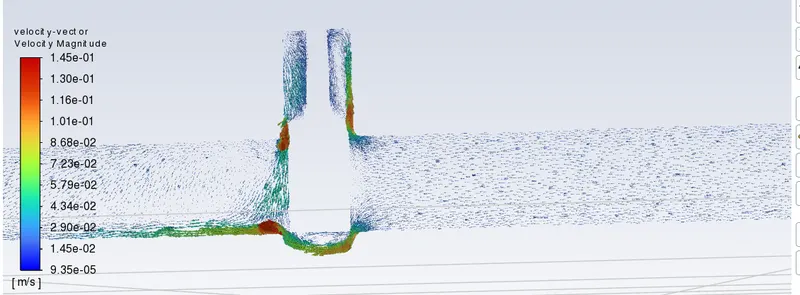
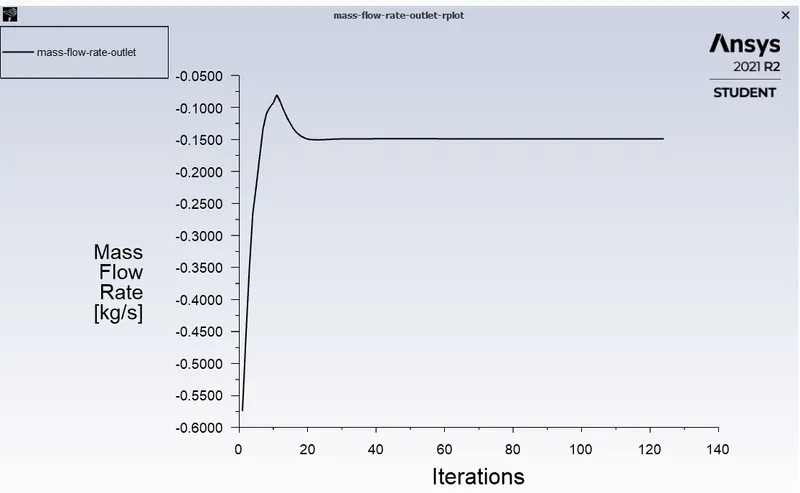
The solution is converged at 125 iterations with a mass flow rate of -0.149m/s. The -ve sign indicates the flux is leaving the control volume.
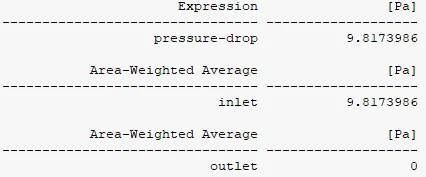
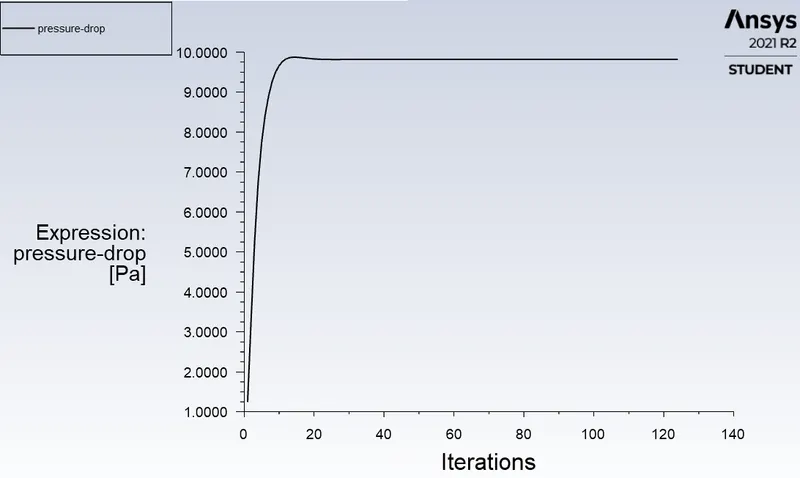
A pressure drop of 9.817 Pa is observed across the inlet and outlet sections of pipe.
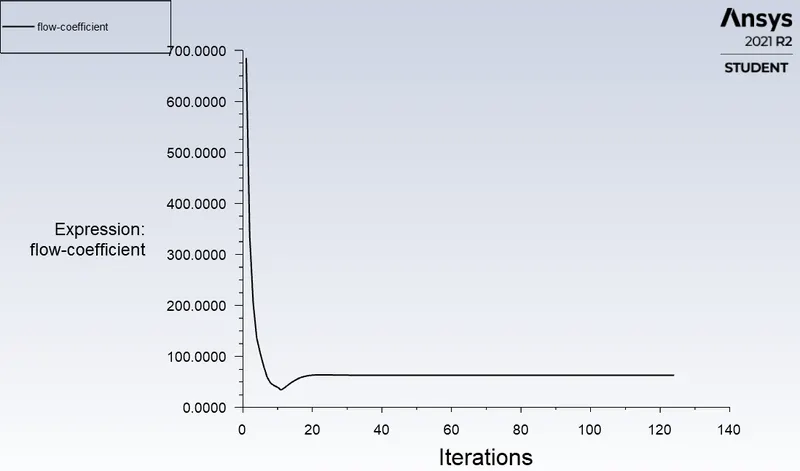
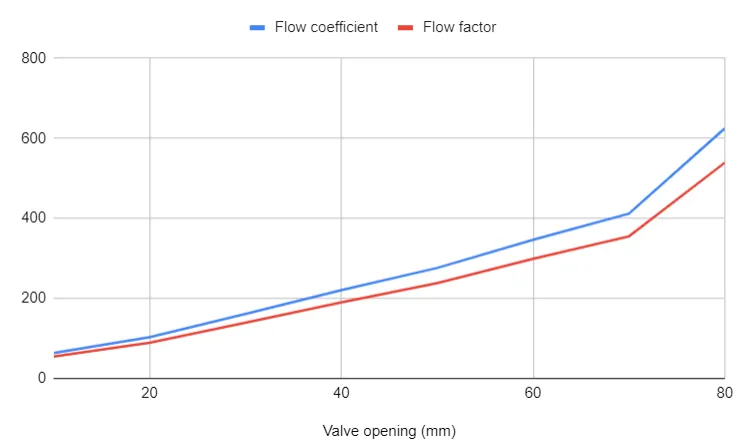
For 10% valve opening, flow coefficient of 63.34 is observed which indicate that at 16 degree celsius temperature, for pressure drop of 1 PSI, 63.34 Gallons per min flow rate occurs in the valve.

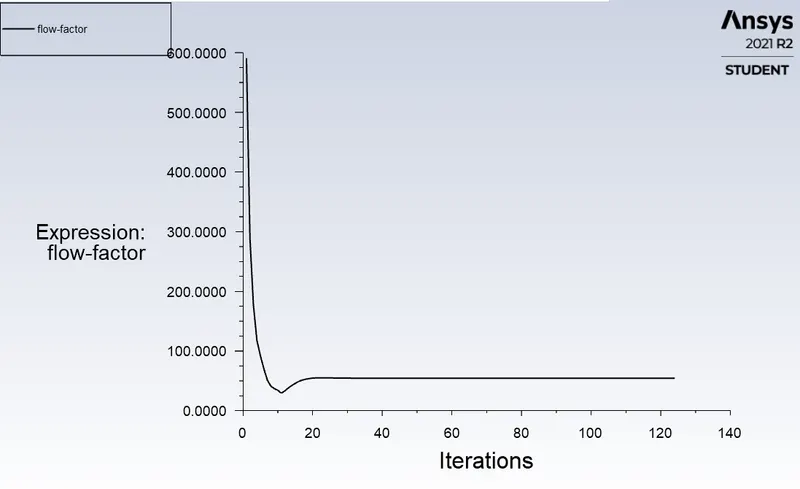
For 10% valve opening, flow factor of 54.605 is observed which indicate that at 16 degree celsius temperature, for pressure drop of 1 bar, 54.605 m3 per hr flow rate occurs in the valve. The flow factor coefficient is generally used in countries where metric system is followed.

SOLUTIONS:
In Ansys fluent, the parametric study is done on different valve opening percentages from 10% to 80%. Since the pipe diameter is 100mm, the valve openings are done from 10mm to 80mm.
The following fig shows the parametric study for different valve opening with output parameters like mass flow rate, flow factor, pressure drop, flow coefficient.
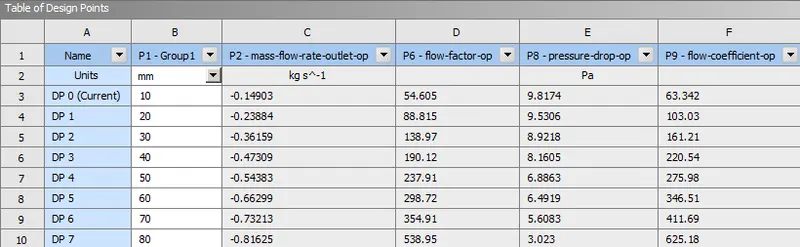
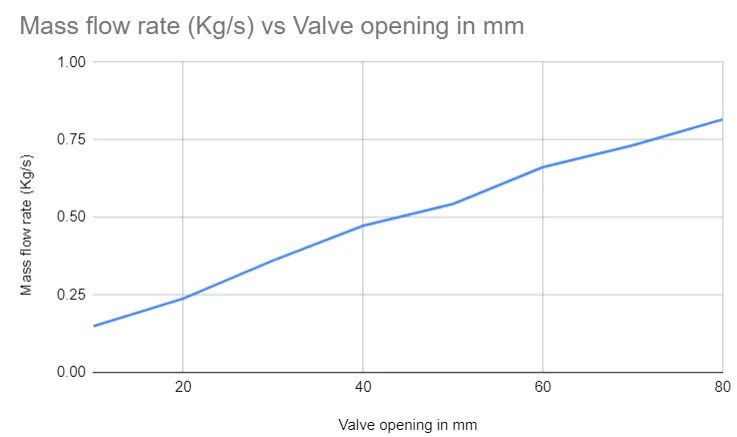
From the above graph, it is observed that as the % valve opening is increased from 10mm to 80mm, the mass flow rate continuously increases. For valve opening of 80mm, a mass flow rate of 0.8162 kg/sec is observed.
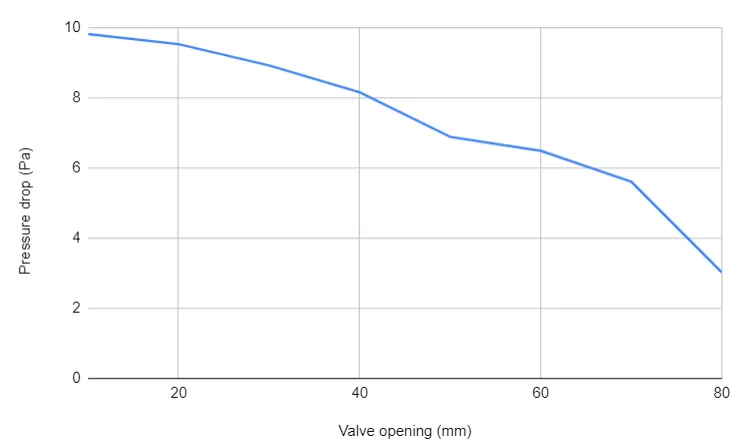
It is observed from the above graphs, as the valve opening height is increased, there is a decrease of pressure drop is achieved. For valve opening b/w 70 to 80mm, there is a steep decrease in pressure drop is achieved. Since, pressure drop indirectly estimates the amount of energy required to drive the flow as it computes the loss coefficients in pipe flow and valve fittings.
Since, flow coefficients estimate the flow efficiency of the valve, it is observed that for valve opening from 70 to 80mm, there is a steep increase in the flow coefficient values.
CONCLUSION:
It is concluded that energy for valve opening b/w 70 to 80 mm, pipe flow losses and valve fitting losses are minimum and maximum flow rate is achieved.
REFERENCES -
[1] Wikipedia
[2] Fester, V. G., et al. "Loss coefficients for flow of Newtonian and non-Newtonian fluids through diaphragm valves." Chemical Engineering Research and Design 85.9 (2007): 1314-1324.
[3] Wu, Hui, Jun-ye Li, and Zhi-xin Gao. "Flow characteristics and stress analysis of a parallel gate valve." Processes 7.11 (2019): 803.