Week 9 - Mini project - Flow over an Airfoil
AIM:
In this project, we are going to calculate the drag and lift coefficients for the NACA 2412 airfoil on 4 four different angles of attack i.e. 10, 50, 100, 150.
Introduction:
Airfoil is the cross section of a wing, propeller, rotor, or turbine, or sail as shown in cross-section. An air-like body moving through a fluid produces aerodynamic forces.
The component of this force perpendicular to the direction of motion is called lift. A component parallel to the direction of motion is called drag. Lift in the air is mainly the result of the angle of attack and shape. When deployed at the right angle, the airbag cools the air in front of it, causing force in the airfield as opposed to escaping. This force is known as aerodynamic force and can be resolved into two components: lift and drag. Airbag design is a key aspect of aerodynamics. Different airbags serve different flight modes.
The attack wind angle is the angle between the apparent or relative wind direction and the chord line of the wind field. At very low angles of attack, the airflow over the airfoil is essentially smooth and laminar, with little turbulence at the trailing edge of the airfoil. The point where laminar flow stops and turbulence begins is called the separation point. Increasing the angle of attack increases the area where the airbag turns directly into the wind. This increases lift, but shifts the laminar air flow separation point towards the front of the airfoil, and the resulting increase in turbulent flow through the airfoil leads to increased drag.
Maximum lift usually occurs when the angle of attack is about 15 degrees, but this can be higher for specially designed-airbags.
Above 15 degrees, the separation point moves towards the upper edge of the airfoil and the laminar flow over the airfoil is eliminated. Increased turbulence causes rapid deterioration of lift, while significantly increasing drag and stalling.
Airfoil:
Airfoil is the cross-sectional shape of a wing, blade of a propeller, rotor, or turbine, or sail as seen in cross-section. An airfoil-shaped body moving through a fluid produces an aerodynamic force.
The component of this force perpendicular to the direction of motion is called the lift. The component parallel to the direction of motion is called drag. The lift on an airfoil is primarily the result of its angle of attack and shape. When oriented at a suitable angle, the airfoil deflects the oncoming air, resulting in a force on the airfoil in opposite deflection. This force is known as aerodynamic force and can be resolved into two components: lift and drag. Airfoil design is a major facet of aerodynamics. Various airfoils serve different flight regimes.
The angle of attack of an airfoil is the angle between the direction of the apparent or relative wind and the chord line of the airfoil. At very low angles of attack, the airflow over the airfoil is essentially smooth and laminar with perhaps a small amount of turbulence occurring at the trailing edge of the airfoil. The point at which laminar flow ceases and turbulence begins is known as the separation point. Increasing the angle of attack increases the area of the airfoil facing directly into the wind. This increases the lift but also moves the separation point of laminar flow of the air above the airfoil part way up towards the leading edge. The result of the increased turbulent flow above the airfoil is an increase in the drag.
Maximum lift typically occurs when the angle of attack is around 15 degrees but this could be higher for specially designed airfoils.
Above 15 degrees, the separation point moves right up to the airfoil's leading edge and the laminar flow above the airfoil is destroyed. The increased turbulence causes the rapid deterioration of the lift force while at the same time it dramatically increases the drag, resulting in a stall.
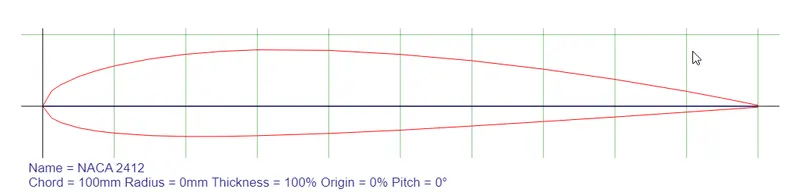
The vertices for NACA 2412 were taken from an airfoil tools website: NACA 2412 :
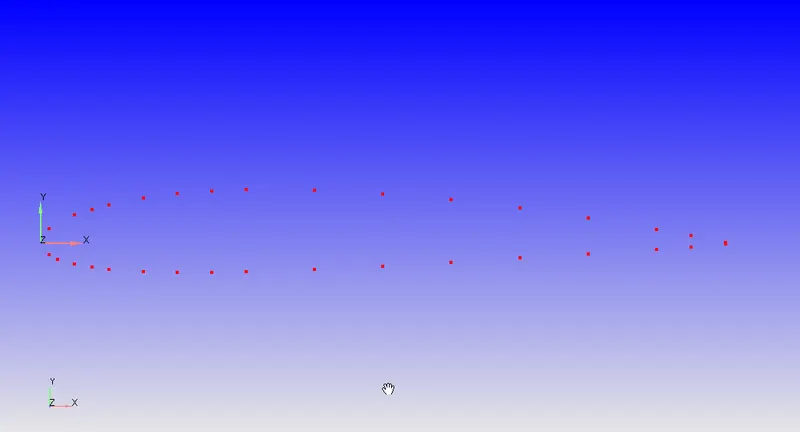
The above vertices were manually plotted in converge as shown below:
The profile for a Wind Tunnel measuring 2.4m x 1.25m was generated by plotting and patching its vertices with the help of Converge's patch tool.
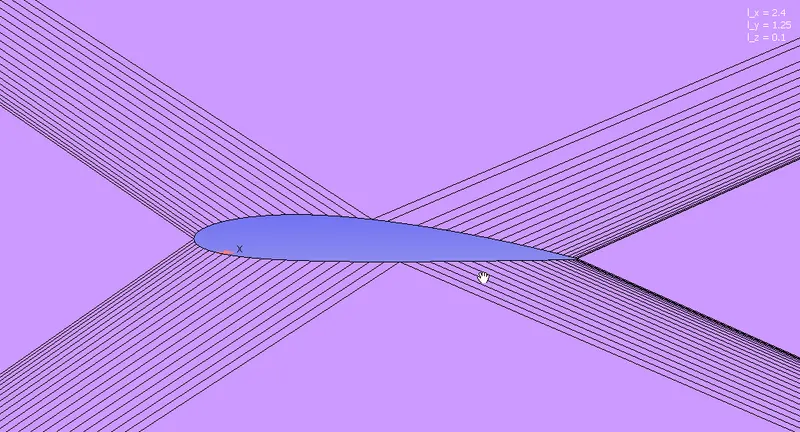
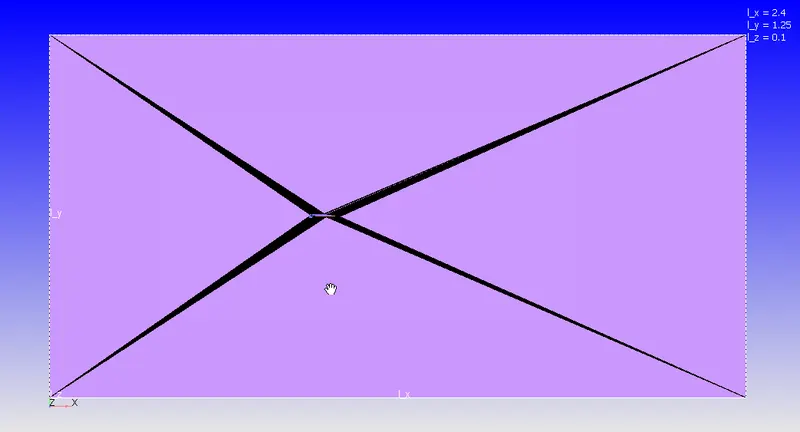
Once the profile has been obtained, it is replicated along the z-axis.
BOUNDARY FLAGGING:
The Boundaries are flagged as below:
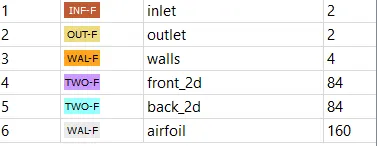
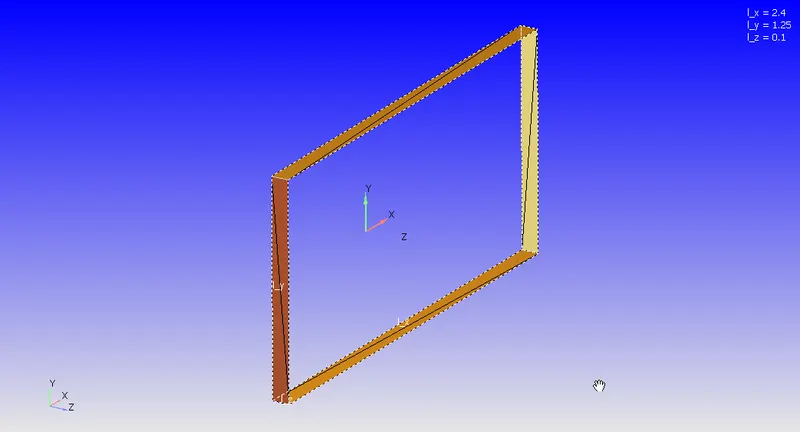
Inlet, Outlet & Walls:
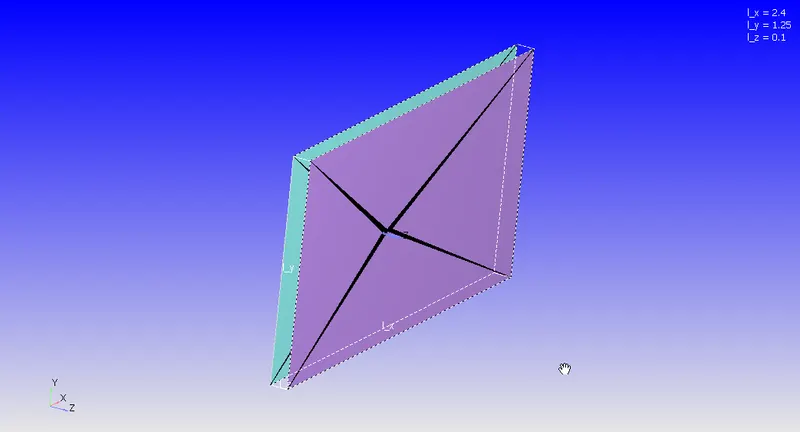
Front & Back 2D Boundaries:
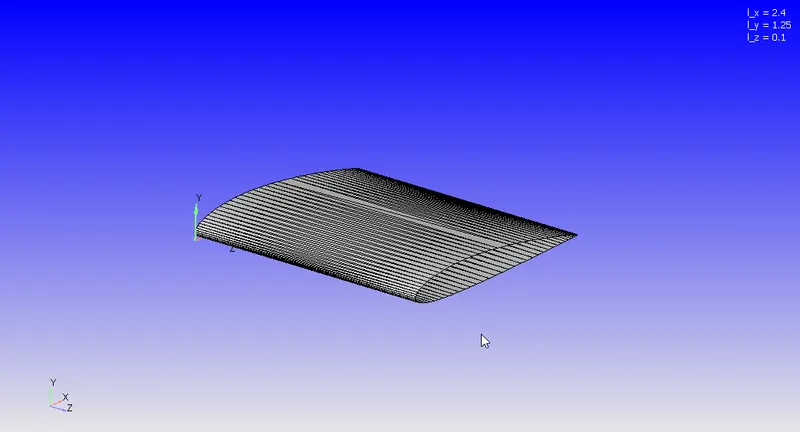
Airfoil:
CASE SETUP:
Initial Conditions:
- Air at 298K
- 1 atm Pressure at 31.42 m/s
Boundary Conditions:
- Inlet: At a Reynolds Number of 200000, a temperature of 298K and a pressure of 1 atm, the velocity of air is calculated to be 31.42 m/s.
- Outlet: Pressure outlet at 1 atm.
- Walls: In order to avoid any interference with the flow, slip walls were set up for the walls.
- Airfoil: Airfoil is set to the law of the wall with default parameters.
Simulation Parameters:
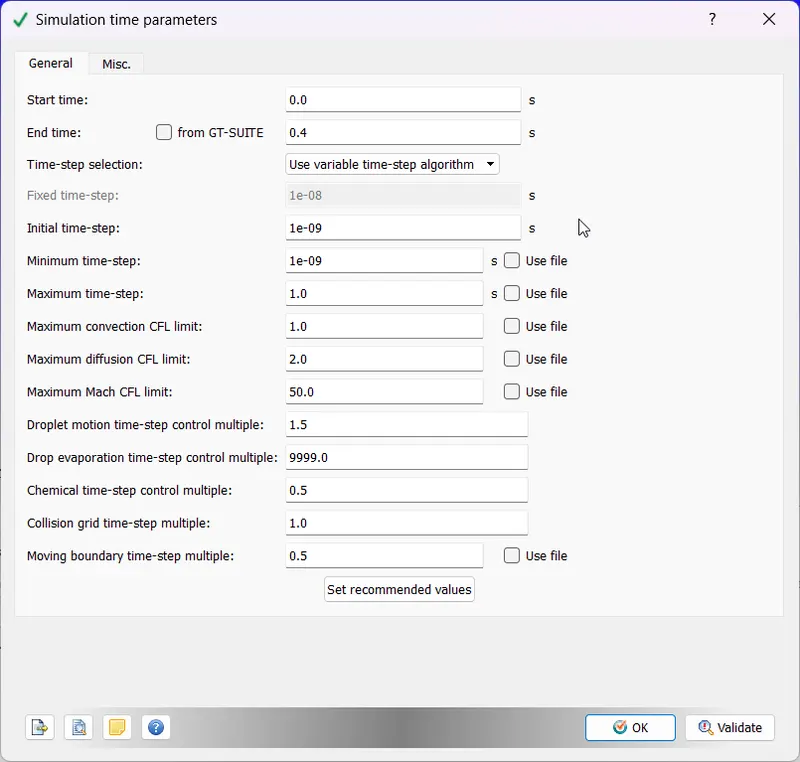
- Transient simulation
- Inlet Velocity: 31.42 m/s
- Length of Wind Tunnel: 2.4 m
- Flow Throw Time: 2.4/31.42 = 0.076 s
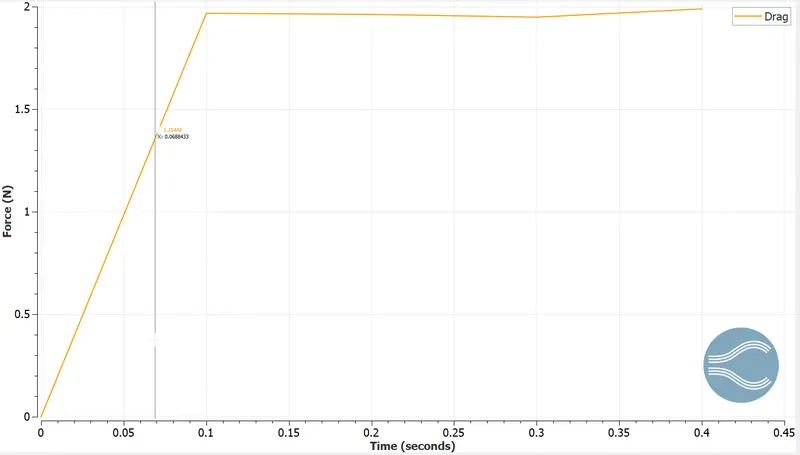
In order to ensure an accurate simulation of the physics, it is a common practice to set the end time of the simulation to 5-6 times the flow throw time. Therefore, an approximate end time of 0.4 seconds was chosen.
Solver Parameters:
We are using a Transient-Density-Based Solver. We shall test each angle of attack with RNG K-Epsilon and K-Omega SST Models with default values.
Mesh:
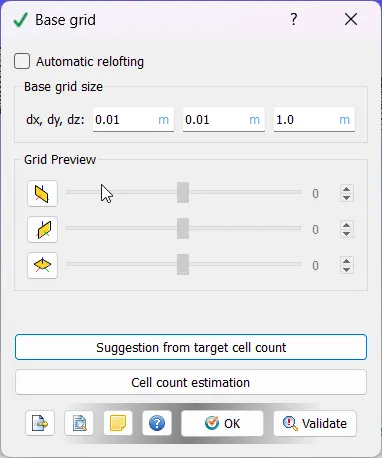
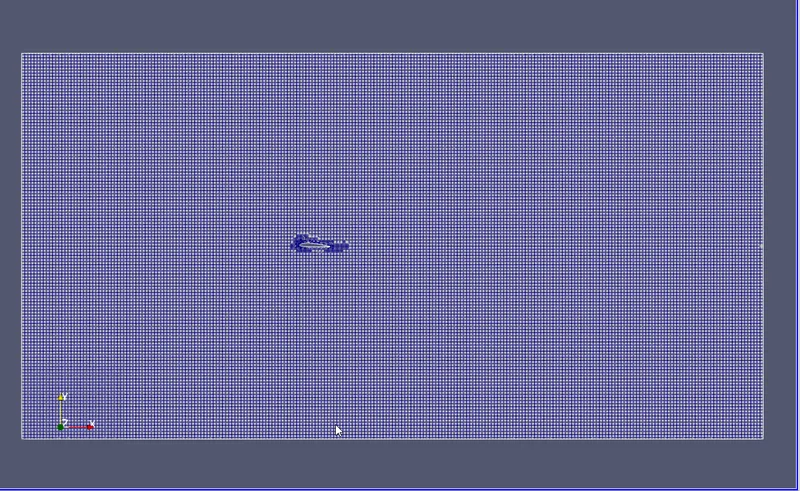
A Coarser Mesh is used here:
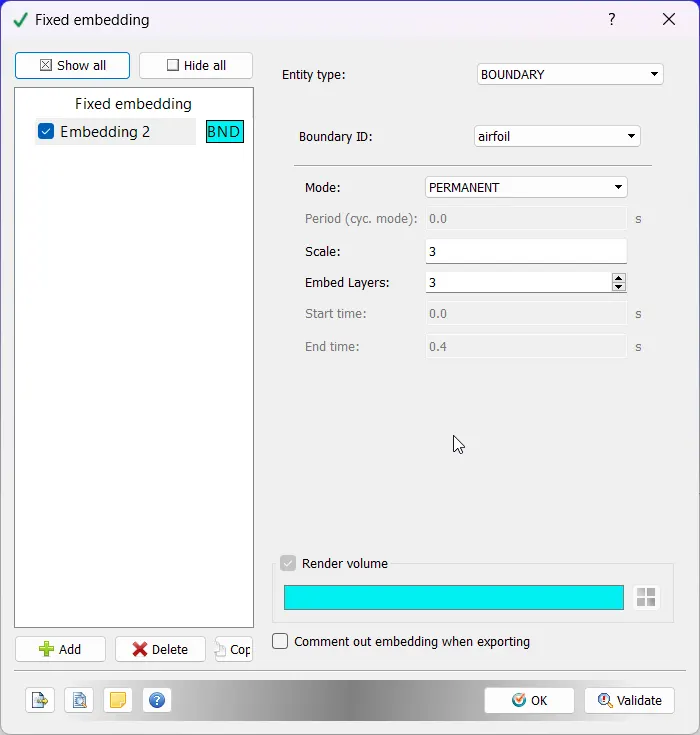
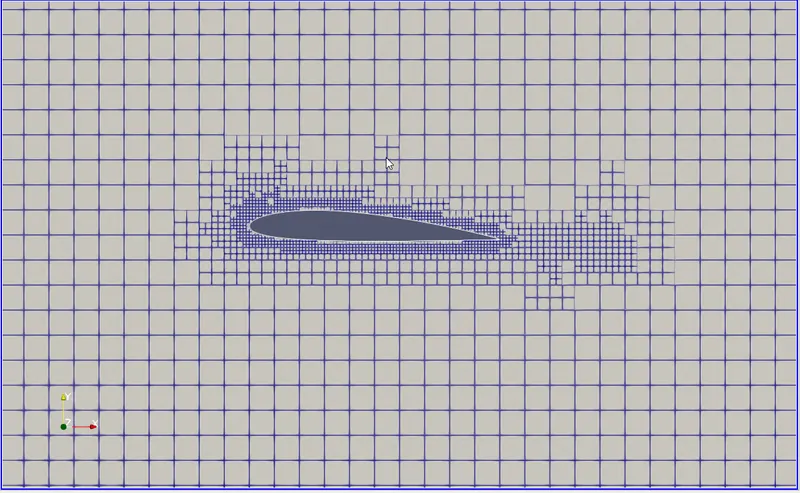
Next, Fixed Embedded Mesh is used around the Airfoil to resolve the aerodynamic effects much better.
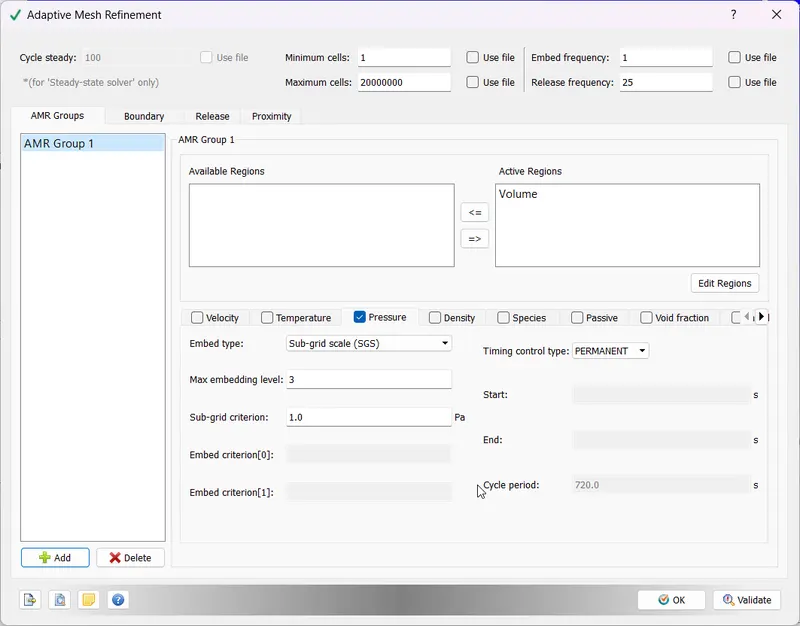
Lastly, we shall use Pressure based AMR to capture adverse pressure gradients:
Output Parameters:
In order to obtain a clear output of the drag and lift forces on the airfoil and capture its boundary details, the "Boundaries only" option is used.
RESULTS:
MESH:
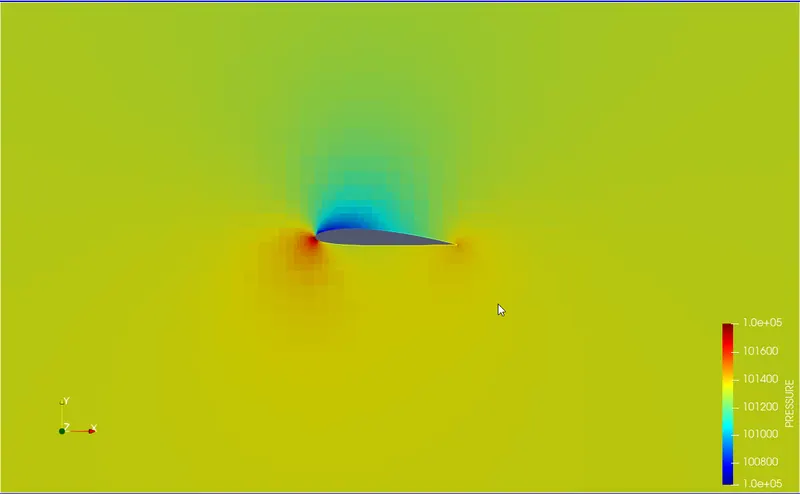
ANGLE OF ATTACK: 10
- K-Epsilon Model:
Pressure Contour:
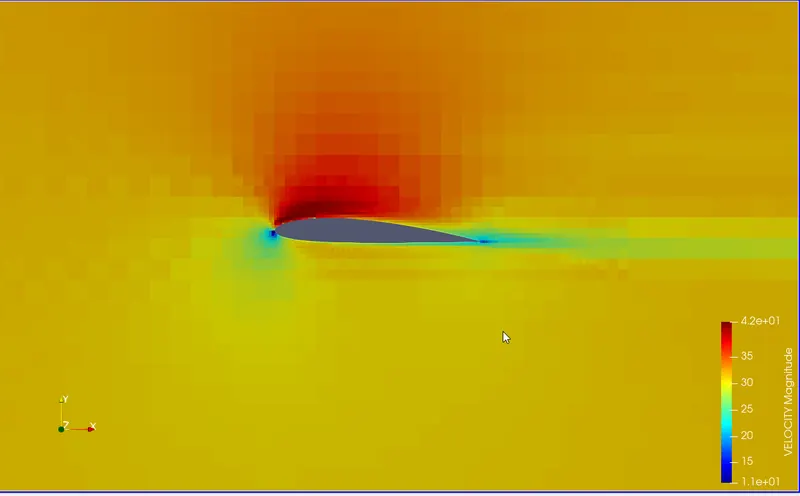
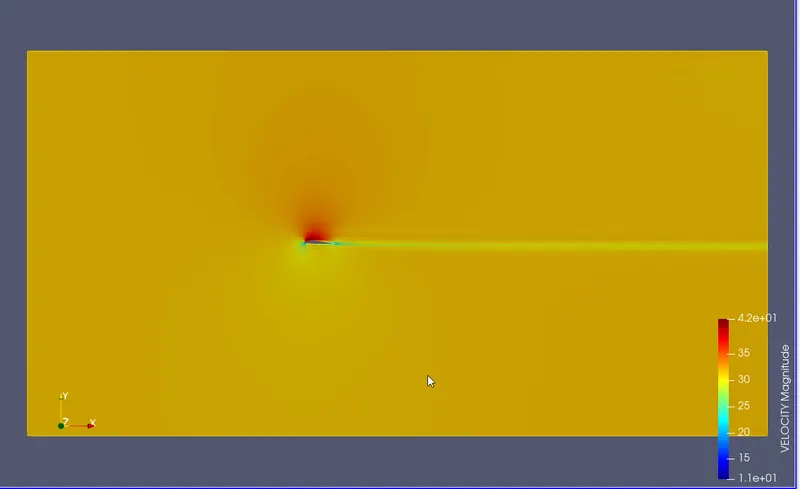
Velocity Contour:
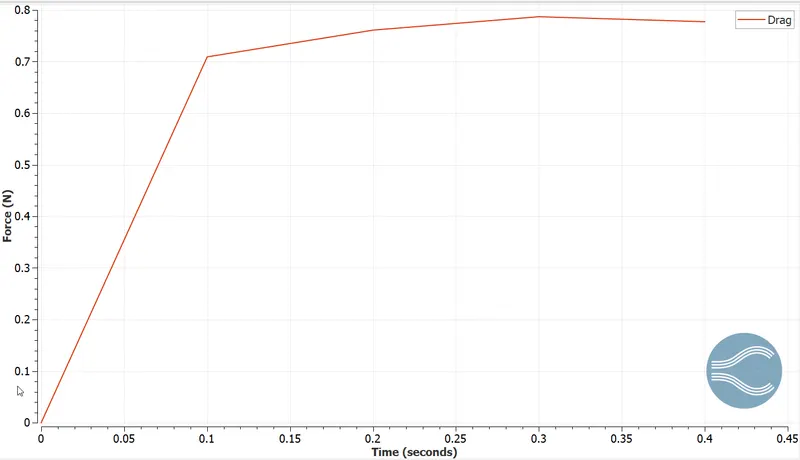
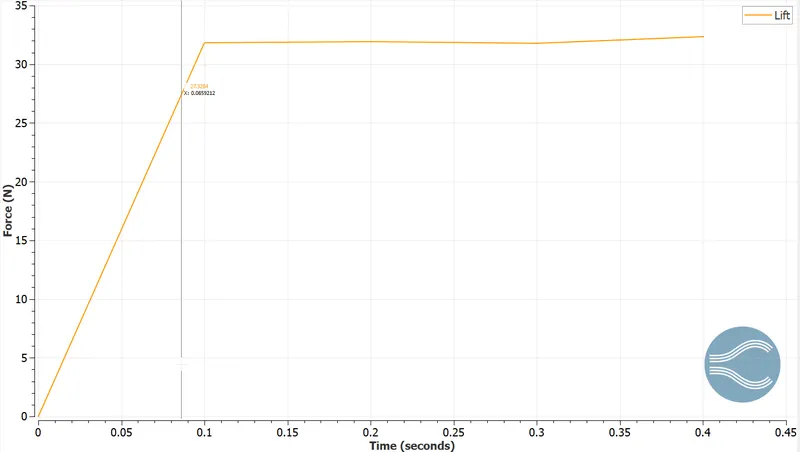
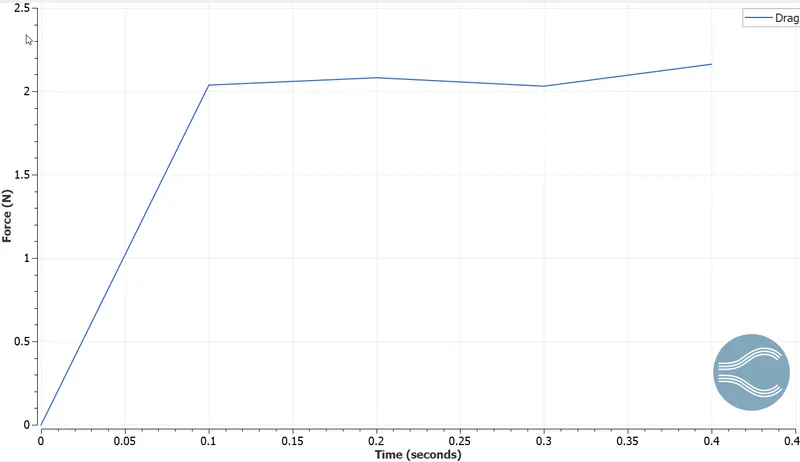
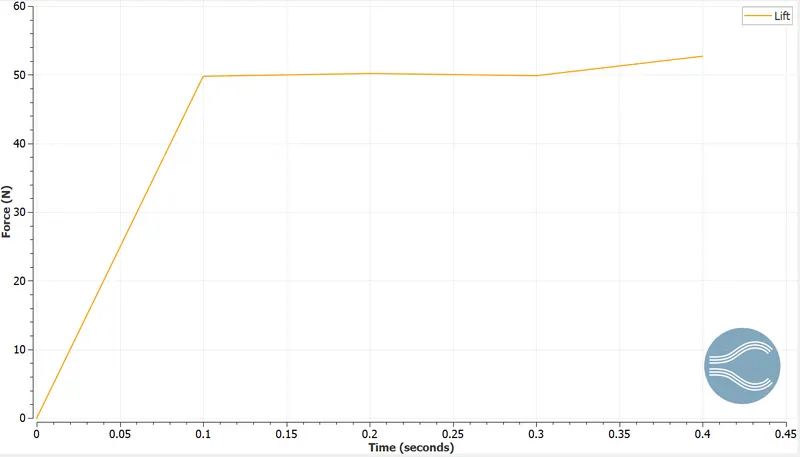
Drag and Lift:
- K-Omega Model:
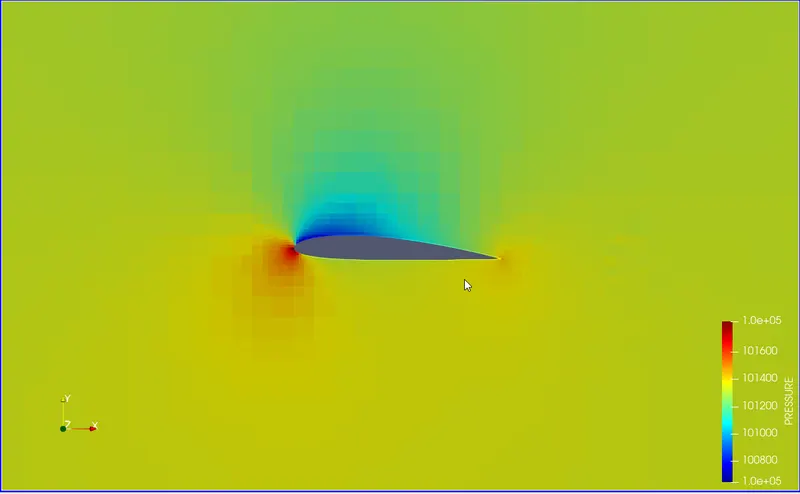
Pressure Contour:
Velocity Contour:
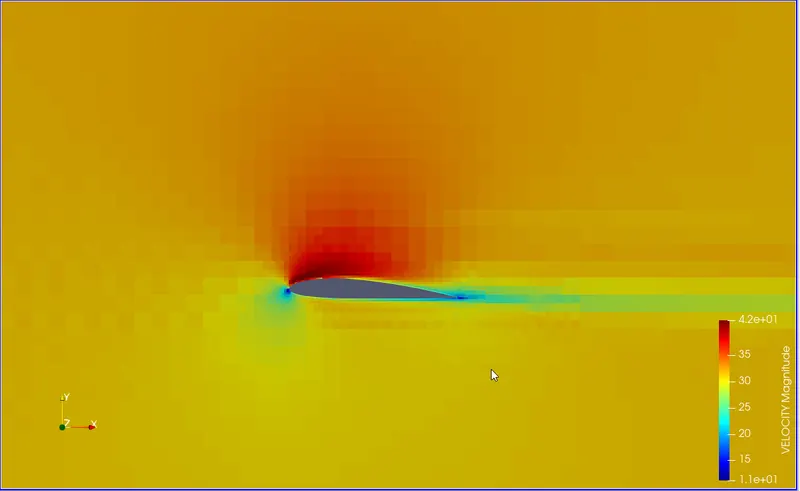
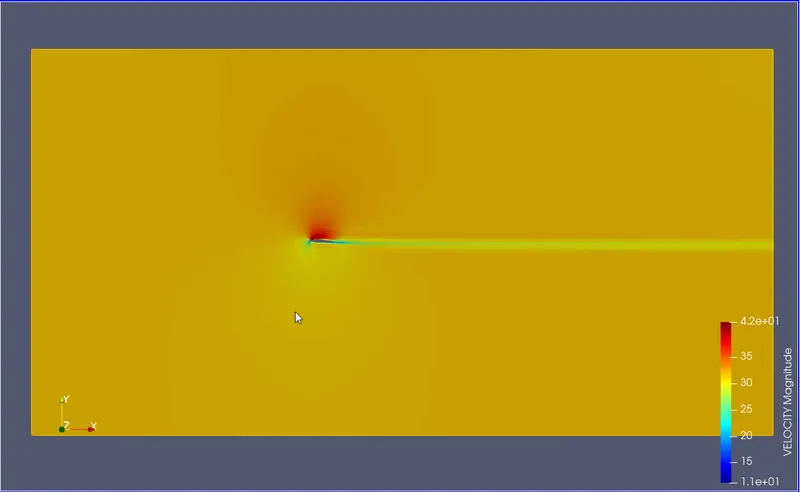
DRAG AND LIFT:
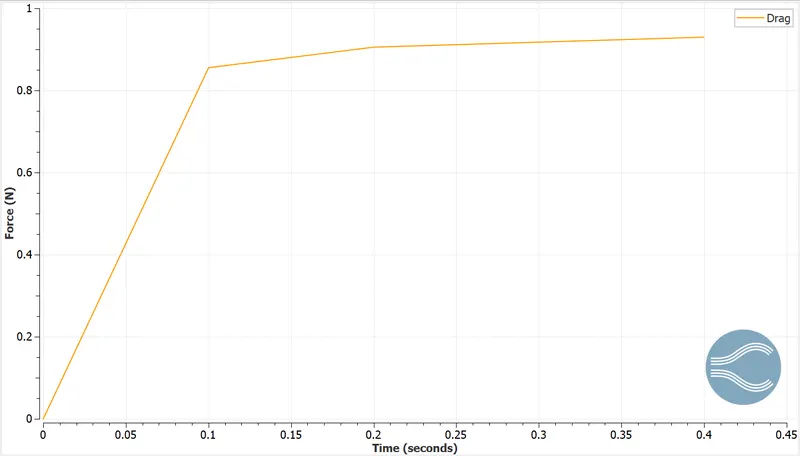
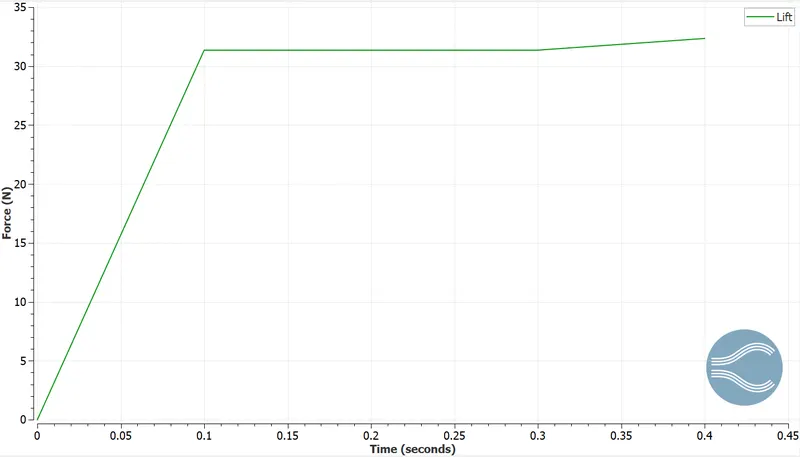
ANGLE OF ATTACK = 50
- K-Epsilon Model:
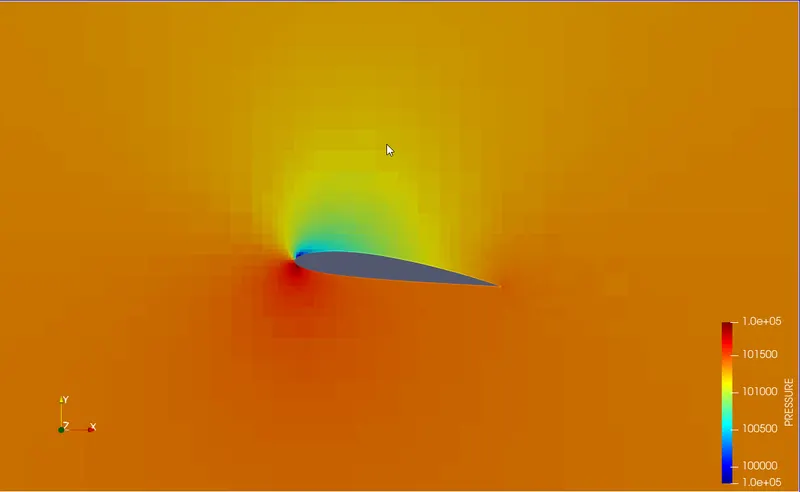
Pressure Contour:
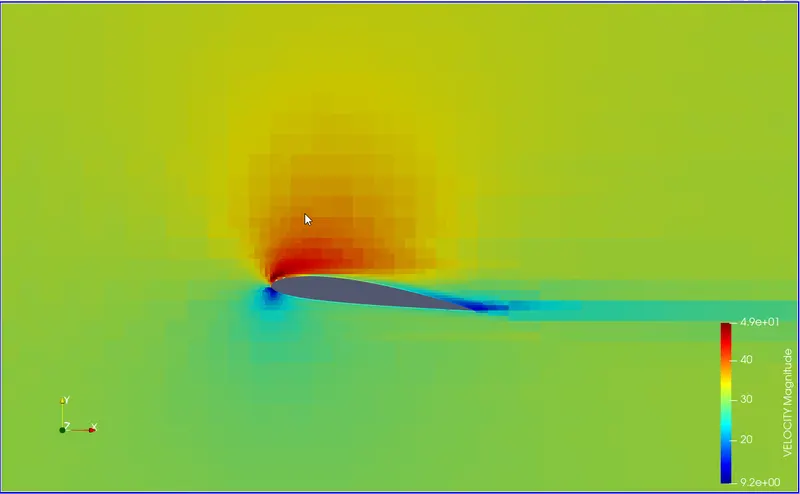
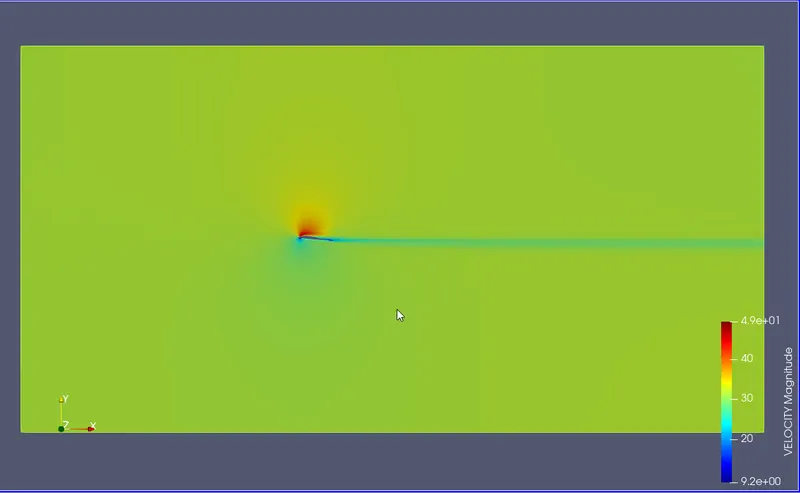
Velocity Contour:
Drag and Lift:
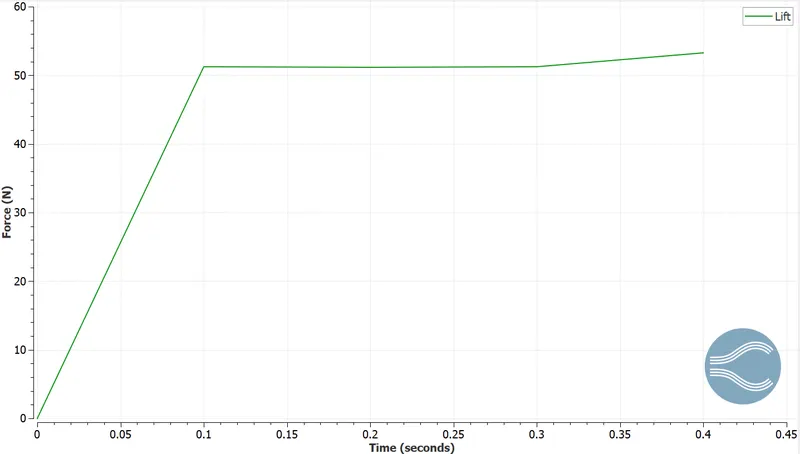
- K-Omega Model:
Pressure Contour:
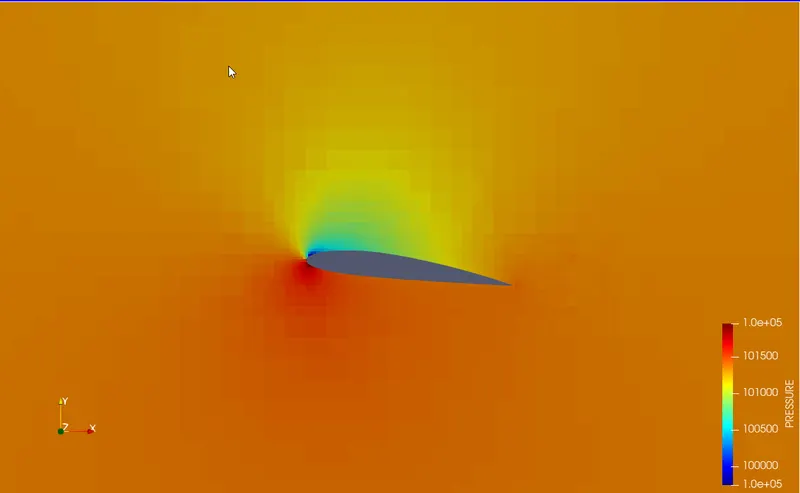
Velocity Contour:
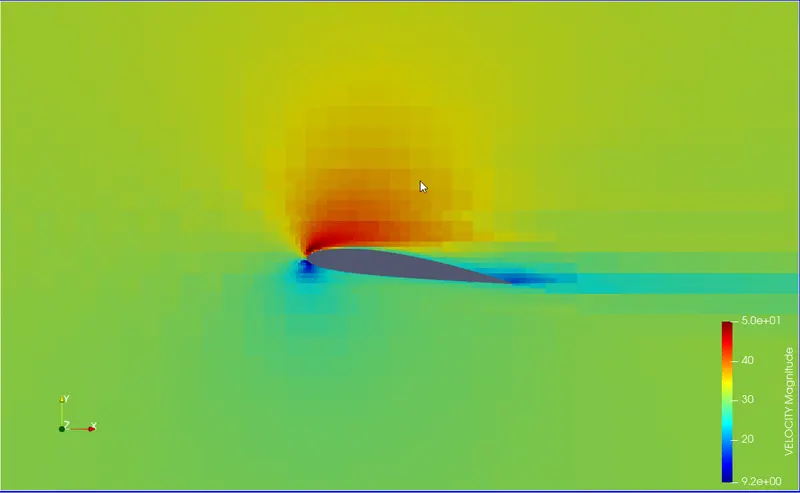
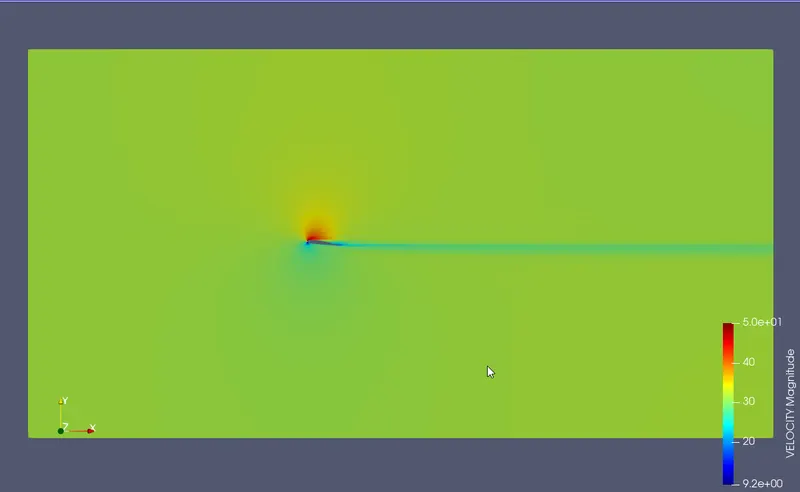
Drag and Lift:
ANGLE OF ATTACK = 100
K-Epsilon Model:
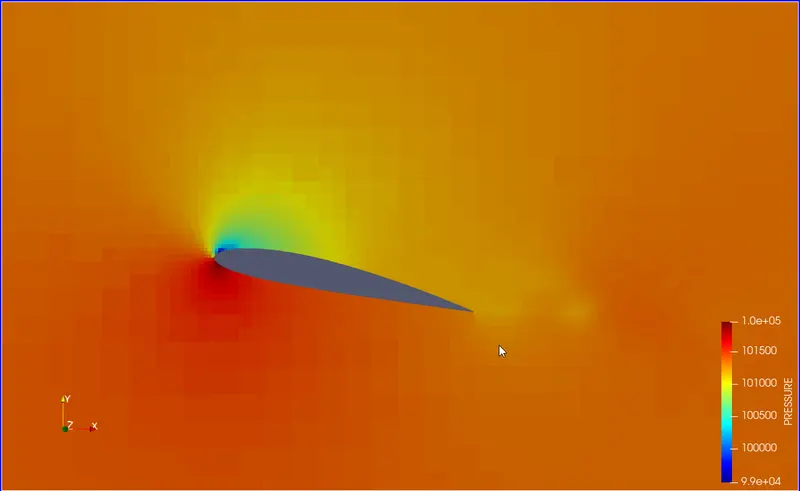
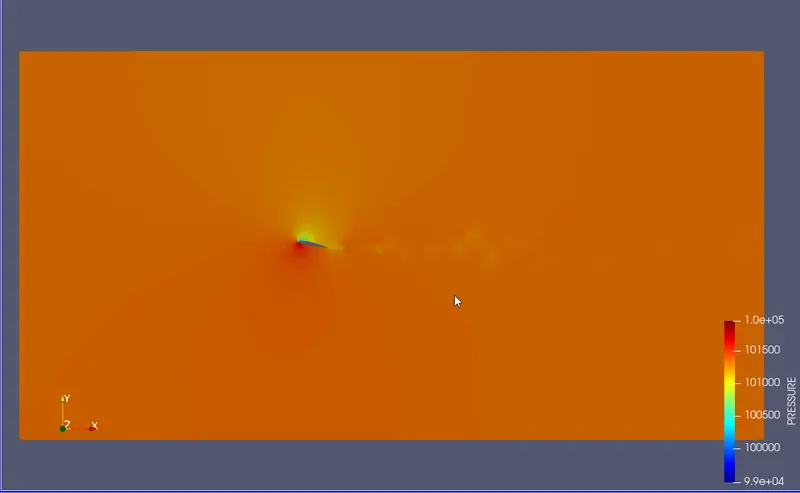
Pressure Contour:
Velocity Contour:
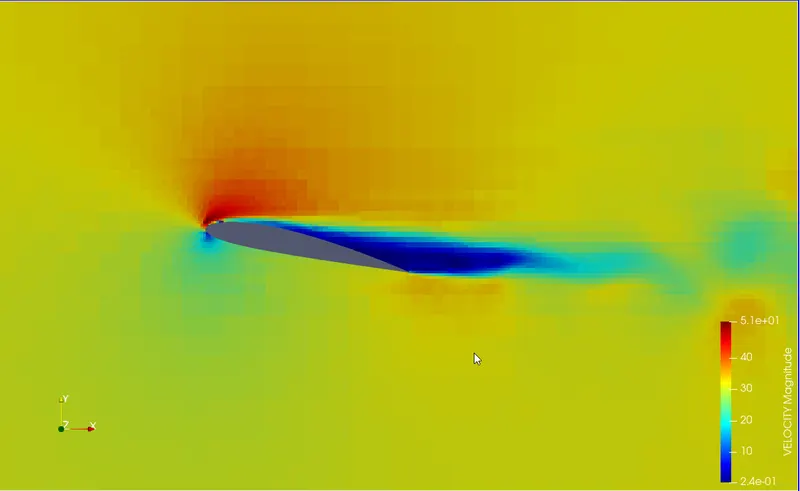
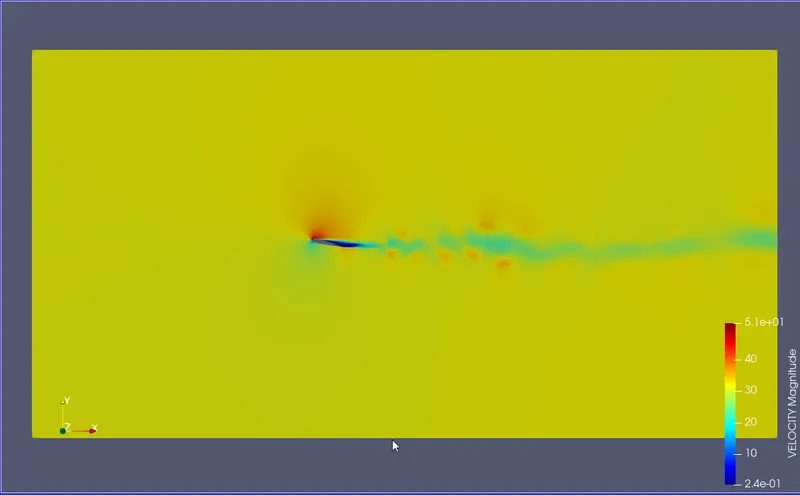
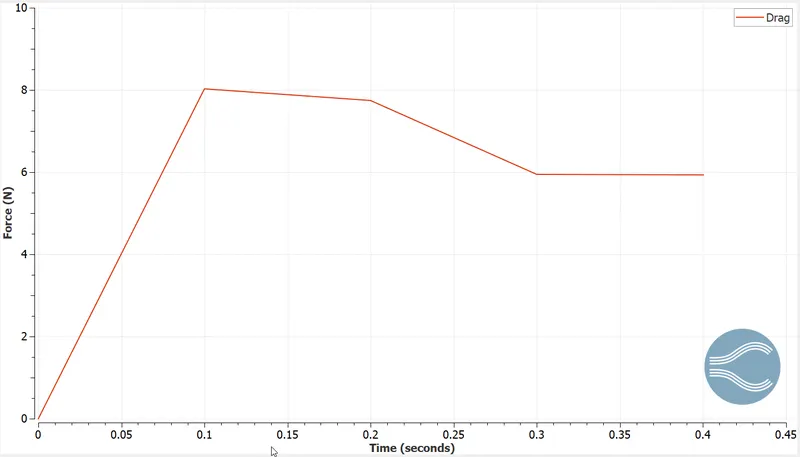
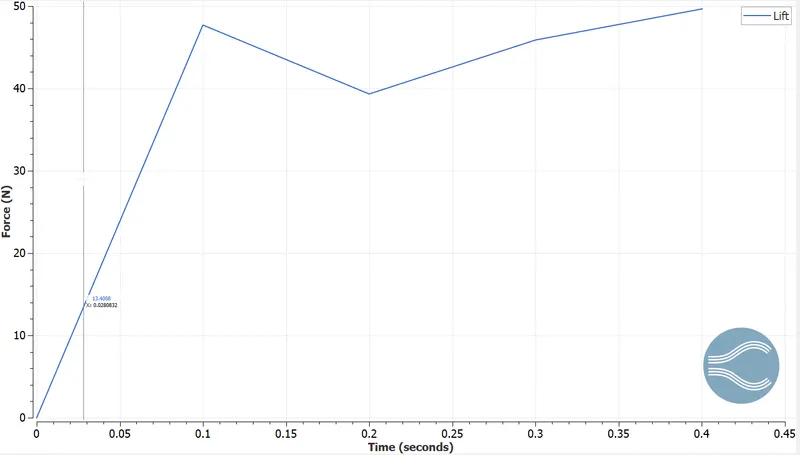
Drag and Lift:
K-Omega Model:
Pressure Contour:
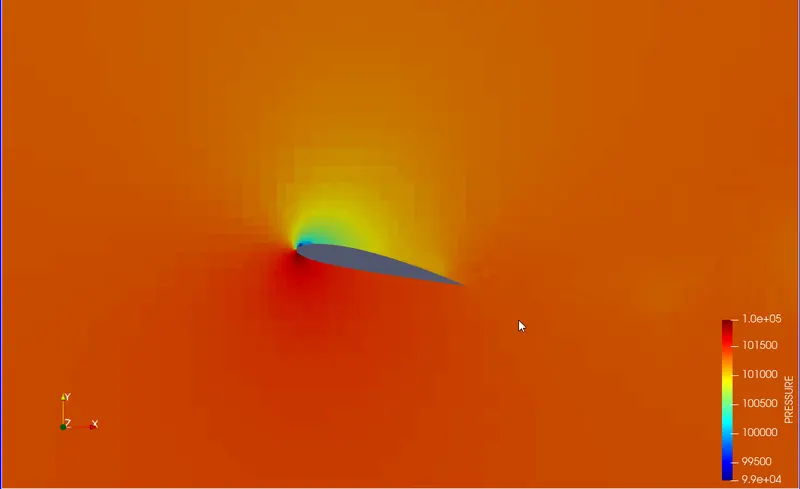
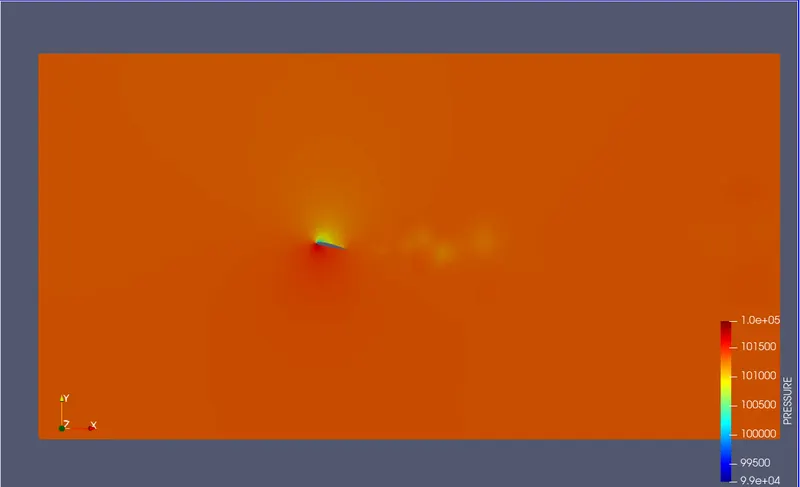
Velocity Contour:
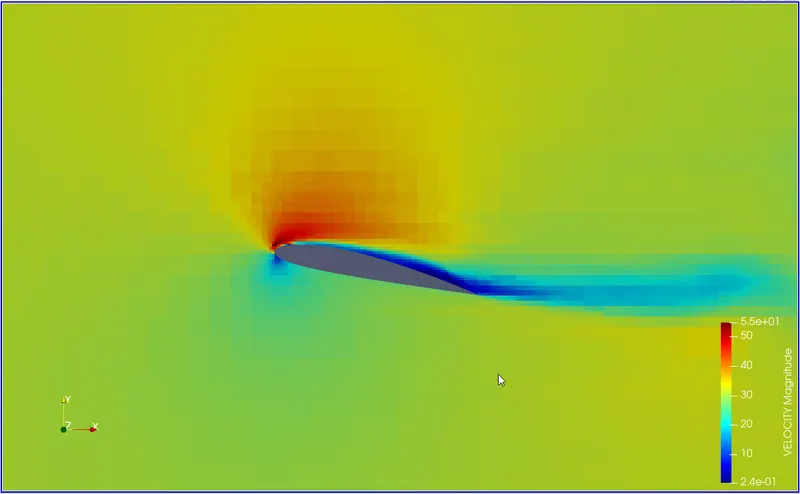
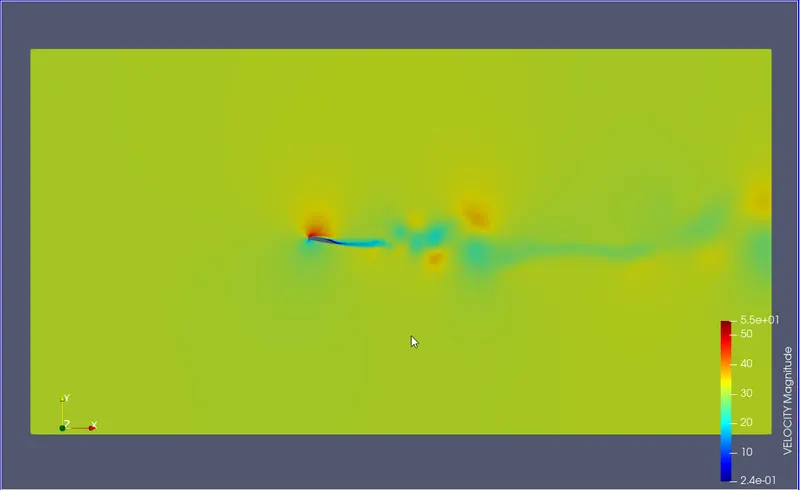
Drag and Lift:
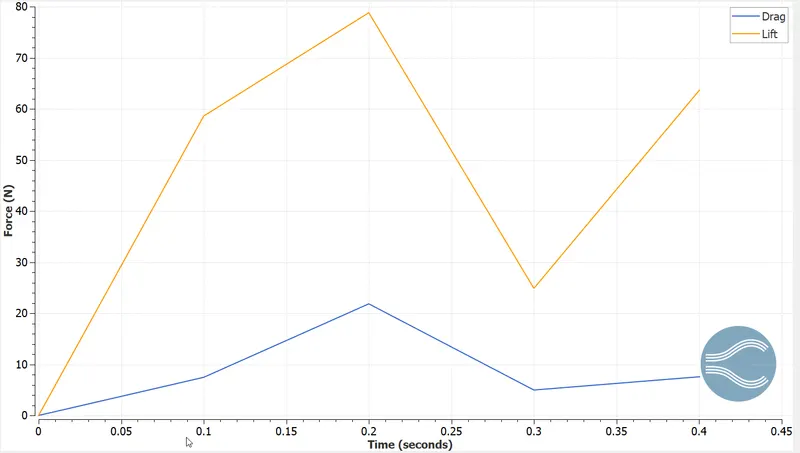
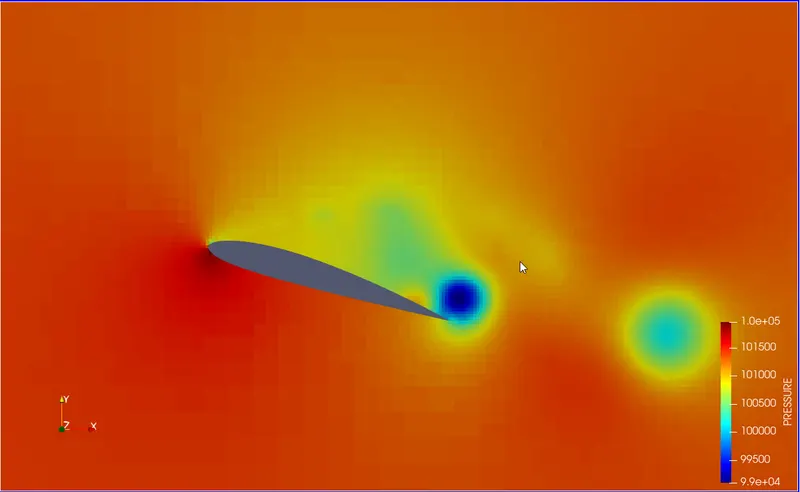
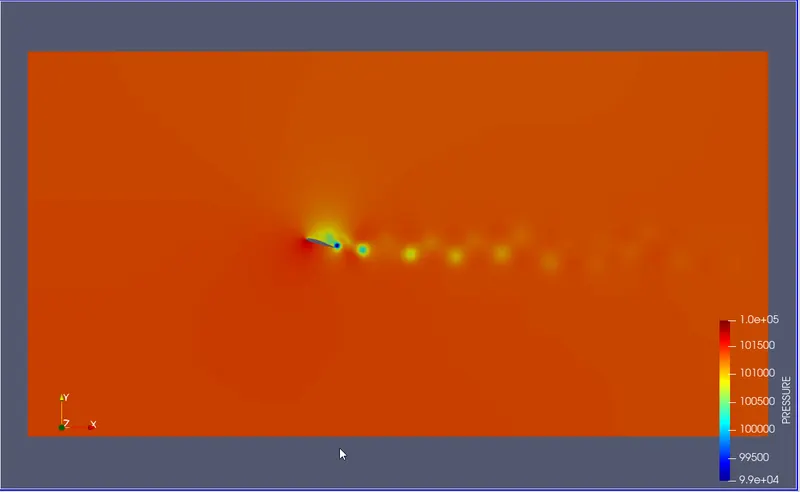
ANGLE OF ATTACK: 150
- K-Epsilon Model:
Pressure Contour:
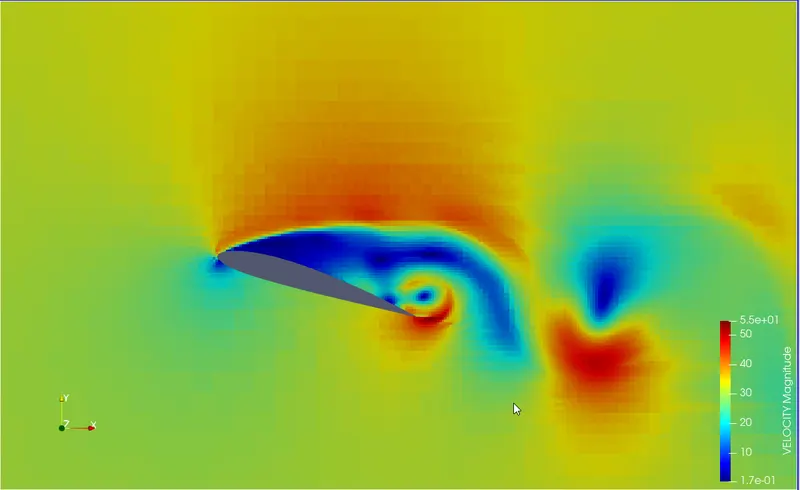
Velocity Contour:
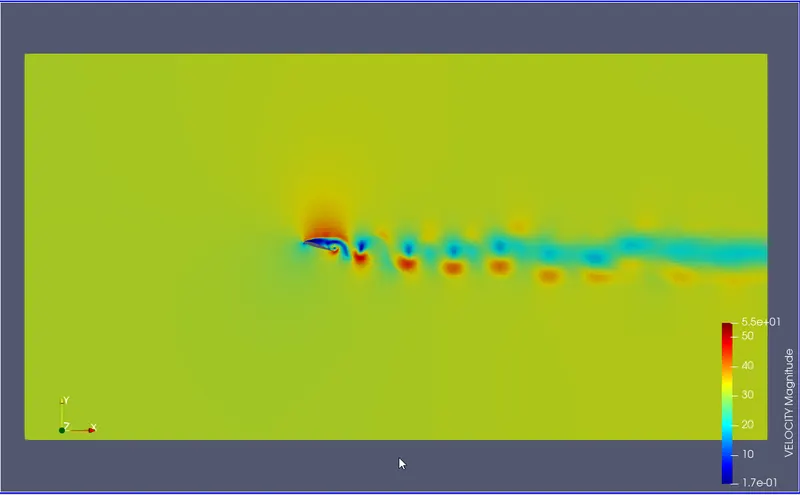
Drag and Lift:
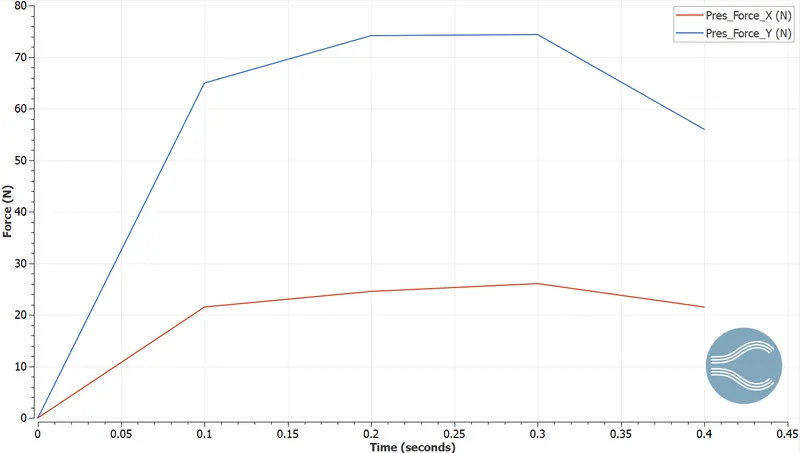
- K-Omega Model:
Pressure Contour:
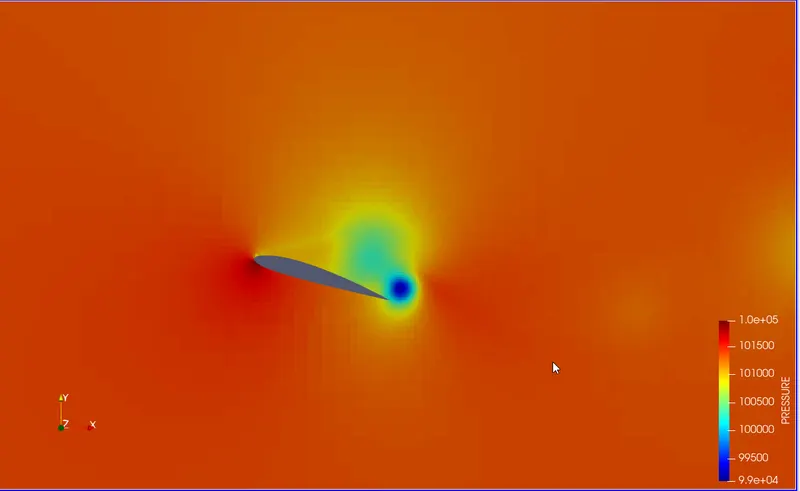
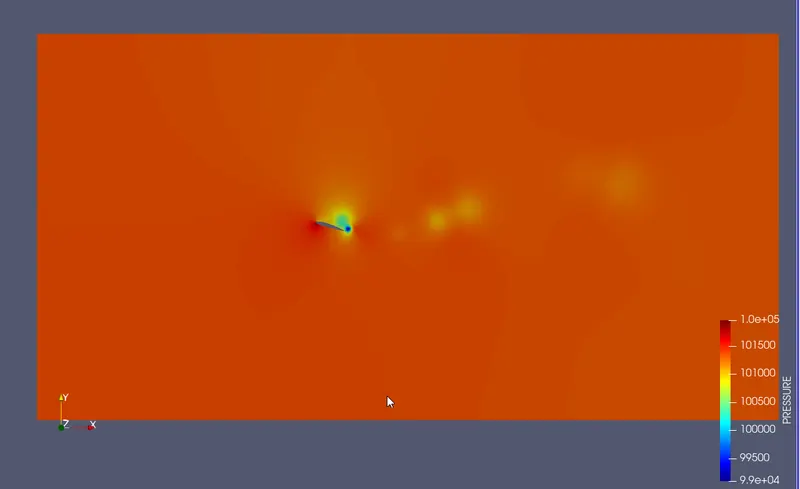
Velocity Contour:
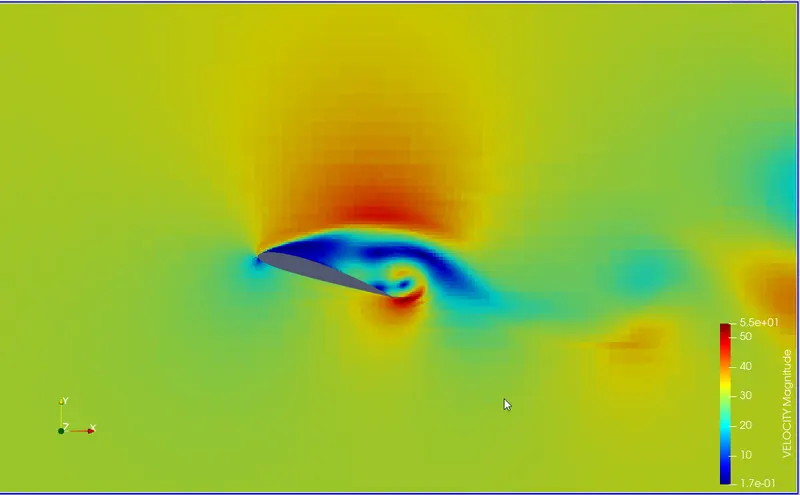
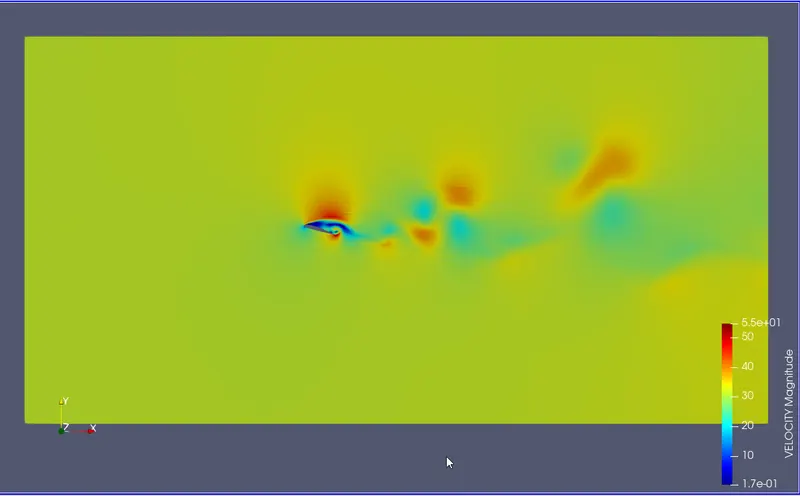
Drag and Lift:
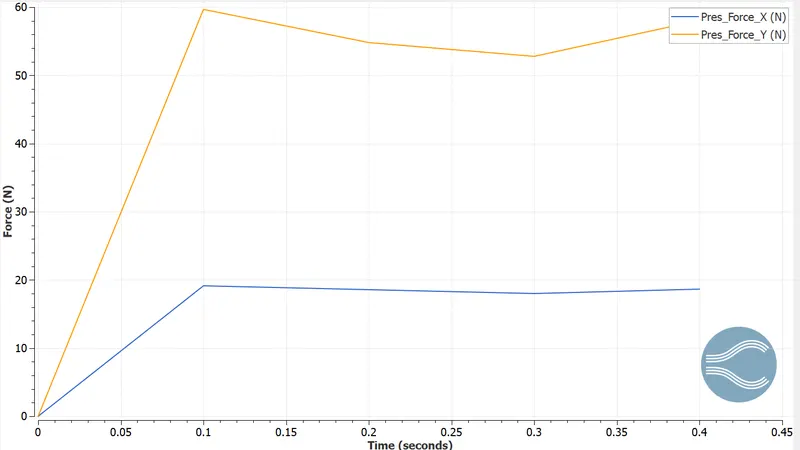
Lift Coefficient and Drag Coefficients:
To calculate the coefficients:
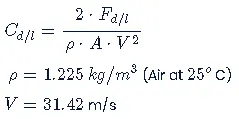
Since, its a 2D simulation, area is considered as Unity
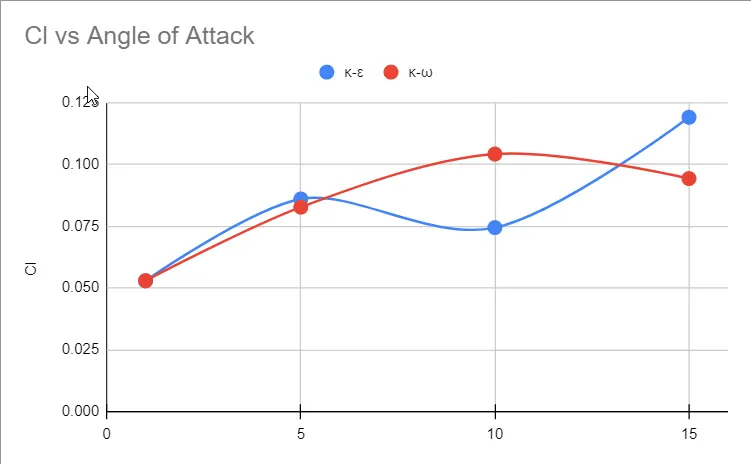
Lift Coefficient vs Angle of Attack:
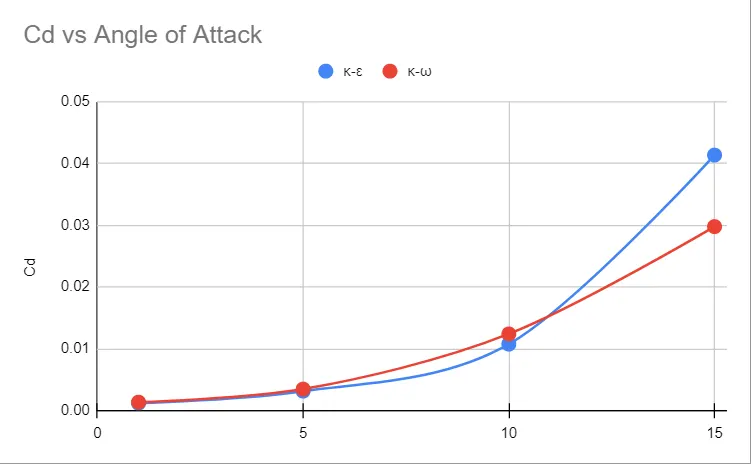
Drag Coefficient vs Angle of Attack:
INFERENCES:
- As the angle of attack increases, the turbulence in the flow increases, leading to the formation of vortices and eddies.
- This results in a gradual increase in lift until a peak is reached at 100, beyond which it decreases due to the formation of vortex structures.
- Meanwhile, the drag also increases with the angle of attack due to the increase in frontal area.
CONCLUSIONS:
- According to Rodgers, Seetharam, and Wentz Jr. (1982), the K-omega SST model provides more accurate results that are consistent with experimental data.
- This is primarily due to the superior performance of the k-omega model in near-wall flows, which has been confirmed by various studies.