Week - 9 Material Modeling from Raw Data
Week - 9 Material Modeling from Raw Data
Aim: Using the given true stress-strain curve of graphite iron casting and creating MAT_024 material model and then validating it.
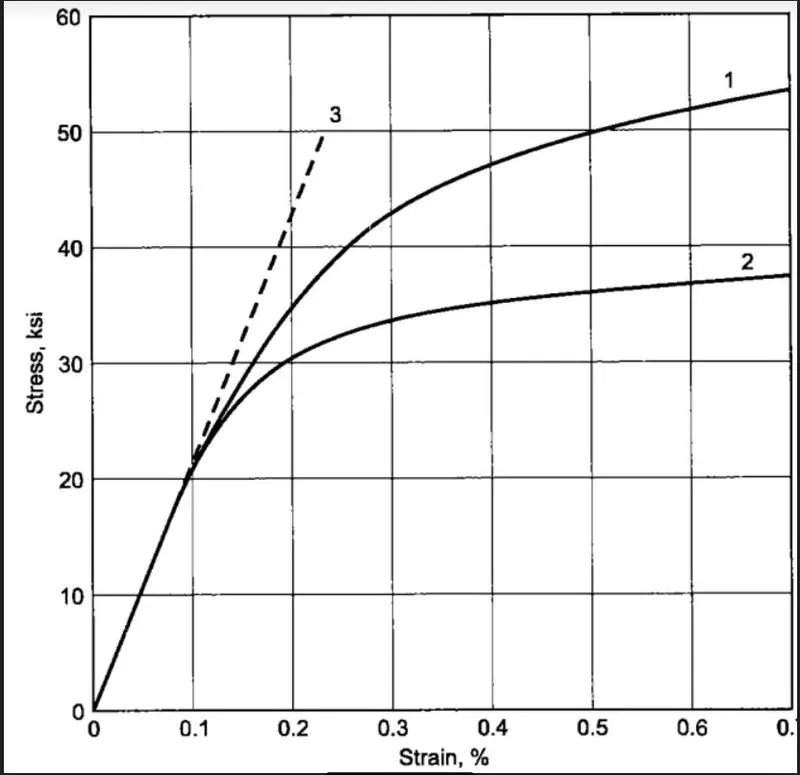
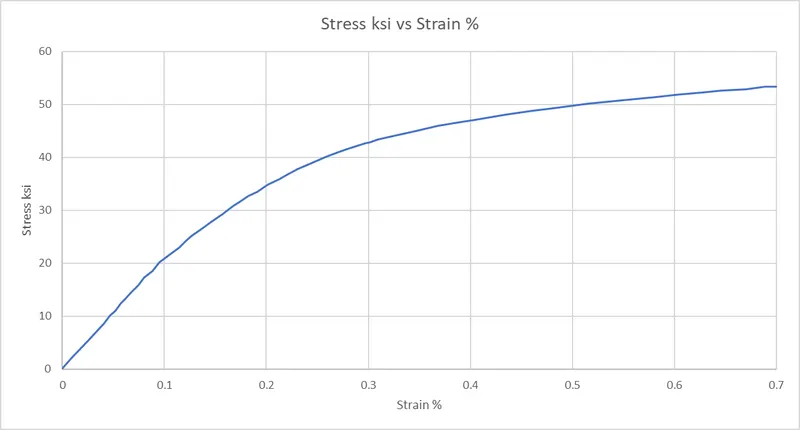
| Strain % | Stress ksi | True Strain (mm/mm) | True Stress `(kg)/(mm*ms^2)` | Effective Strain (mm/mm) | Effective Stress `(kg)/(mm*ms^2)` |
| 0.0000134 | 0.166 | 0.000000134 | 0.00114453 | -7.81407E-06 | 0.00114453 |
| 0.00982 | 2.24 | 0.0000982 | 0.01544426 | -9.05104E-06 | 0.015444256 |
| 0.0245 | 5.23 | 0.000245 | 0.03605958 | -5.41202E-06 | 0.036059581 |
| 0.0402 | 8.55 | 0.000402 | 0.05895017 | -7.37337E-06 | 0.058950175 |
| 0.0471 | 10.2 | 0.000471 | 0.07032652 | -1.73753E-05 | 0.070326524 |
| 0.052 | 11 | 0.00052 | 0.07584233 | -6.67919E-06 | 0.07584233 |
| 0.0569 | 12.4 | 0.000569 | 0.08549499 | -2.47111E-05 | 0.08549499 |
| 0.0618 | 13.2 | 0.000618 | 0.0910108 | -1.40150E-05 | 0.091010796 |
| 0.0667 | 14.4 | 0.000667 | 0.09928451 | -2.24709E-05 | 0.099284505 |
| 0.0745 | 15.8 | 0.000745 | 0.10893717 | -1.15028E-05 | 0.108937165 |
| 0.0805 | 17.3 | 0.000805 | 0.1192793 | -2.33227E-05 | 0.119279301 |
| 0.0883 | 18.6 | 0.000883 | 0.12824249 | -7.56663E-06 | 0.128242486 |
| 0.0951 | 20.1 | 0.000951 | 0.13858462 | -1.13865E-05 | 0.138584622 |
| 0.105 | 21.6 | 0.00105 | 0.14892676 | 1.57936E-05 | 0.148926758 |
| 0.115 | 23 | 0.00115 | 0.15857942 | 4.87617E-05 | 0.158579418 |
| 0.122 | 24.4 | 0.00122 | 0.16823208 | 5.17298E-05 | 0.168232078 |
| 0.127 | 25.2 | 0.00127 | 0.17374788 | 6.34259E-05 | 0.173747884 |
| 0.135 | 26.3 | 0.00135 | 0.18133212 | 9.07579E-05 | 0.181332117 |
| 0.14 | 27 | 0.0014 | 0.18615845 | 1.07242E-04 | 0.186158447 |
| 0.145 | 27.7 | 0.00145 | 0.19098478 | 1.23726E-04 | 0.190984777 |
| 0.157 | 29.3 | 0.00157 | 0.20201639 | 1.67118E-04 | 0.202016389 |
| 0.163 | 30.2 | 0.00163 | 0.20822167 | 1.84026E-04 | 0.20822167 |
| 0.168 | 30.9 | 0.00168 | 0.213048 | 2.00510E-04 | 0.213048 |
| 0.173 | 31.5 | 0.00173 | 0.21718485 | 2.21782E-04 | 0.217184855 |
| 0.179 | 32.2 | 0.00179 | 0.22201118 | 2.48266E-04 | 0.222011185 |
| 0.183 | 32.8 | 0.00183 | 0.22614804 | 2.59538E-04 | 0.226148039 |
| 0.191 | 33.5 | 0.00191 | 0.23097437 | 3.06022E-04 | 0.230974369 |
| 0.201 | 34.8 | 0.00201 | 0.23993755 | 3.43779E-04 | 0.239937554 |
| 0.212 | 35.8 | 0.00212 | 0.24683231 | 4.05899E-04 | 0.246832311 |
| 0.221 | 36.8 | 0.00221 | 0.25372707 | 4.48019E-04 | 0.253727068 |
| 0.231 | 37.8 | 0.00231 | 0.26062183 | 5.00139E-04 | 0.260621826 |
| 0.244 | 38.9 | 0.00244 | 0.26820606 | 5.77471E-04 | 0.268206059 |
| 0.259 | 40.1 | 0.00259 | 0.27647977 | 6.70015E-04 | 0.276479767 |
| 0.269 | 40.9 | 0.00269 | 0.28199557 | 7.31711E-04 | 0.281995573 |
| 0.278 | 41.5 | 0.00278 | 0.28613243 | 7.92983E-04 | 0.286132428 |
| 0.296 | 42.6 | 0.00296 | 0.29371666 | 9.20315E-04 | 0.293716661 |
| 0.302 | 42.9 | 0.00302 | 0.29578509 | 9.65951E-04 | 0.295785088 |
| 0.309 | 43.3 | 0.00309 | 0.29854299 | 1.01680E-03 | 0.298542991 |
| 0.317 | 43.7 | 0.00317 | 0.30130089 | 1.07765E-03 | 0.301300894 |
| 0.346 | 45 | 0.00346 | 0.31026408 | 1.30540E-03 | 0.310264078 |
| 0.368 | 45.9 | 0.00368 | 0.31646936 | 1.48231E-03 | 0.31646936 |
| 0.391 | 46.7 | 0.00391 | 0.32198517 | 1.67401E-03 | 0.321985166 |
| 0.404 | 47.1 | 0.00404 | 0.32474307 | 1.78486E-03 | 0.324743069 |
| 0.434 | 48 | 0.00434 | 0.33094835 | 2.04176E-03 | 0.33094835 |
| 0.46 | 48.8 | 0.0046 | 0.33646416 | 2.26346E-03 | 0.336464156 |
| 0.476 | 49.2 | 0.00476 | 0.33922206 | 2.40431E-03 | 0.339222059 |
| 0.496 | 49.7 | 0.00496 | 0.34266944 | 2.58037E-03 | 0.342669437 |
| 0.515 | 50.1 | 0.00515 | 0.34542734 | 2.75122E-03 | 0.34542734 |
| 0.554 | 50.9 | 0.00554 | 0.35094315 | 3.10291E-03 | 0.350943146 |
| 0.581 | 51.4 | 0.00581 | 0.35439052 | 3.34897E-03 | 0.354390525 |
| 0.604 | 51.8 | 0.00604 | 0.35714843 | 3.55982E-03 | 0.357148428 |
| 0.627 | 52.2 | 0.00627 | 0.35990633 | 3.77067E-03 | 0.359906331 |
| 0.646 | 52.6 | 0.00646 | 0.36266423 | 3.94152E-03 | 0.362664234 |
| 0.67 | 52.9 | 0.0067 | 0.36473266 | 4.16715E-03 | 0.364732661 |
| 0.689 | 53.3 | 0.00689 | 0.36749056 | 4.33800E-03 | 0.367490564 |
| 0.7 | 53.4 | 0.007 | 0.36818004 | 4.44321E-03 | 0.368180039 |
This effective stress and effective strain are plotted in excel with positive values of strain and using curve fit the noise in data can be taken care.
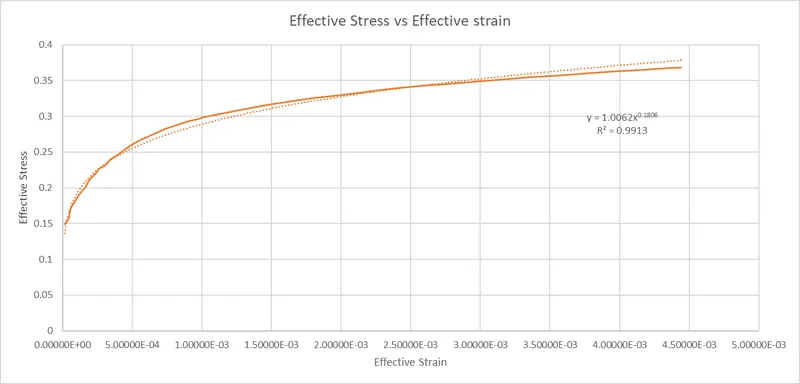
The best curve fit from Trend line which suits the data is the power law and the curve we get
`y = 1.0062x^0.1806` which fits 99.13%
Using proper sequential data starting with the yield stress we get Effective strain as 0.00002 and adding with 0.0000876 we get 50 data points and using this above curve effective stress is calculated
| Effective Strain | Effective Stress |
| 0.00002 | 0.142577282 |
| 0.0001076 | 0.193210004 |
| 0.0001952 | 0.215151792 |
| 0.0002828 | 0.230049606 |
| 0.0003704 | 0.241538459 |
| 0.000458 | 0.250978557 |
| 0.0005456 | 0.259038205 |
| 0.0006332 | 0.266098607 |
| 0.0007208 | 0.272399096 |
| 0.0008084 | 0.278100406 |
| 0.000896 | 0.283316025 |
| 0.0009836 | 0.288129243 |
| 0.0010712 | 0.292603109 |
| 0.0011588 | 0.296786571 |
| 0.0012464 | 0.300718431 |
| 0.001334 | 0.304430006 |
| 0.0014216 | 0.307946955 |
| 0.0015092 | 0.311290584 |
| 0.0015968 | 0.314478788 |
| 0.0016844 | 0.317526753 |
| 0.001772 | 0.32044748 |
| 0.0018596 | 0.323252194 |
| 0.0019472 | 0.325950657 |
| 0.0020348 | 0.328551411 |
| 0.0021224 | 0.331061983 |
| 0.00221 | 0.333489034 |
| 0.0022976 | 0.335838494 |
| 0.0023852 | 0.338115665 |
| 0.0024728 | 0.340325307 |
| 0.0025604 | 0.342471712 |
| 0.002648 | 0.344558764 |
| 0.0027356 | 0.346589987 |
| 0.0028232 | 0.348568594 |
| 0.0029108 | 0.350497518 |
| 0.0029984 | 0.352379447 |
| 0.003086 | 0.35421685 |
| 0.0031736 | 0.356012001 |
| 0.0032612 | 0.357766999 |
| 0.0033488 | 0.359483784 |
| 0.0034364 | 0.361164157 |
| 0.003524 | 0.362809789 |
| 0.0036116 | 0.364422236 |
| 0.0036992 | 0.366002948 |
| 0.0037868 | 0.36755328 |
| 0.0038744 | 0.369074498 |
| 0.003962 | 0.370567789 |
| 0.0040496 | 0.372034267 |
| 0.0041372 | 0.373474978 |
| 0.0042248 | 0.374890905 |
| 0.0043124 | 0.376282977 |
| 0.0044 | 0.377652067 |
LS Dyna:
This above Effective stress ans strain data is using in simulating the given Dogbone specimen.
This is opened in LS PrePost
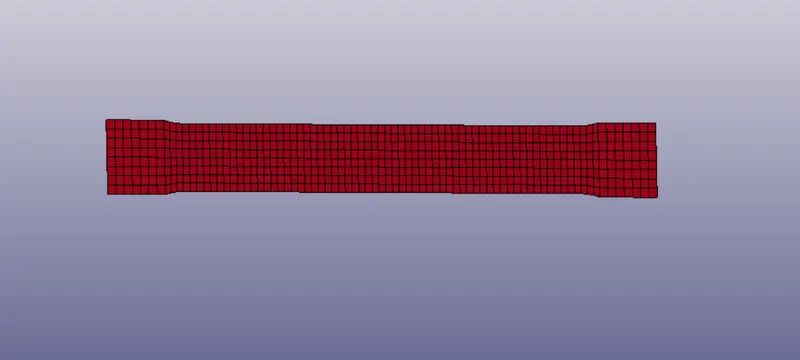
Necessary cards are generated for simulation
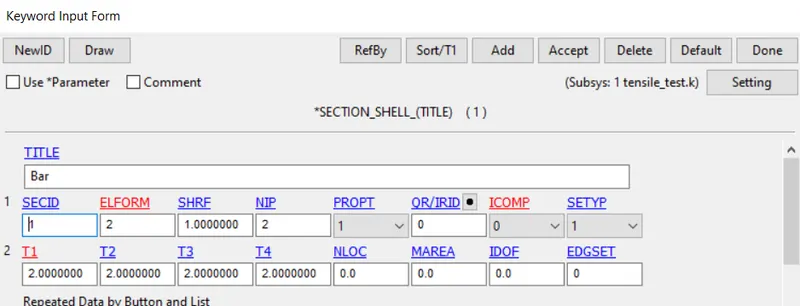
SECTION
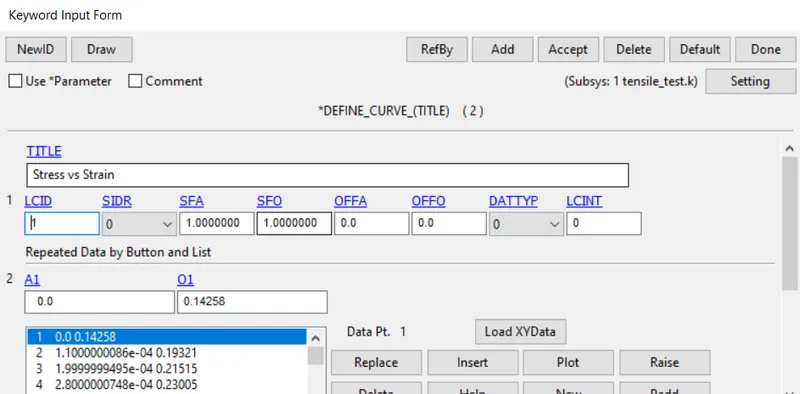
Material CURVE
This effective stress vs effective strain saved in csv format is loaded with LoadXY data
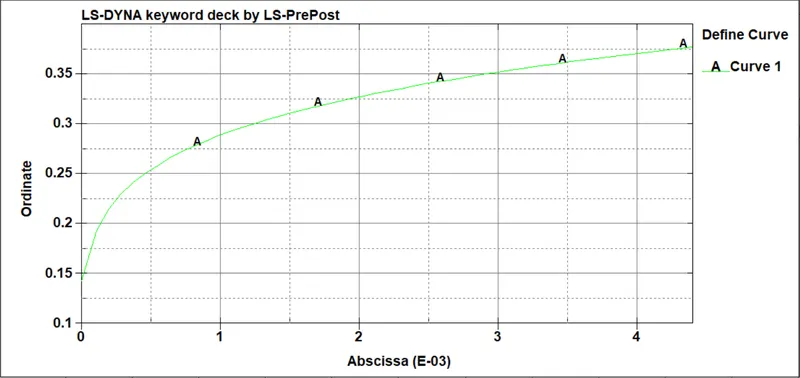
Plotting it we get,
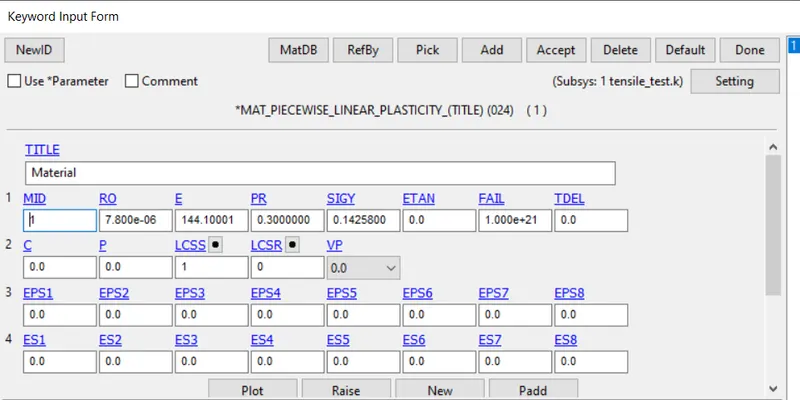
MAT 024
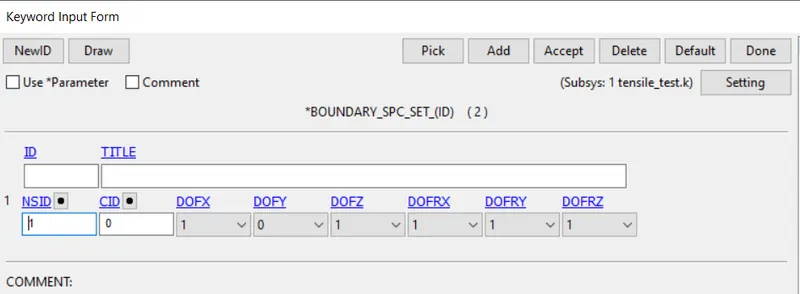
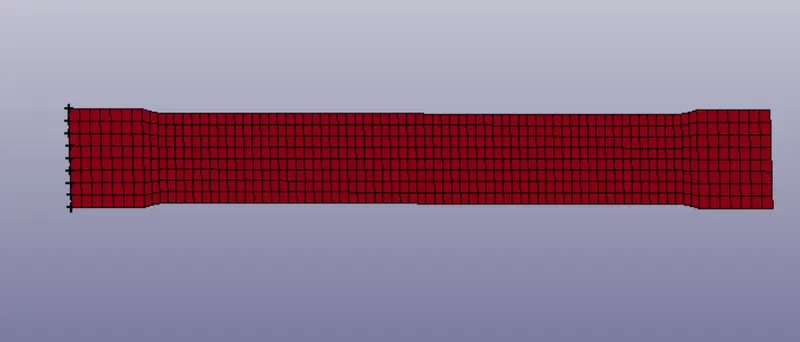
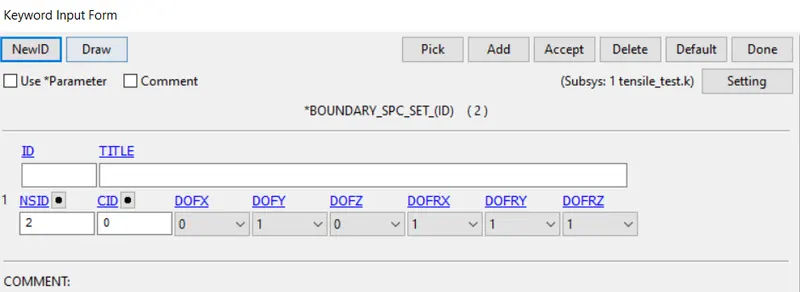
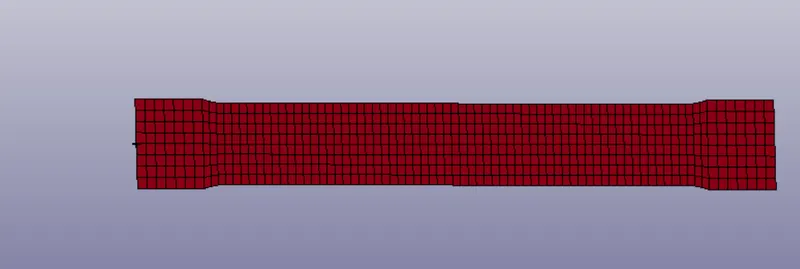
Boundary Conditions
Fixing the nodes
Displacement curve:
Giving displacement of max 1 mm gives close to the highest value strain in the curve
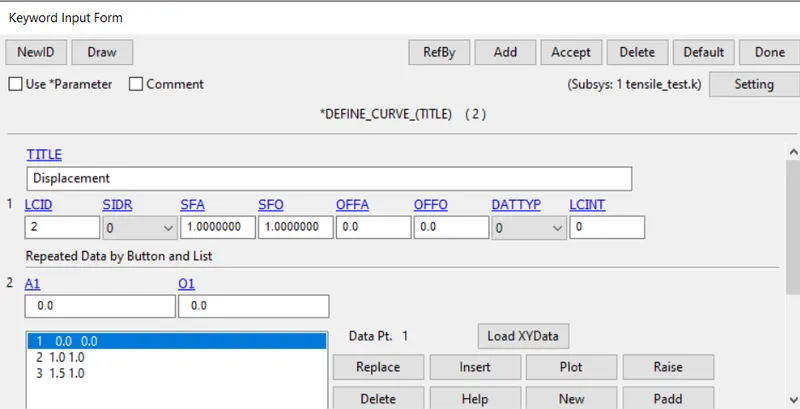
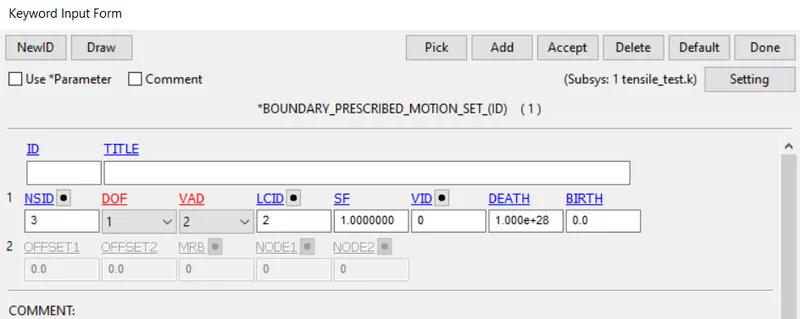
For displacement of nodes
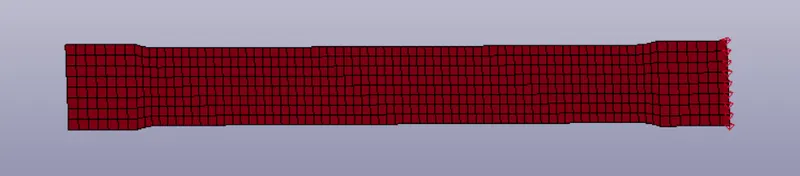
Since this quasistatic process IMPLICIT is activated
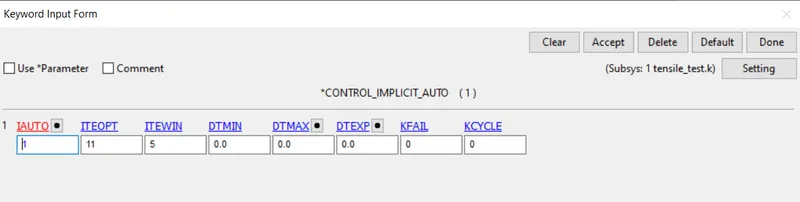
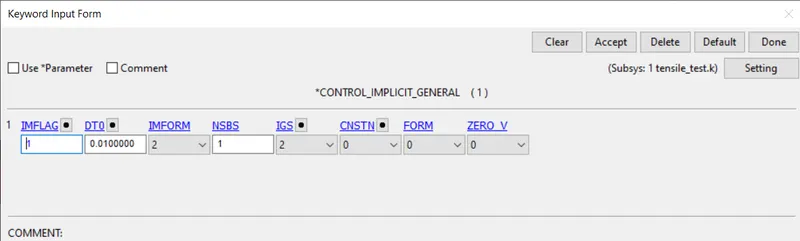
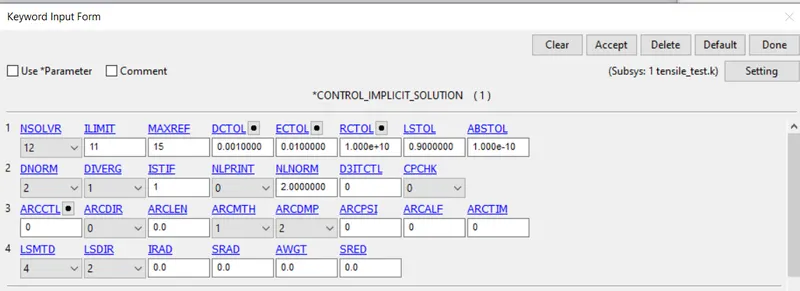
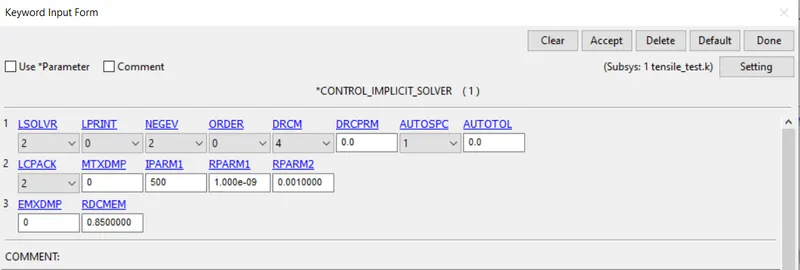
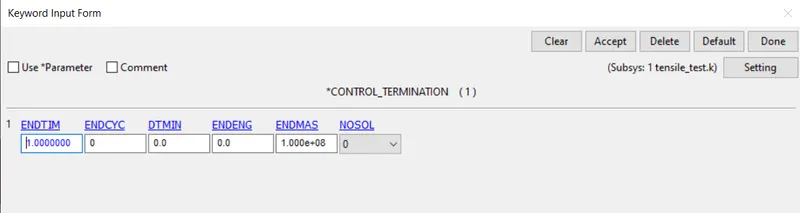
Termination time is given 1 ms
Output data:
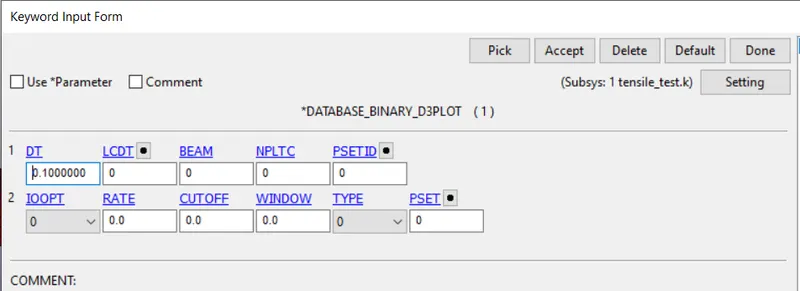
For strain data EXTENT_BINARY is activated with strflg = 1
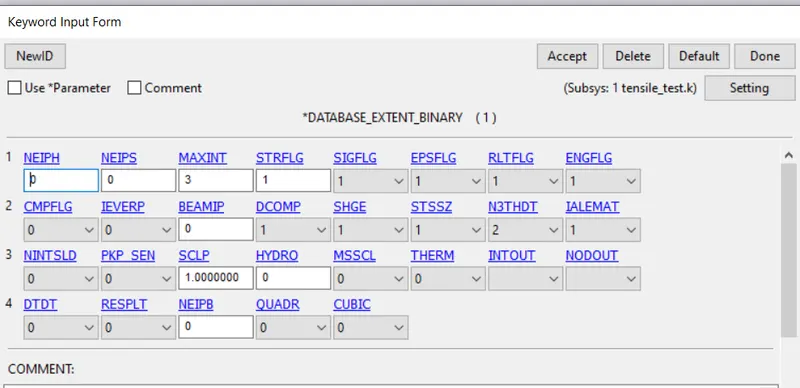
In ASCII
ELOUT and GLSTAT is activated
Results:
The contour of vonmises stress
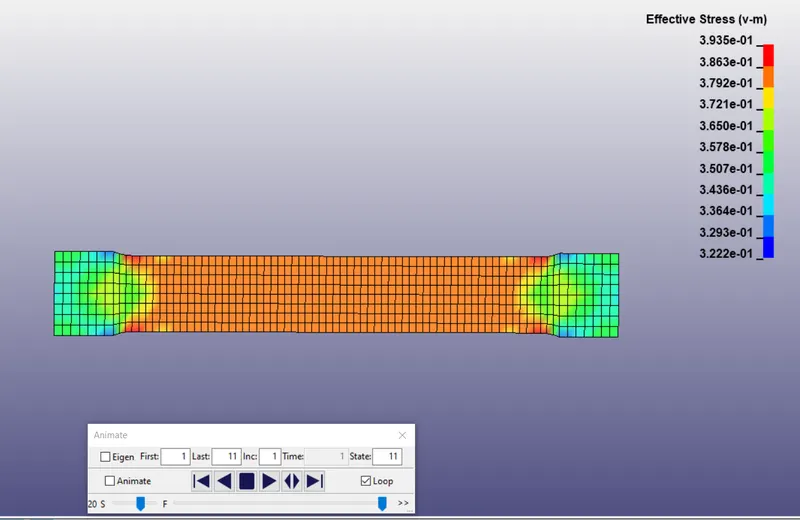
Uniaxial X Strain is plotted for center elements form History
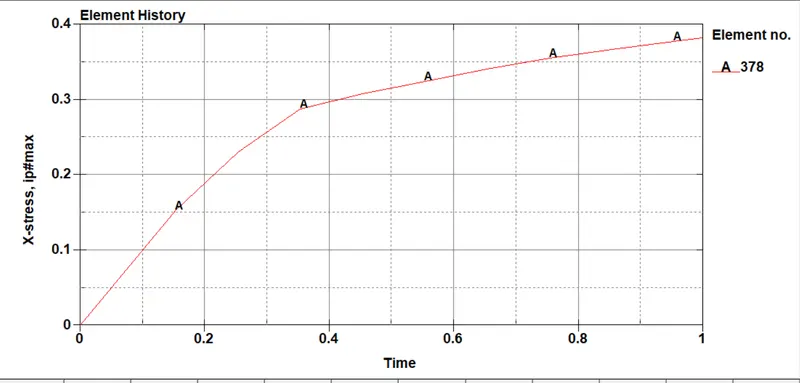
Similarly X strain for the same element
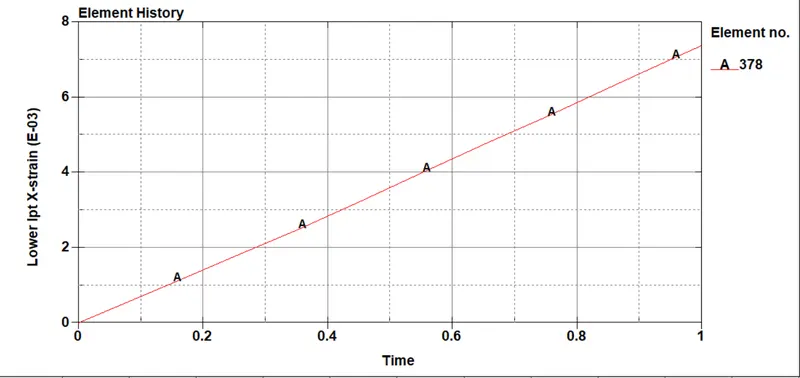
Using cross plot we get True Stress vs True Strain
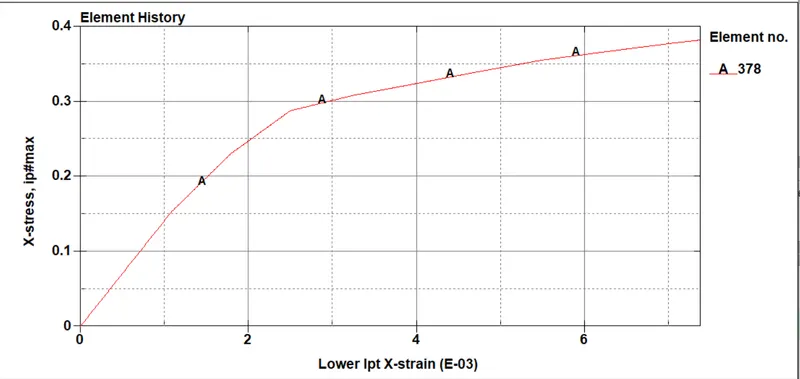
This curve is validated with the given true stress strain curve
Conclusion:
The given Stress strain curve is converted to material data and is validated with given Dogbone specimen.