Week - 9 Material Modeling from Raw Data
AIM:
The objective of the report is to simulate the tensile test specimen, where specimen material is modelled by using raw data and validate the results.
PROCEDURE:
1)Material-Processing -
Given, true stress- true strain diagram of Graphite iron casting as shown in the fig. In this report, test data of plot 1 is considered for analysis.
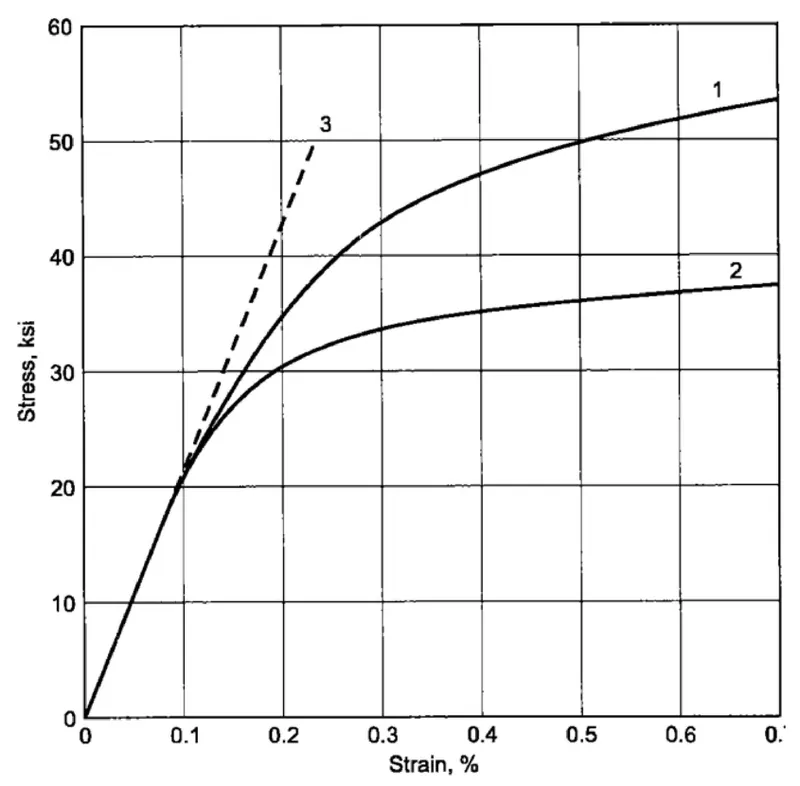
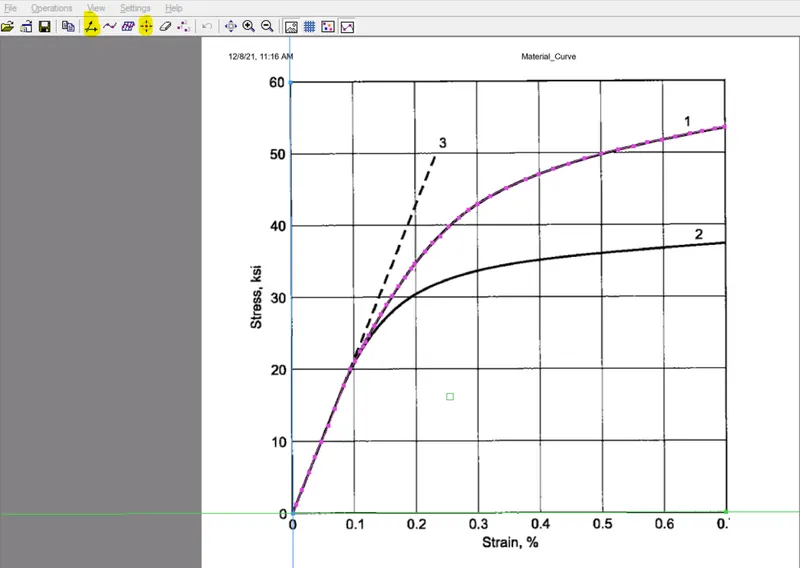
First, import the data of the plot 1 by using GetData Graph Digitizer software. Open the image file in the software and mark the axes and points of the plot1 by using set the scale and point capture mode as shown in the fig. It is recommended to mark more points to capture a curve compared to a straight line.
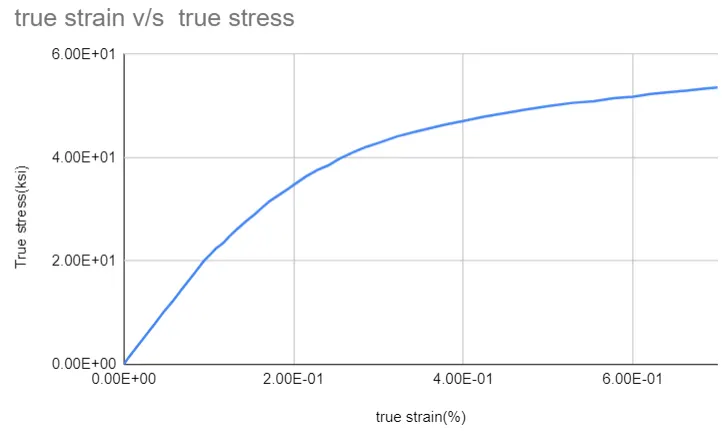
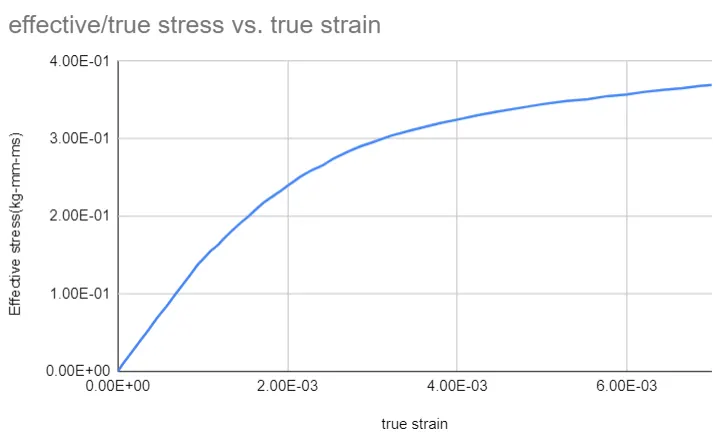
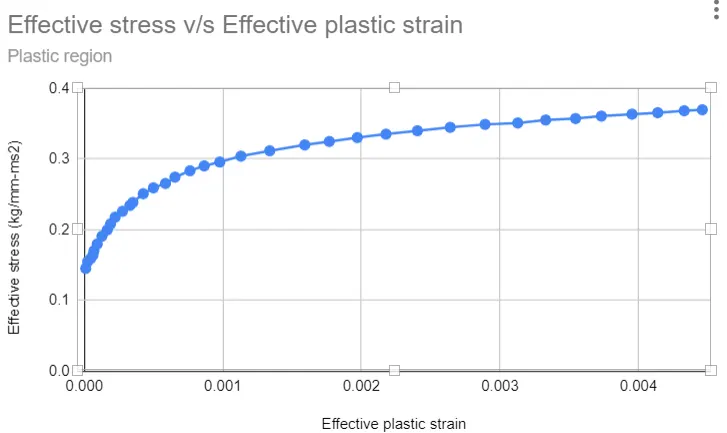
Next, export the data to excel sheet and the plot obtained from raw data is shown in the fig. It is important to note that smooth curve should be inputted in the LS-DYNA as noise in the curve results in false solutions.
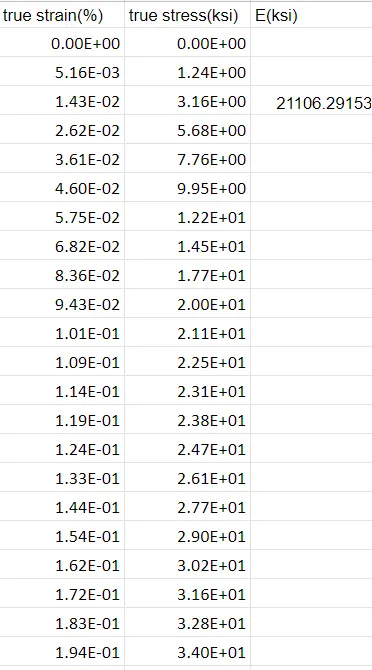
Now, check the parameters obtained from processed data with the original data.
1 ksi = 10^3 psi.
Youngs modulus(E) = 21106.3 * 10^3 psi = 21.1E+06 psi
Since, the calculated Youngs modulus and plot obtained from processed data matches with the original data, the processed data is considered for analysis.
2)Unit System -
In this report, kg-mm-ms unit system is followed. The original data is given in kilopound per square inch (ksi) unit system.
Conversion factor - Stress 1(ksi) = 6.895e-3(kg-mm-ms)
Since, in original data the true strain is in (%). So convert true strain to ratio by dividing it with 100.
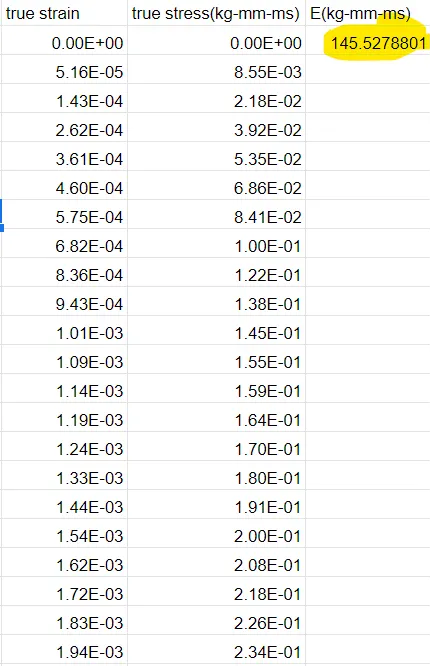
Youngs modulus (E) = 145.528 (kg--mm-ms)
3)Material Card -
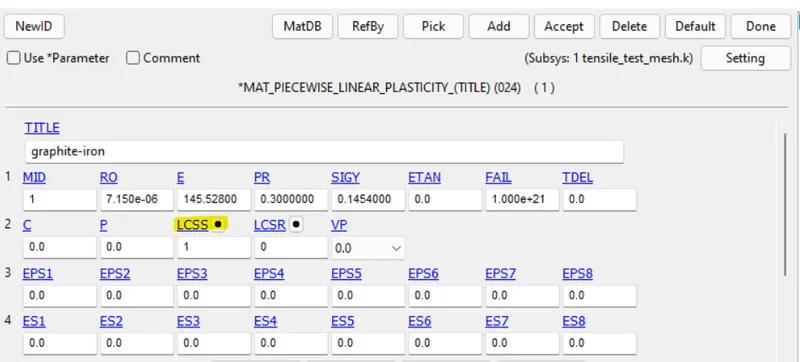
*MAT_24-PIECEWISE_LINEAR_PLASTICITY material card is used to define the material. In this material card, effective plastic strain v/s effective stress data should be imported.
So, convert true strain to effective plastic strain.
Effective plastic strain = Total true strain - true stress/E
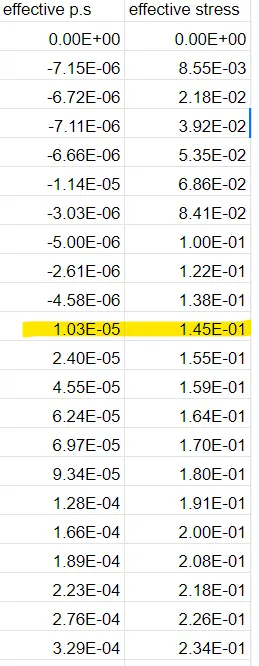
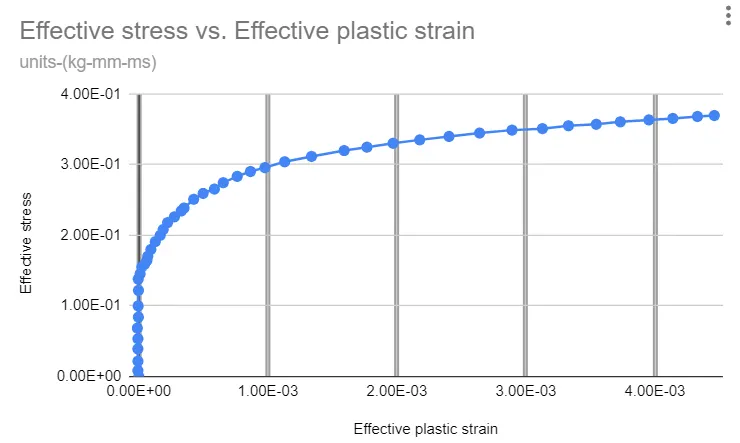
It is observed that, elastic region is followed till effective stress = 0.145 kg/mm-ms2. In material card, the elastic portion of the curve need not to be inputed. So, input only plastic region curve. So, Yield stress is taken as 0.145 kg/mm-ms2.
4)Pre-processing -
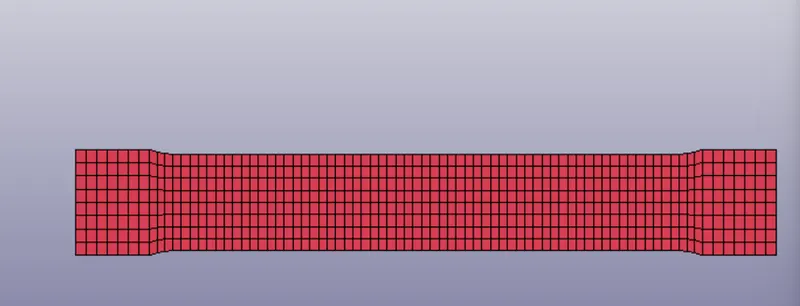
After processing the data, next import the dog bone specimen ,model in LS-DYNA as shown in the fig.
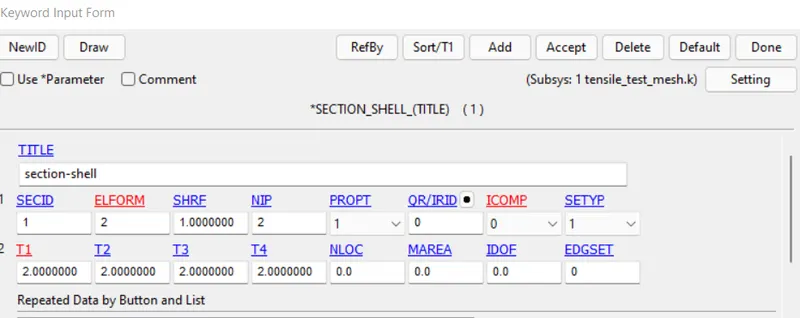
SECTION CARD -
DEFINE CURVE -
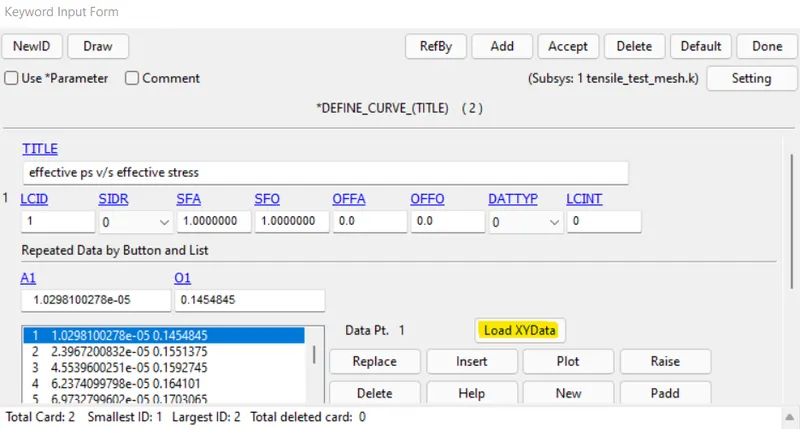
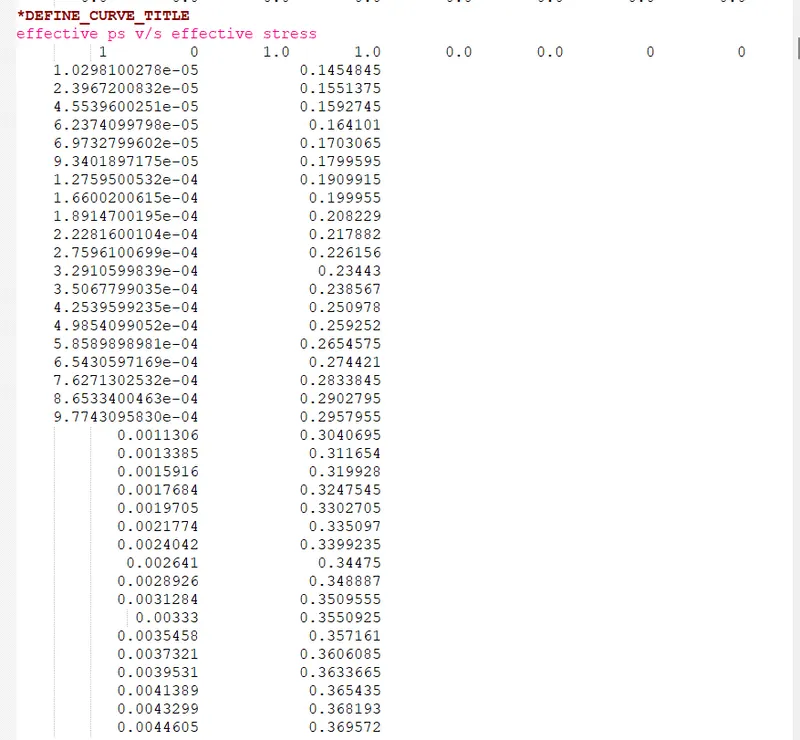
The processed data is imported to the material card by LCID curve.
In LCID curve, the data is imported in two ways -
- In *DEFINE_CURVE keyword, import the processed data by Load XYData. The processed data is to be in .csv format.
- Input the values directly in NOTEPAD++
MATERIAL CARD -
In material card, input the curve by LCSS parameter. Input the elastic region parameters in the material card.
BOUNDARY CONDITIONS -
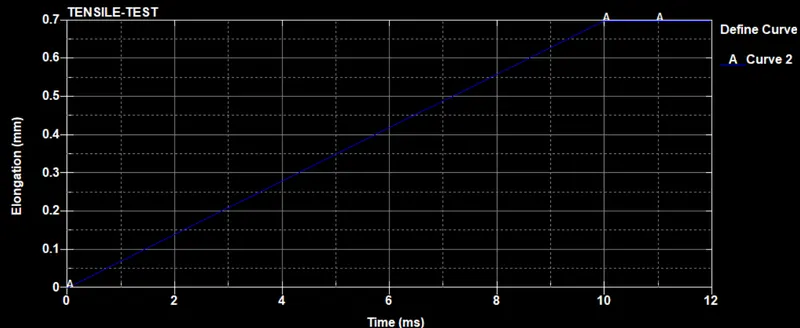
In tensile test, the specimen is subjected to tensile force. In order to get stable results instead of giving load conditions, the boundary conditions are given as displacement curve.
TERMINATION -
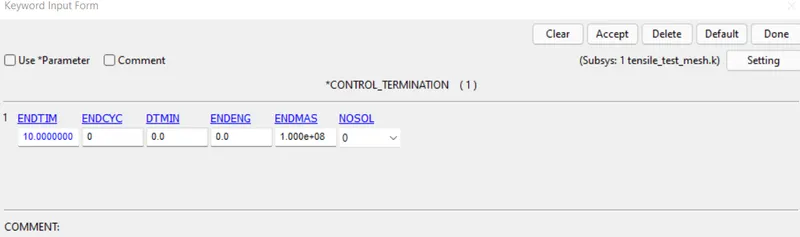
The total termination time is given as 10ms.
5)RESULTS -
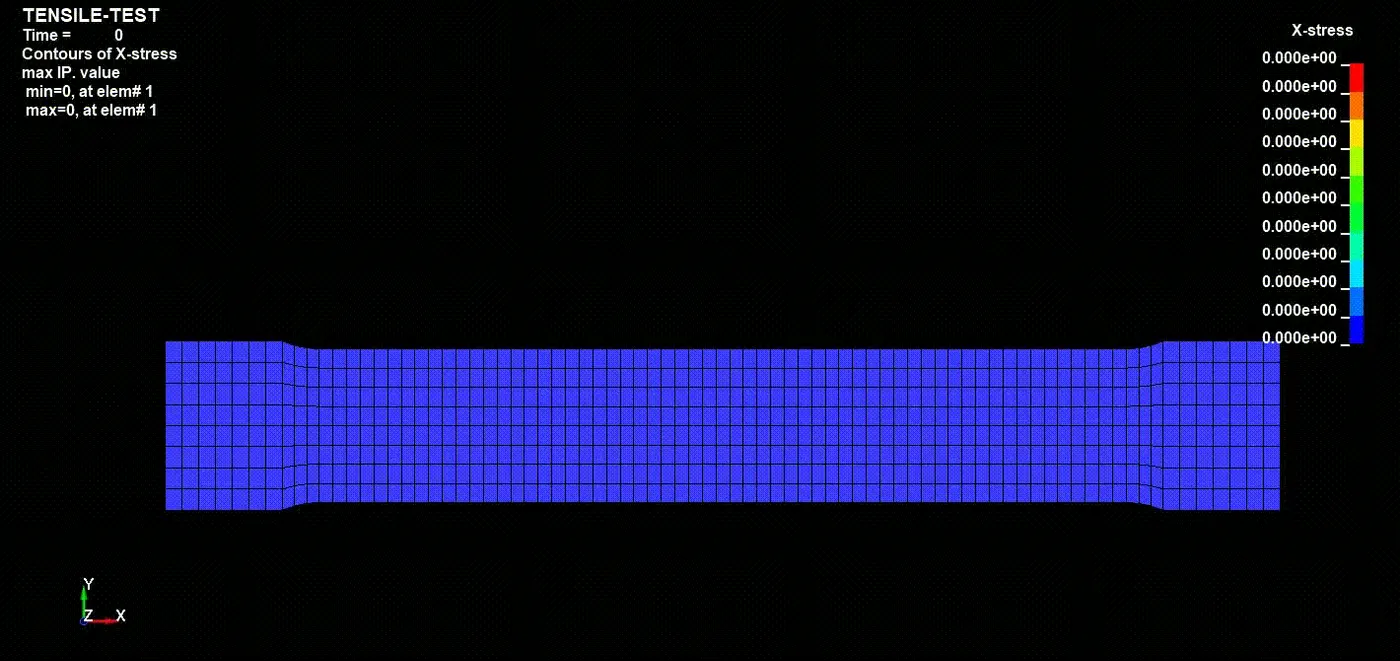
Max X-stress = 0.36347 kg/mm-ms2
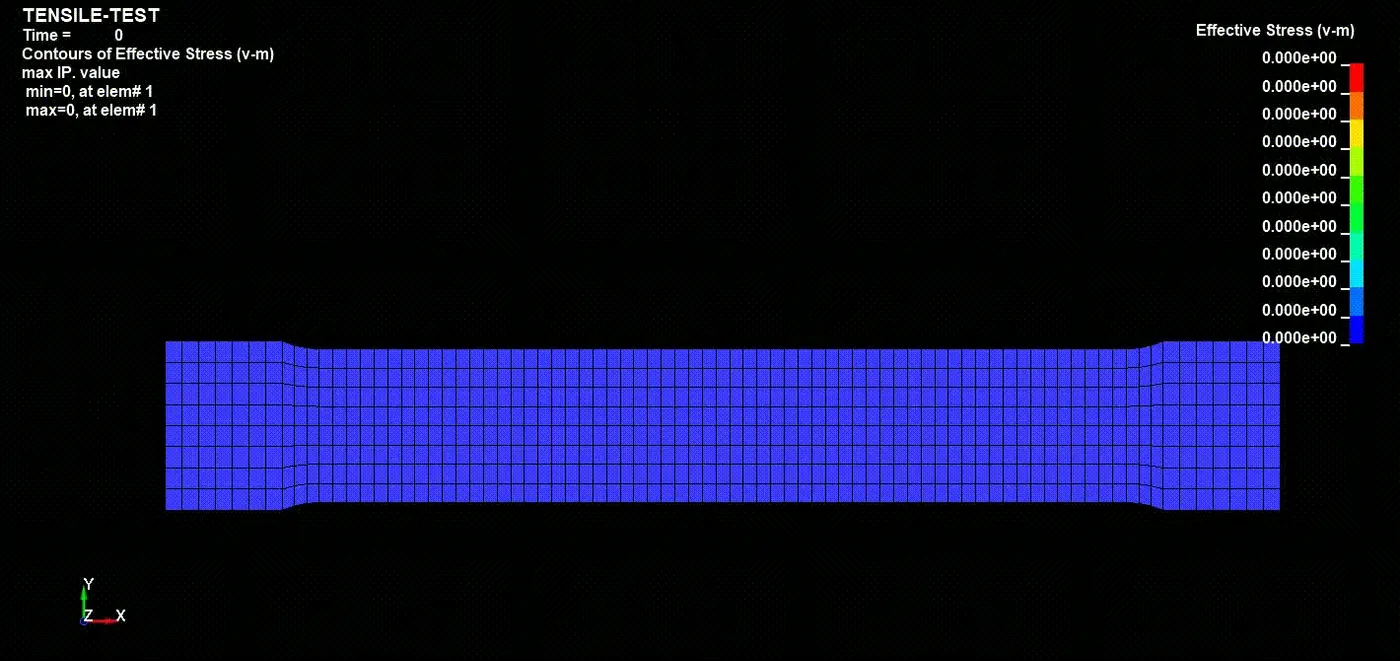
Max Effective stress = 0.35778 kg/mm-ms2
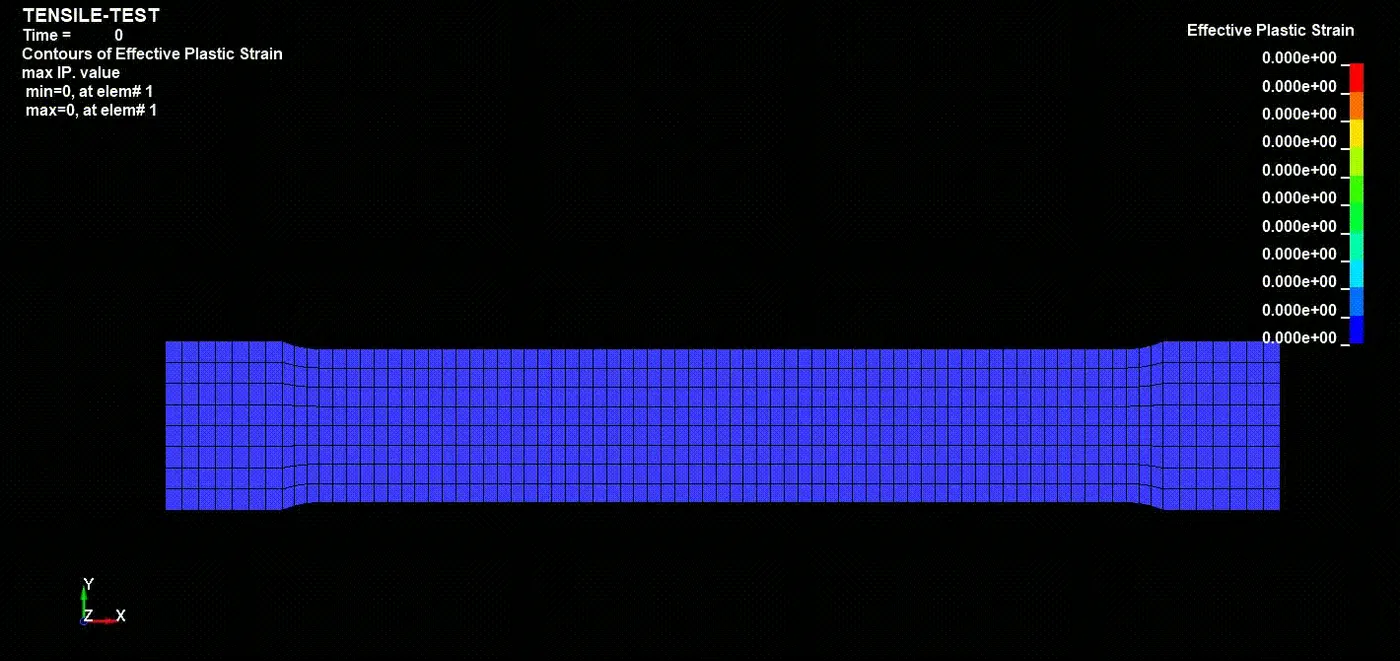
Max Effective plastic strain = 3.579e-03
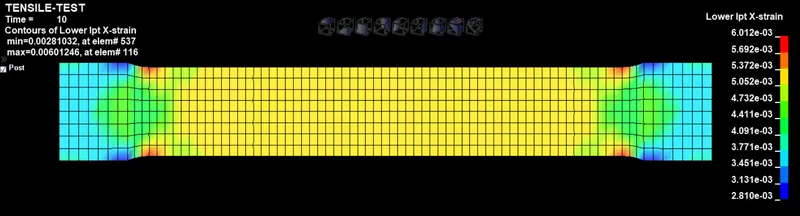
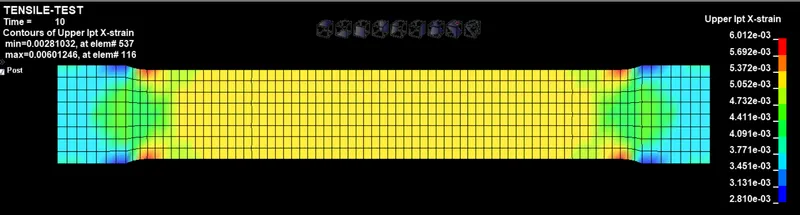
Max X - True plastic strain = 6.012e-3. In section card for ELFORM=2, by default '2' integration points along thickness are defined. From the plots, in both integration points, the true X plastic strain is uniform along the thickness.
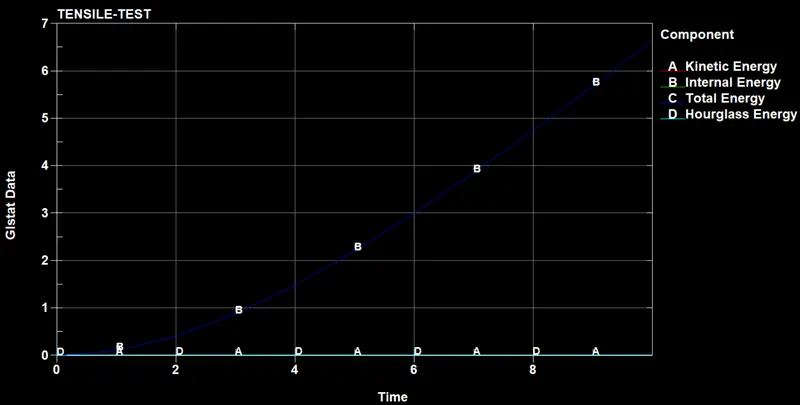
Due to external loading effect, the total energy of the system increases. It is observed from the energy plot, the hour glass energy is negligible compared to total energy, the system is stable.
The plot shows the X stress of the element - 287. It is observed that the max X- stress developed in the element after simulation is 0.347 kg/mm-ms2

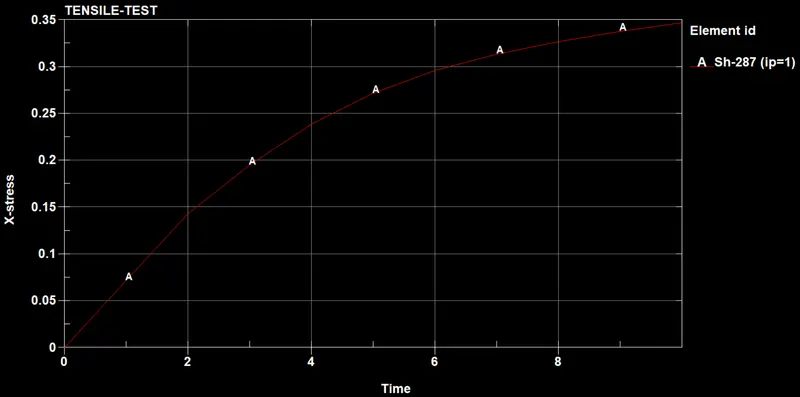
NOTE - The comparison is for element I.D 287
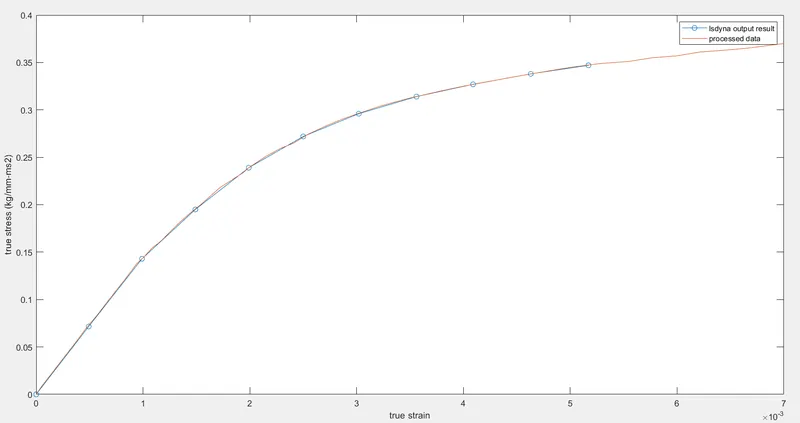
The following fig shows the comparison of processed data curve and result obtained from simulation. It is observed that, almost the two curves fit accurately. Since, in boundary conditions, the displacement curve the elongation is given up to 0.7mm, the maximum strain obtained is 0.00517.
CONCLUSION:
The stress values obtained from the simulation shows the similar results of the processed data.