Week - 9 Material modeling from raw data
Objective- Material modeling and generation of simulation data using experimental data.
Material Modeling-
The material model is used in the industry to verify the data and develop a new type of material for various applications. It consist of so many steps to carried out the data and analyze that data. There are so many steps involved during material modeling.
Why We Need Material Modeling-
Material modeling is one of the important roles in the CAE industry, When we want to verify the experimental data with simulation data we need to model the material as per the software need, So for that reason, we have to follow these steps to convert experimental data into desirable data, so that one can put in the simulation software.
Steps In Material Modeling-
1- Extracting the data from an experiment.
2- Data cleanup.
3- Unit and data conversion conversion
4- Defining a stress-strain curve in simulation software.
5- Simulation step in software.
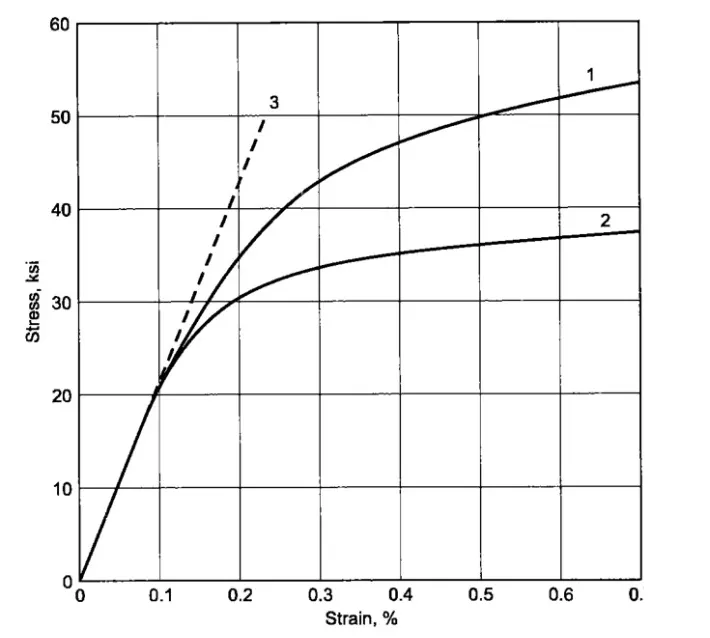
A- This is the Graph from where we need to extract the data, Digitizer software used to extract the data from this graph, This graph is obtained from an experiment. The experimental data come with either force-displacement or stress-stain curve.
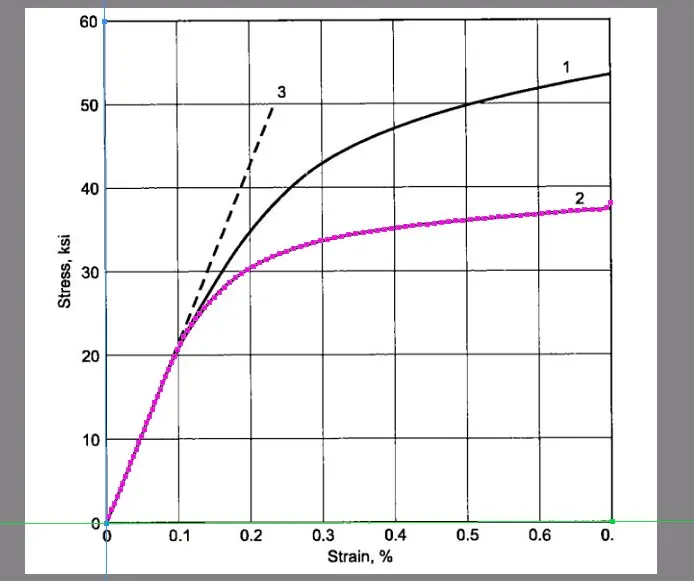
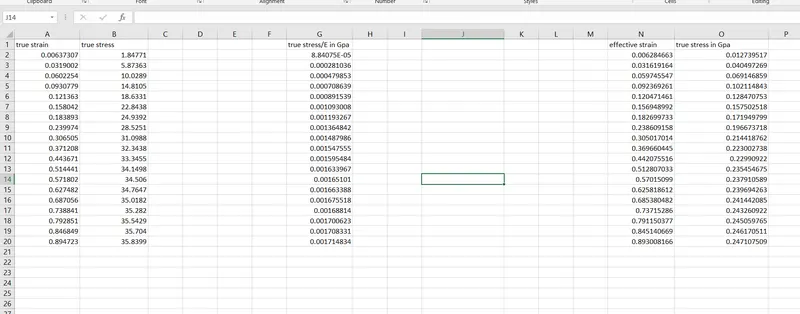
B- Number-2 graph used to extract the data- Values for stress and strain which true stress-strain value is collect from digitizer software by point to point which is not perfect curve, so clean up the data we need to perform curve fitting where we can find the perfect shape.
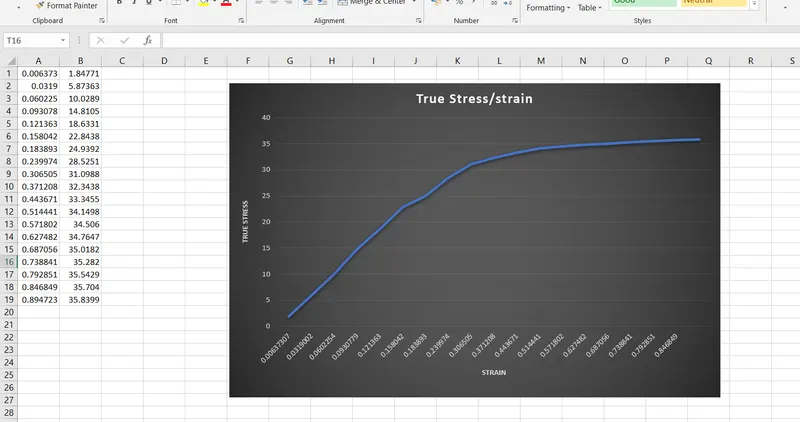
C- Here is the graph we have plotted with extracted data., These are the values we extract from the stress-strain curve with the help of the software and draw it into ms-excel.
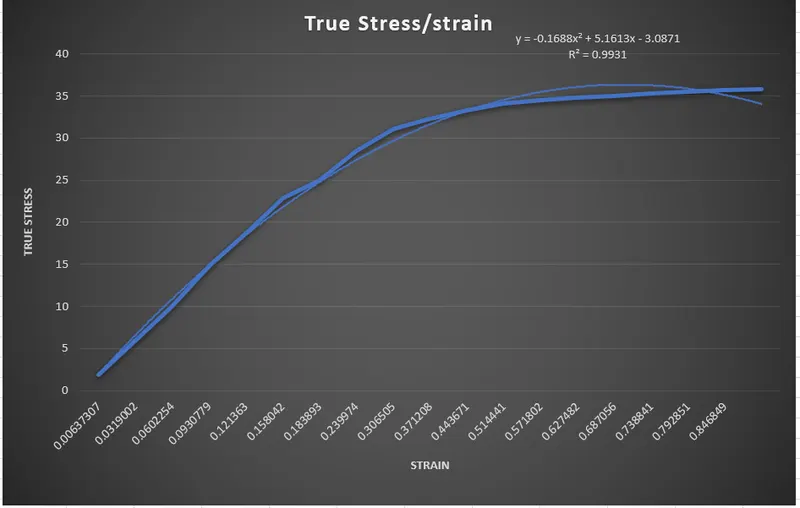
Here we can see that after performing curve fitting we got the R^2 value which near 100%, so we can use this data for further calculation and we can skip the curve fitting to make the curve more smooth.
D- Calculation-
From the graph, we extracted the true stress and strain, and from there by using some formula we need to calculate effective strain and effective stress because in order to put stress and stress data for analysis we need the same effective stress and strain.
Effective stress= true stress
Effective strain= True strain- True stress/E
E= Modulas of elasticity= 20.9E+06 psi = 144.01 GPa
And the data we extracted from the graph is in ksi, so we need to convert it in to GPa
1ksi= 0.00689274 GPa
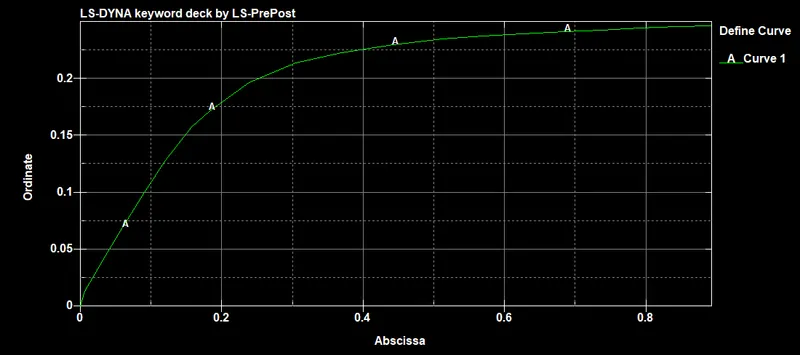
Here is the graph for Effective stress and effective strain plotted in MAT_24.
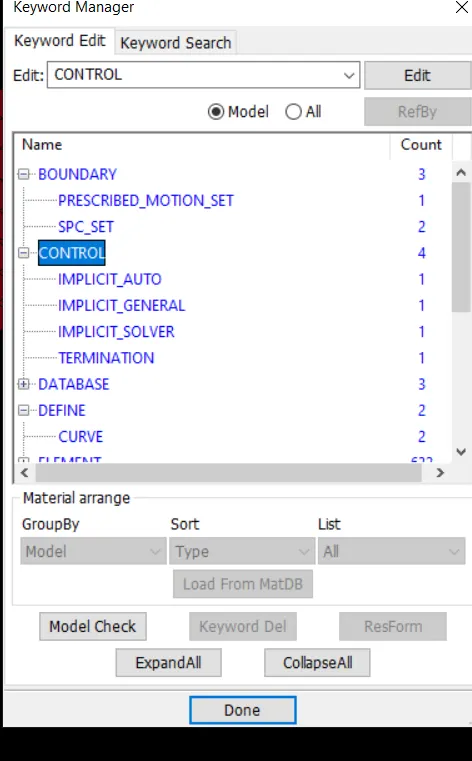
Simulation Step for tensile test and simulation-
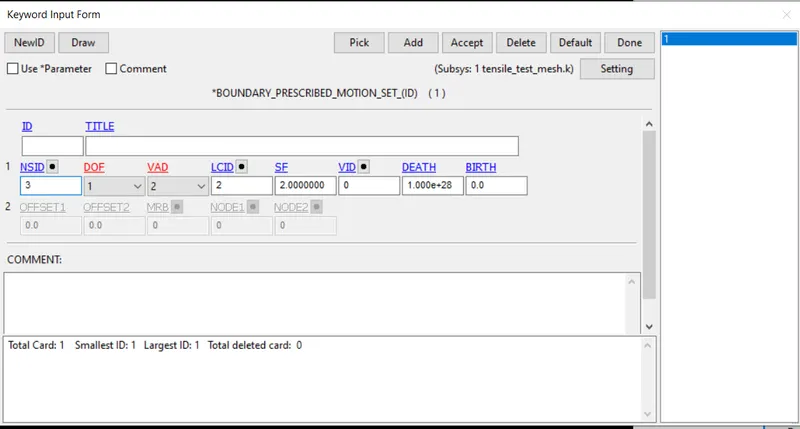
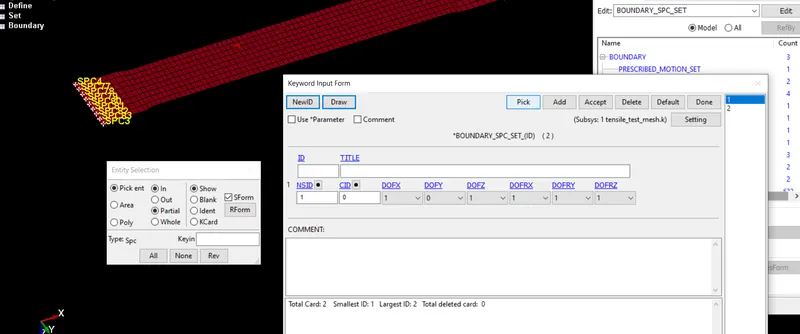
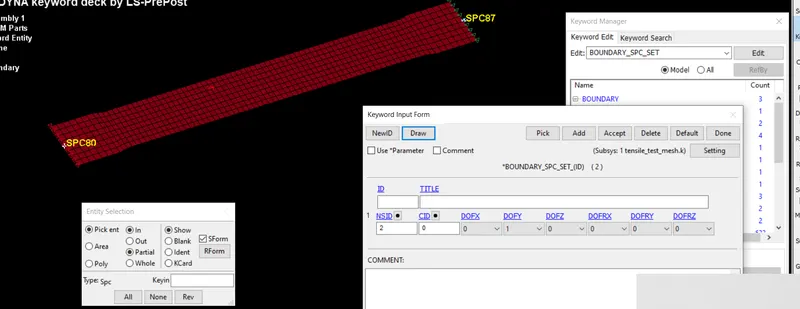
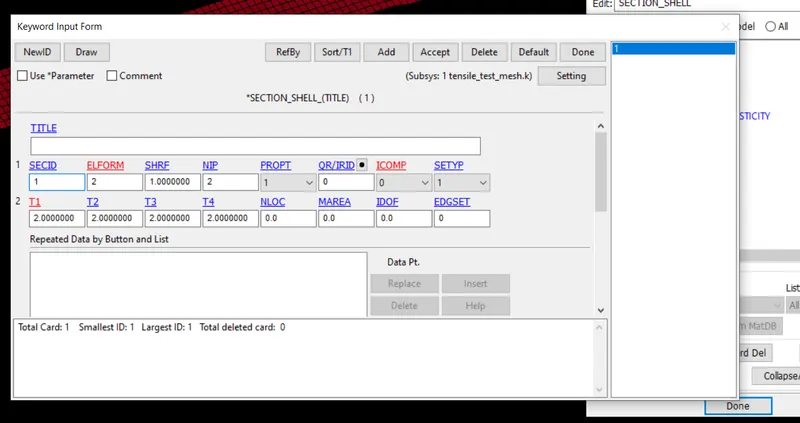
The boundary condition for the specimen.
On the one side we need to constrain the motion and another side we need to give displacement in order to move the specimen.
Prescribed_motion_set= Used for give motion to the dpecimen.
SPC_SET= To constrain the specimen.
Material Define to the specimen.
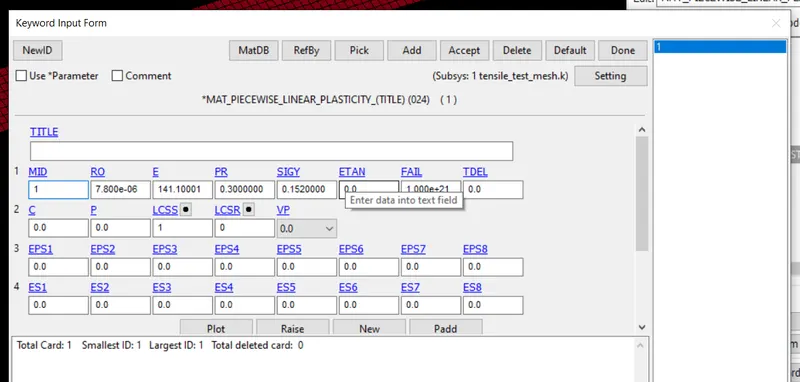
Here is the most important part of the simulation is to assign the material card to the specimen.
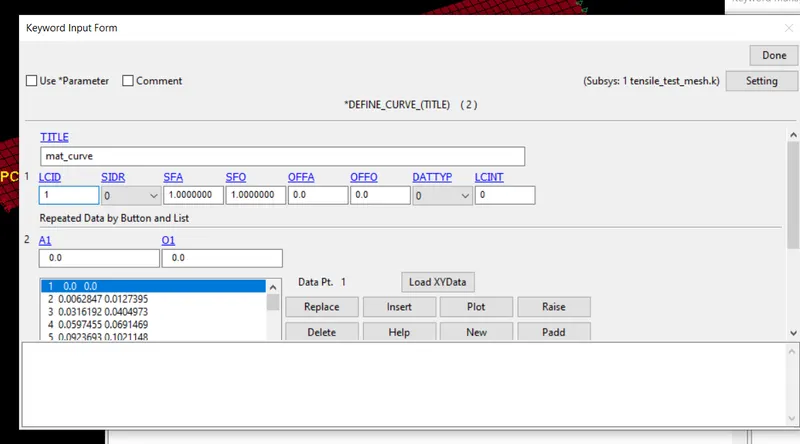
Here in LCSS we need to give the values which we extracted from the graph (effective stress/strain) and other values like E, PR, SIGY.
E= GIVEN
SIGY= WE can find from the 0.2% offset method.
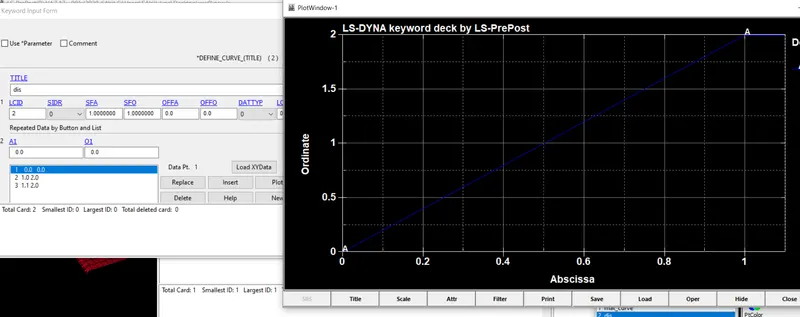
Graph data (effective stress/strain) put it in define curve which is going to assign in LCSS.
Results-
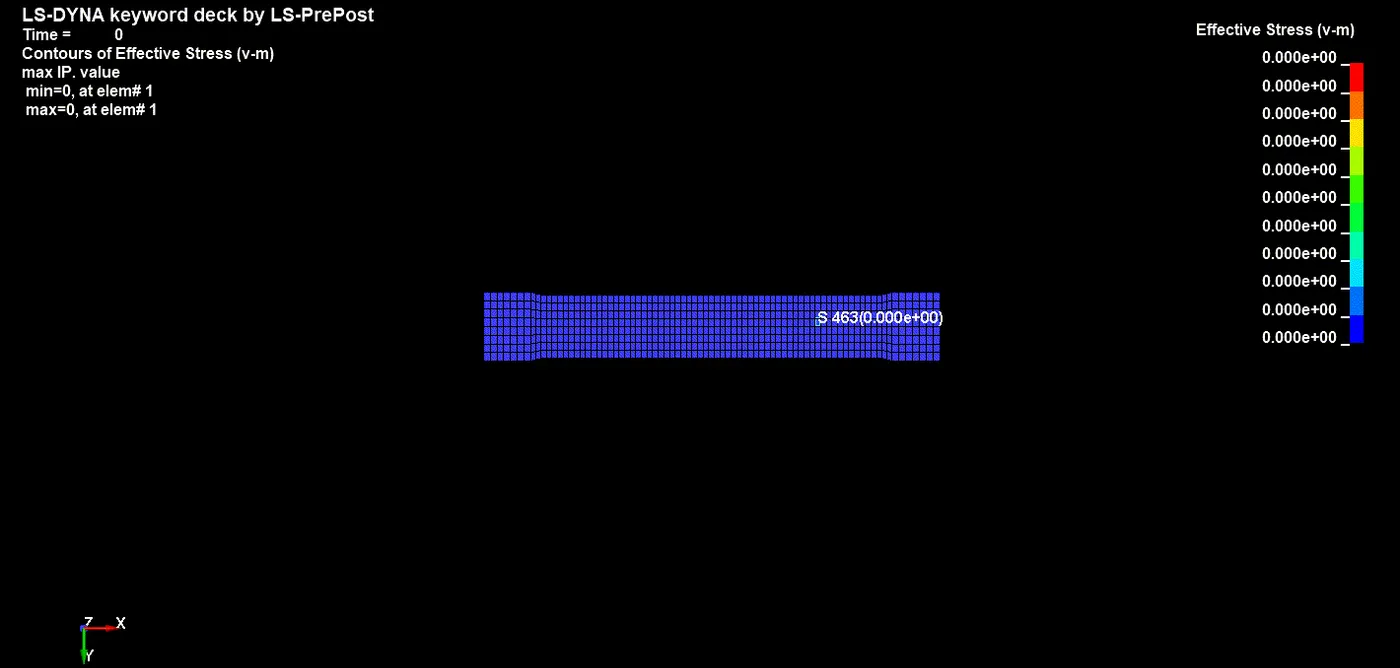
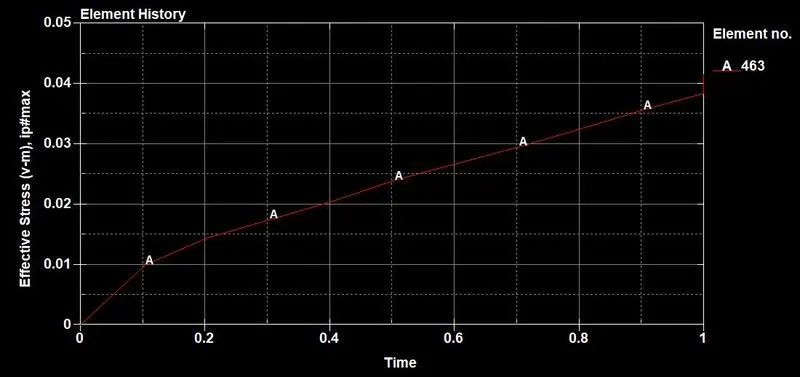
Here is the effective plastic strain and stress which we got from the simulation.
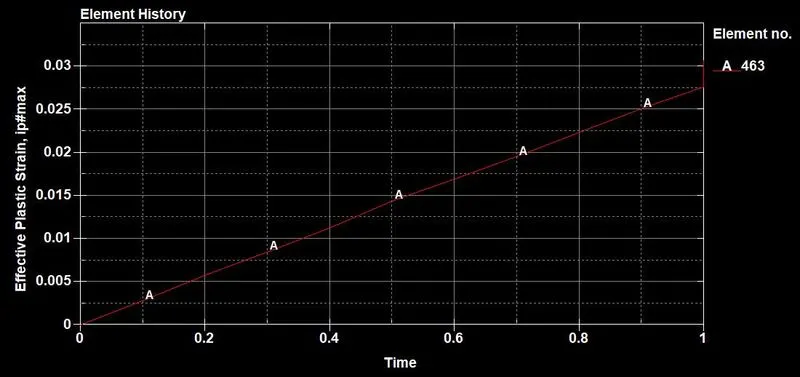
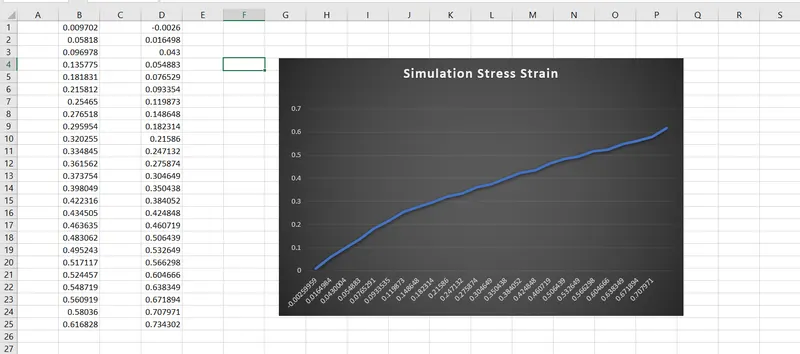
Stress vs Strain (effective) plotted in to excel.
If we compare with the experimental data it seems close to that data, some pint its behaves differently because we did not clean up the data, so in order to collect accurate data we need to perform curve fitting and clean up the data, but here we can also observe that the experimental data and simulation data are nearly matching.
Conclusion-
1- True stress and strain data extracted from the given experimental graph.
2- True stress and strain data converted into effective stress and strain data using formulas.
3- Effective stress-strain data are imported into the simulation set up along with another parameter.
4- Tensile test and stress, strain graph has been plotted using Ls-Dyna.
5- Experimental Plot and Simulation Plot for stress-strain have been compared.