Week - 9 Material Modeling from Raw Data
AIM:
Material modeling of graphite iron casting from the experimental stress strain curve
EXPLANATION:
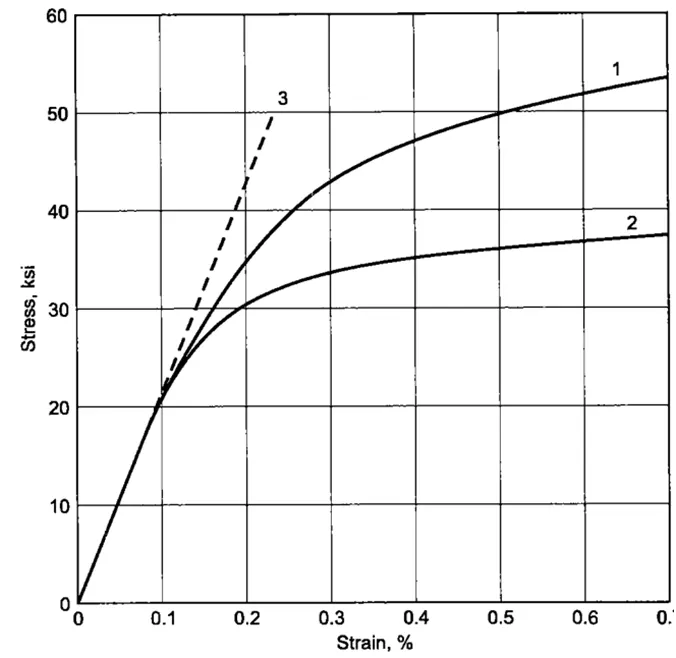
The experimental data values recorded from the experiment are plotted in the figure shown below. Material modeling and subsequent simulation have been carried using the curve no. 2.
Young’s modulus:
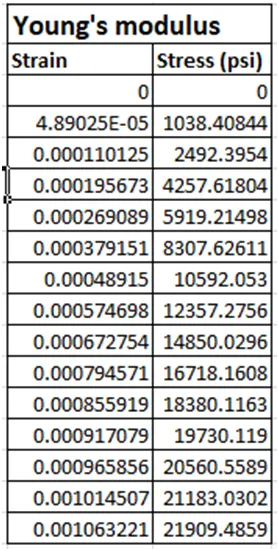
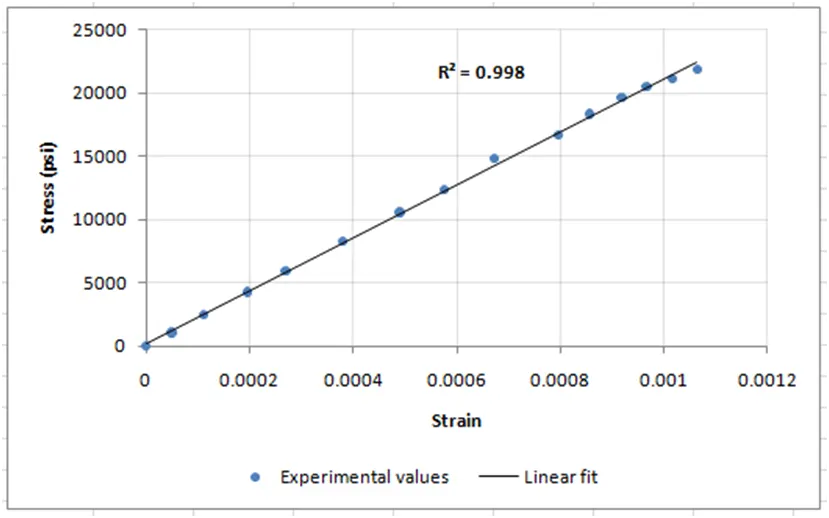
The data points were recorded by tracing the curve no. 2 using data digitiser tool. A total of 60 points were traced with concentration near the curve and the endpoints. A linear regression was performed on the linear part of the curve to determine the Young’s modulus. The value of Young’s modulus is the slope of the linear part of the curve.
The value of Young’s modulus is 20.96E6 psi.

The units used to record the data are in pound-inch-ft and need to be converted to kg-mm-ms,
the stress values need to be multiplied by a factor of 1/145038.
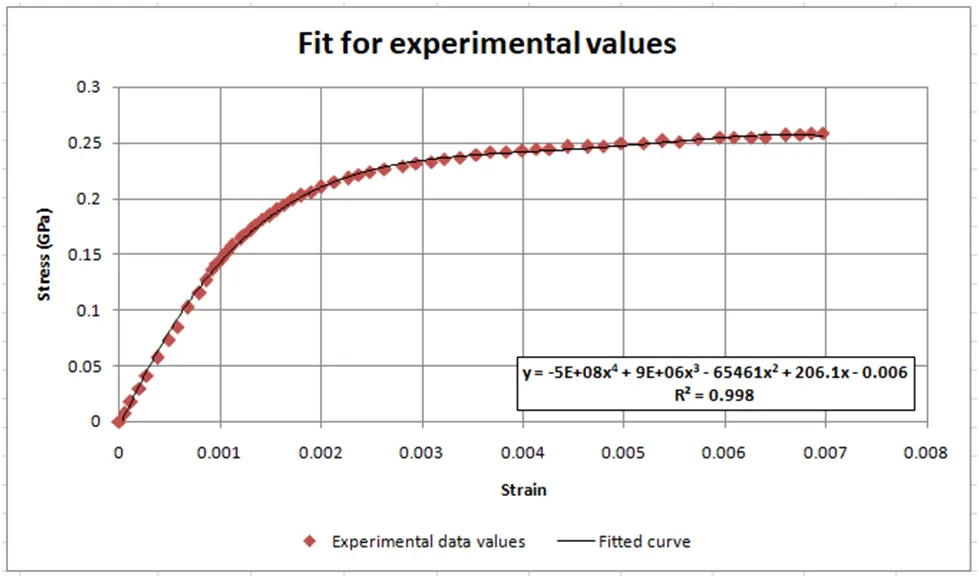
Polynomial fit of fourth order is used to fit the data. The equation of the fitted curve being

The R-square value of 0.9988 is achieved which is good measure of fit.
Yield Stress(SIGY):
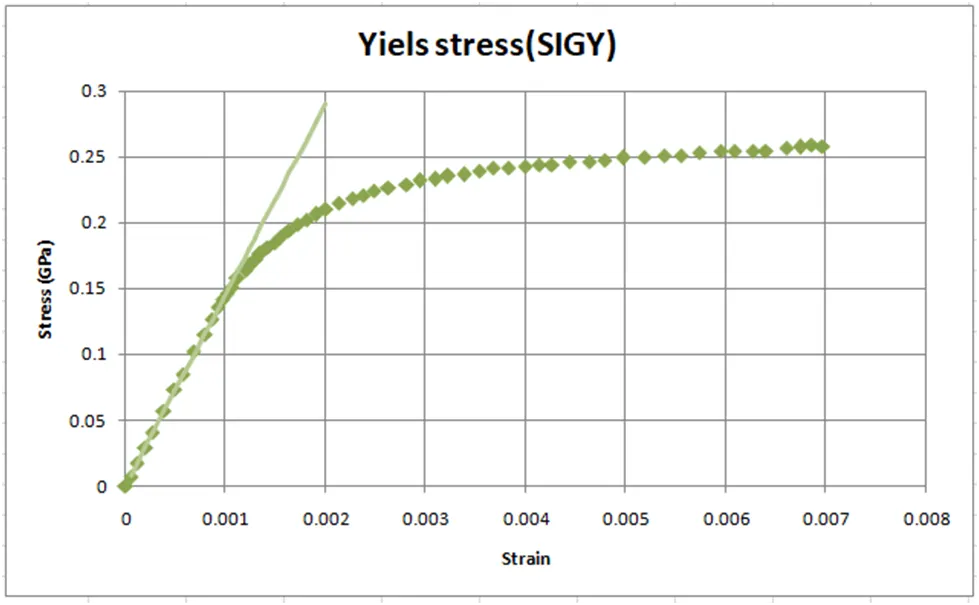
Yield stress (SIGY) is point beyond which the strains induced cannot be reversed i.e. strains become plastic. From visual inspection of the graph of linear part of the curve and the data points beyond the linear curve, we can arrive at the yield stress as the point beyond which the stress values deviates from the linear part suggesting that plastic strains being induced in the specimen. The value of yield stress is determined to be 0.158 GPa.
To create the material card in LS Dyna, the true strain and stress values are to be used. Hence, the fitted values are converted to true stress and effective plastic strain by using the following formulae:
True strain = ln(1+ Engineering strain)
True stress = Engineering stress(1+Engineering strain)
Effective plastic strain = True strain – (true stress/Young’s modulus)
The converted true stress and strain values are saved in .csv format to load in the LS Dyna material card.
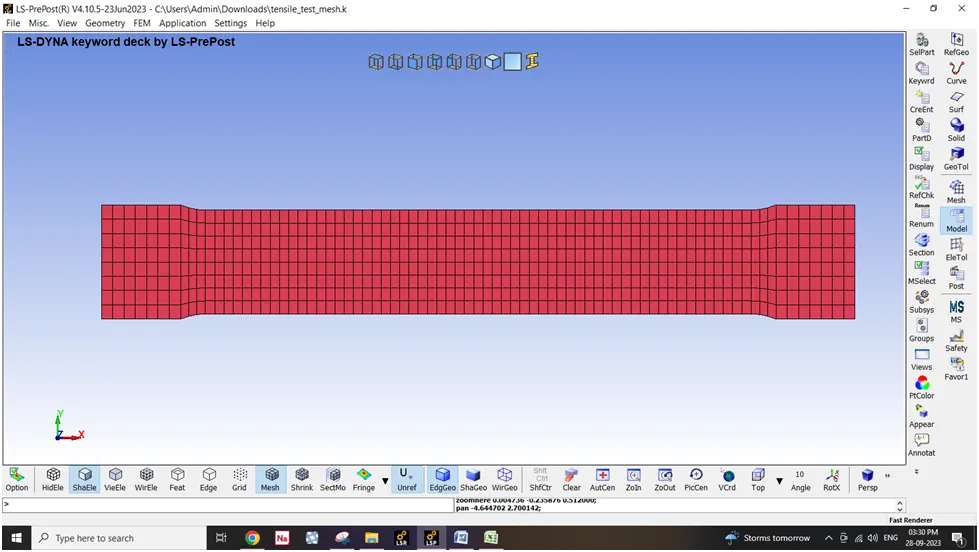
The input file consists of a dogbone test specimen.
SECTION
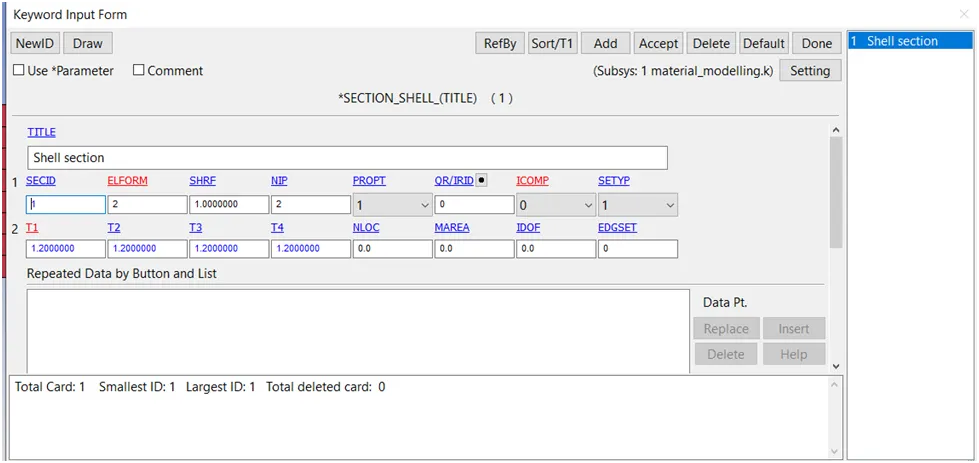
A SECTION_SHELL keyword is defined with shell thickness of 1.2 mm with default element formulation.
MATERIAL PROPERTIES:
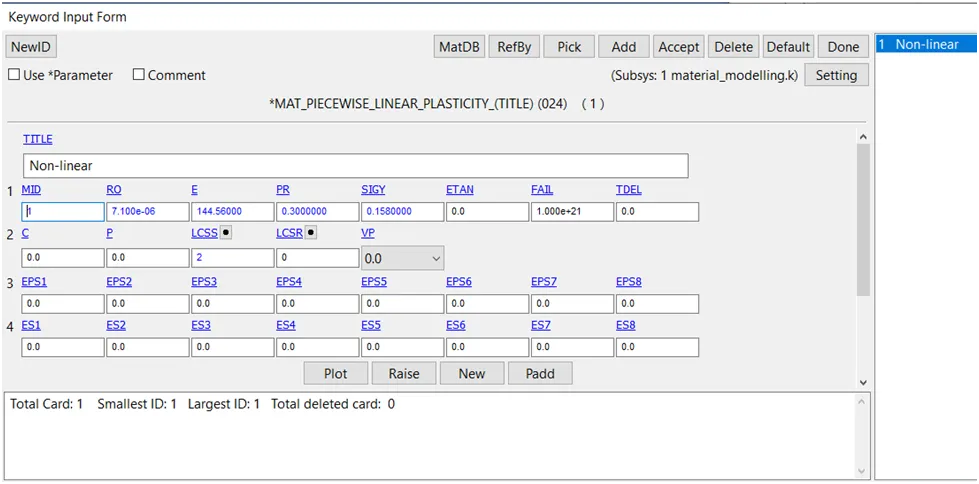
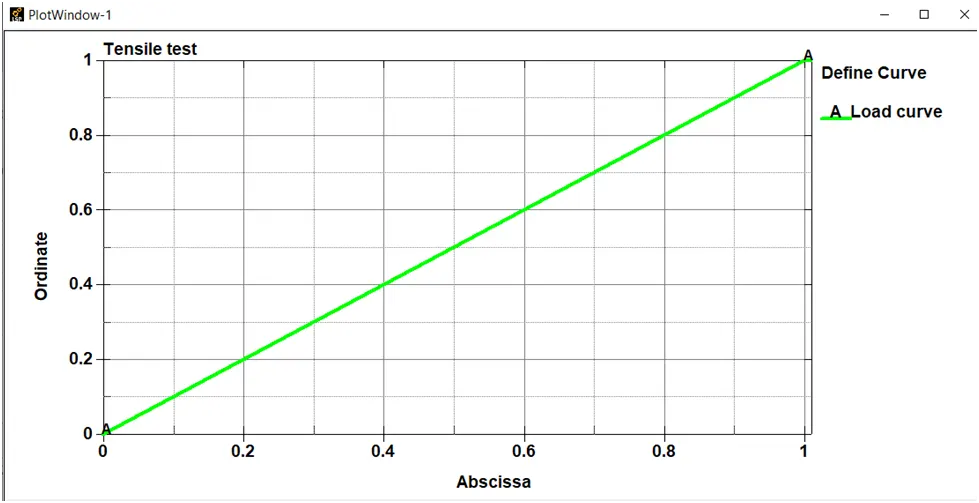
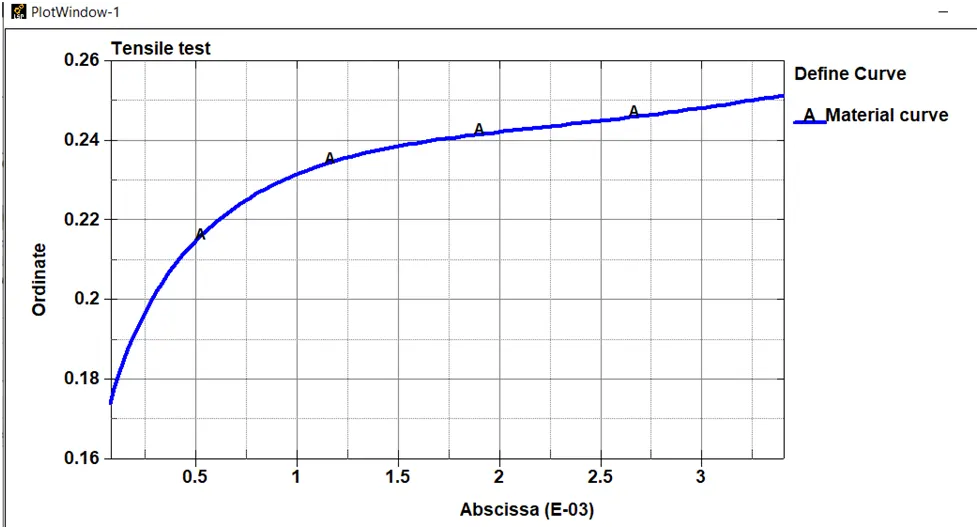
The stress strain curve fitted earlier is input in the material card creation. A curve is defined to load the stress-strain values.
The values of Young’s modulus(E) and Yield stress(SIGY) as obtained from the graph and hence visual inspection are input in the keyword form.
The values beyond the yield point are converted into true stress and effective plastic strain as required/accepted by LS Dyna solver in the form of load curve (defined by id 2).
MAT_PIECEWISE_LINEAR_PLASTICITY
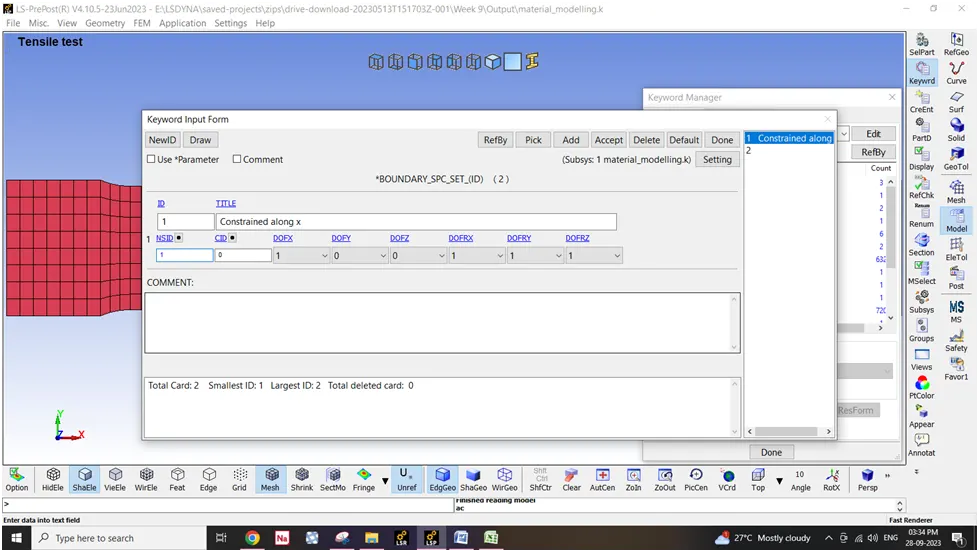
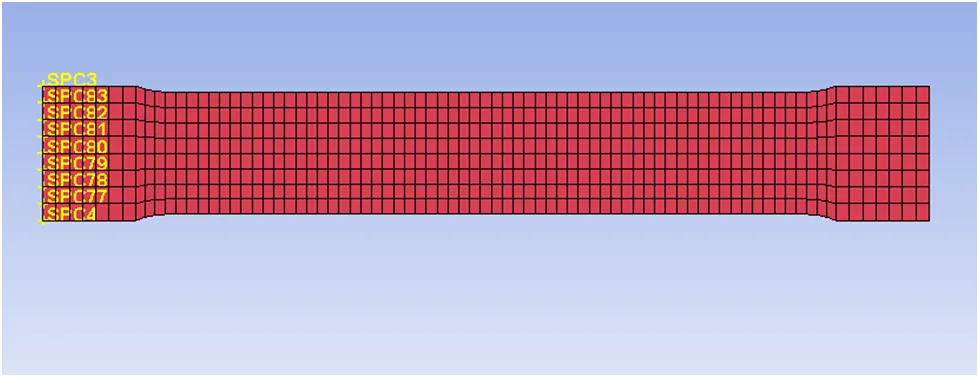
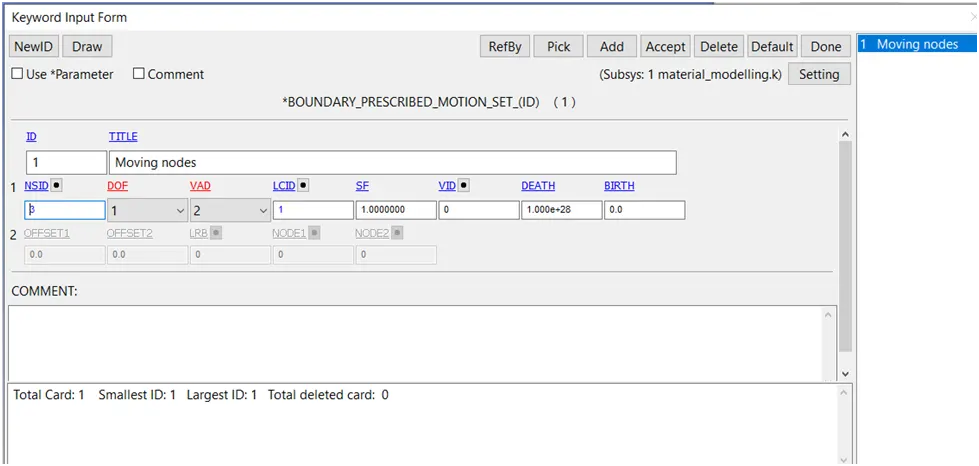
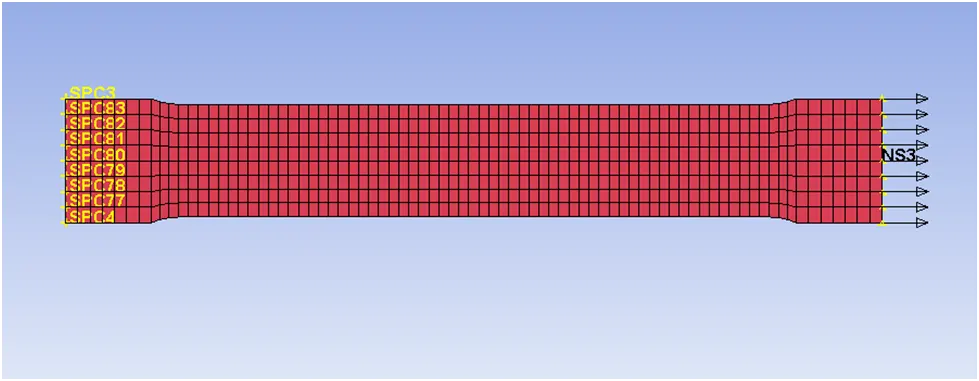
BOUNDARY CONDTION:
CONTROL:
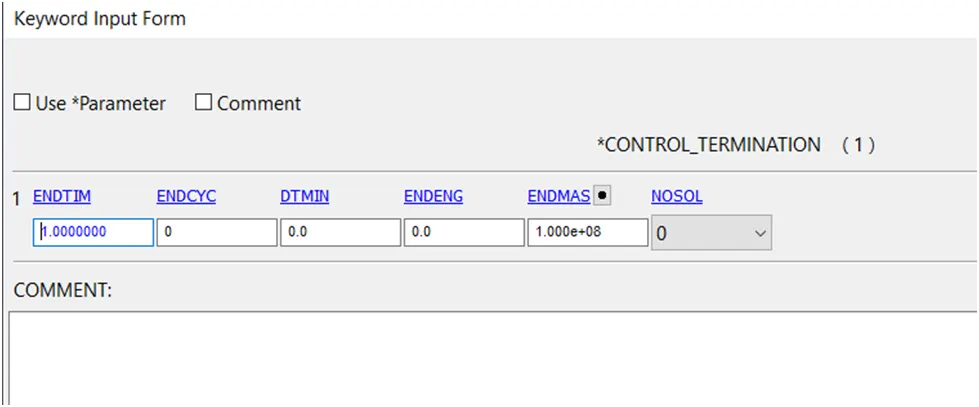
A CONTROL_TERMINATION card is created to denote the endtime of the simulation.
DATABASE:
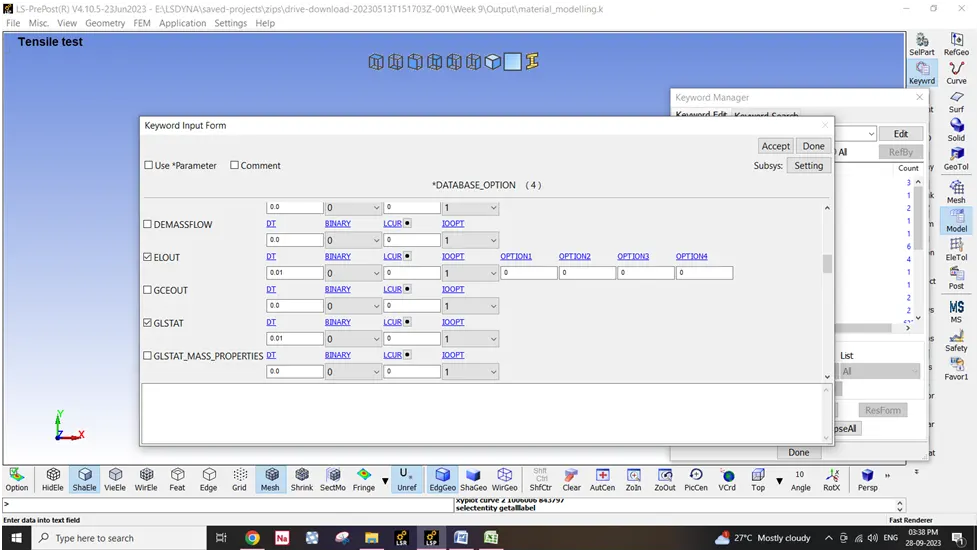
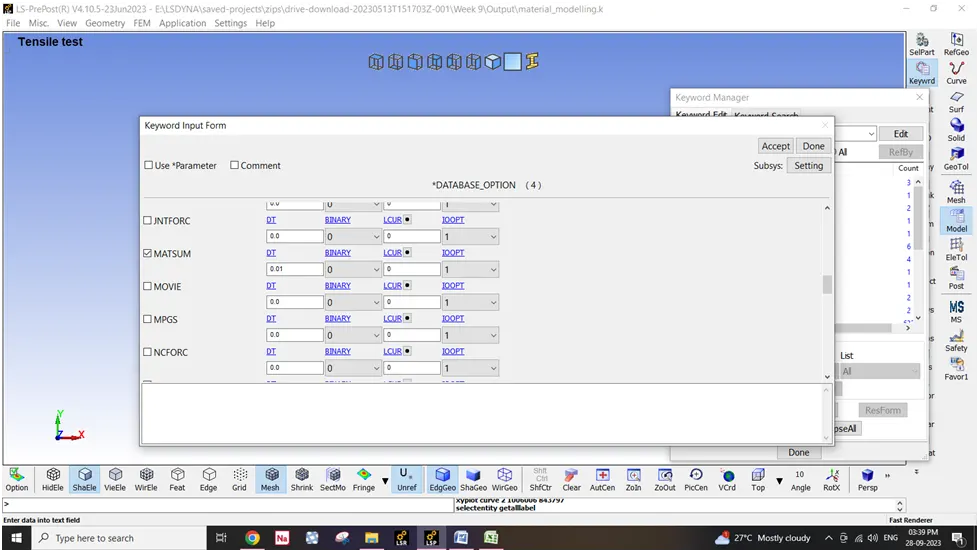
ASCII plots for a time interval of DT 0.01 is used to plot the plastic strain vs stress for certain elements.
To get the strain values through the simulation, the STRFLG is toggled to 1 from EXENT_BINARY keyword.
RESULTS
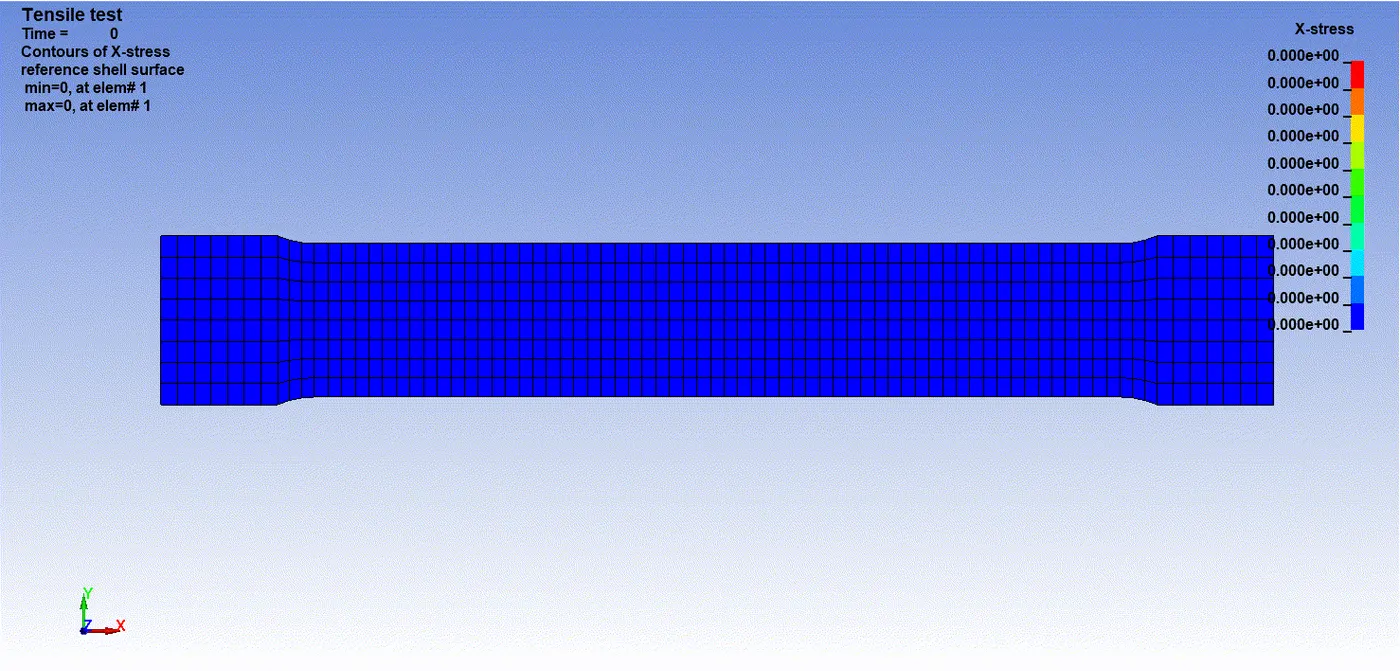
stress
strain
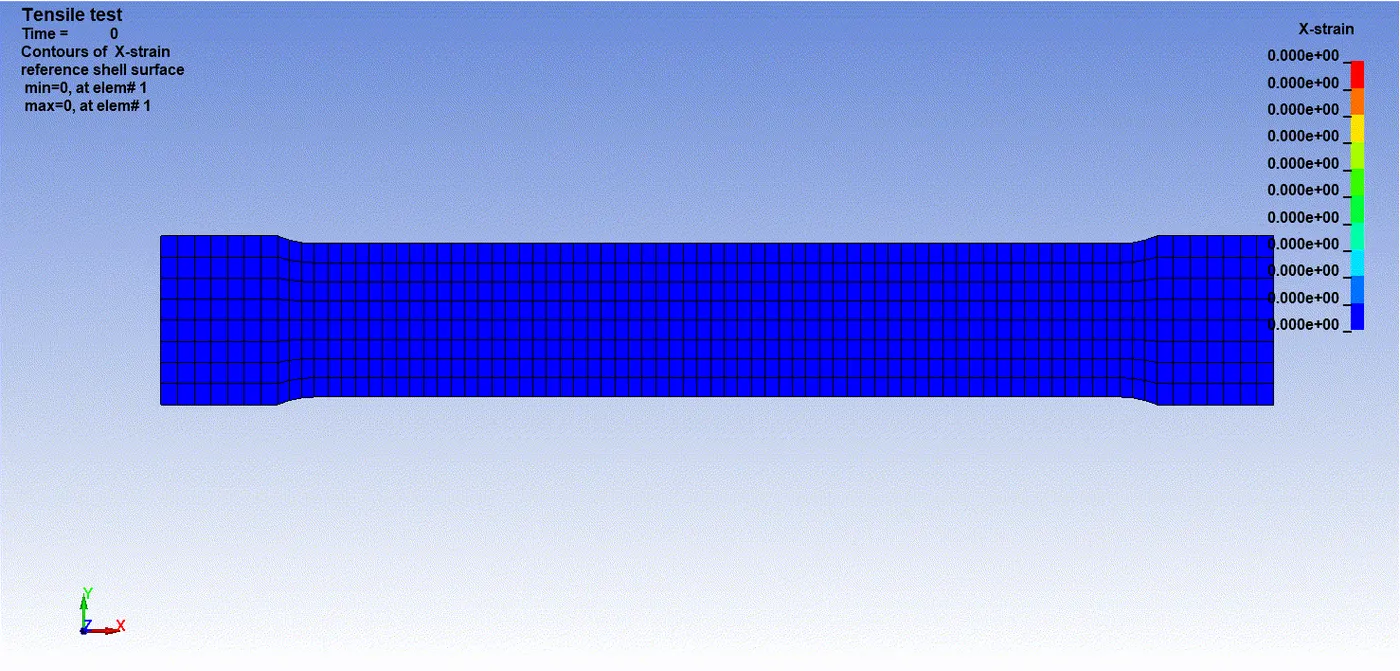
For comparing the true stress and effective plastic strain among the experimental and simulated data, a group of elements are selected (in the middle portion of the specimen) and the values are averaged over.
COMPARISON
The graph presented here is the comparison experimental data with fourth order polynomial fit and data from the test simulation beyond the yield point. However there is point after which the true values of fitted data decreases with increasing strain due to nature of polynomial fit. The values with negative slope have been avoided to ensure stability during solve.
CONCLUSION:
Data values are extracted from the curve provided. Young’s modulus was determined by using linear part of the curve. A polynomial fit of 4th order was used to derive the co-efficients and intercept. Yield stress was determined by visual inspection as the material is brittle in nature with non-significant yield behaviour to be 0.158 GPa. Tensile tests were conducted by creating a MAT_24 Piecewise linear plasticity card. Effective plastic strain vs stress of experimental data and tensile test results were compared and found to be in good agreement.