Week - 9 Material Modeling from Raw Data
Tension Test on Dog Bone Specimen -
Model considered for analysis -
Dog Bone Specimen
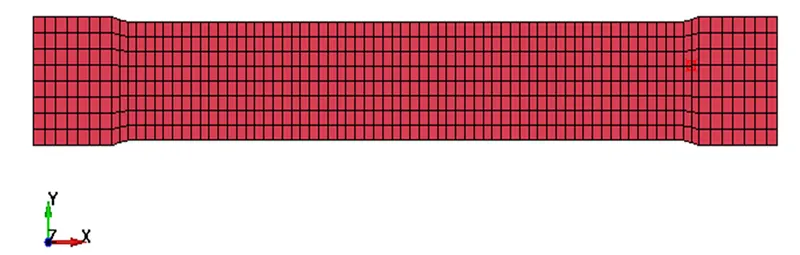
Inputs -
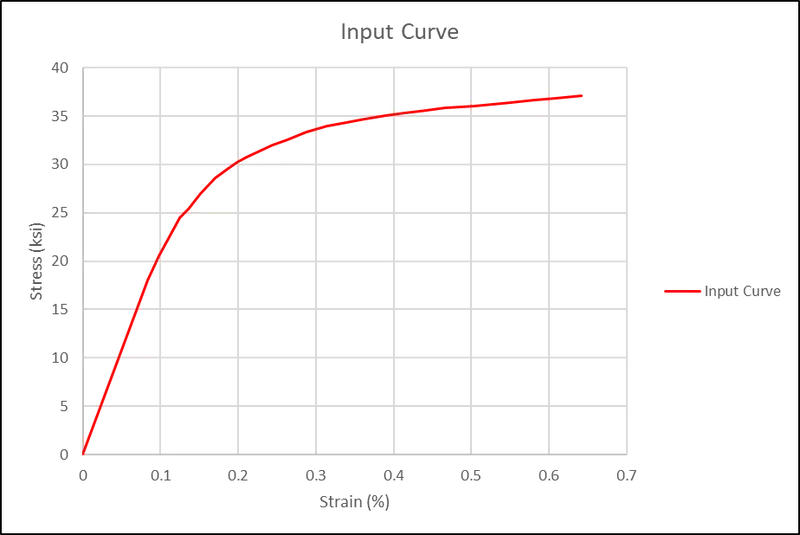
Curve from Input provided was considered and data points were extracted for Curve 2 using Data Digitizer.
Unit conversion for Stress from ksi to GPa
Strain converted from % to mm/mm
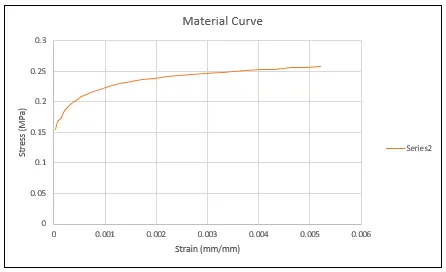
Effective Plastic Strain = Total Strain – Elastic Strain (Where, Elastic Strain = True Stress/Youngs Modulus)
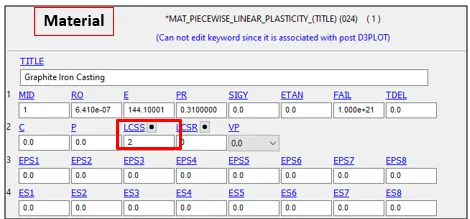
The value of True Stress and EPS is given as input in Material Card
Case Setup -
Units System considered – Kg-mm-ms
Elastic material with properties –
Graphite Iron Casting
RO = 6.410e-07 Kg/mm3
PR = 0.31
E = 144.10001 GPa
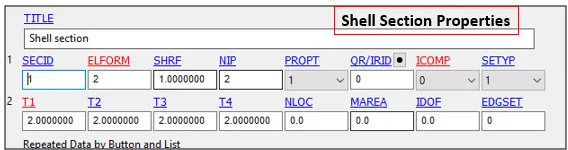
Section –
Shell Properties with
ELFORM=2
Thickness = 2 mm
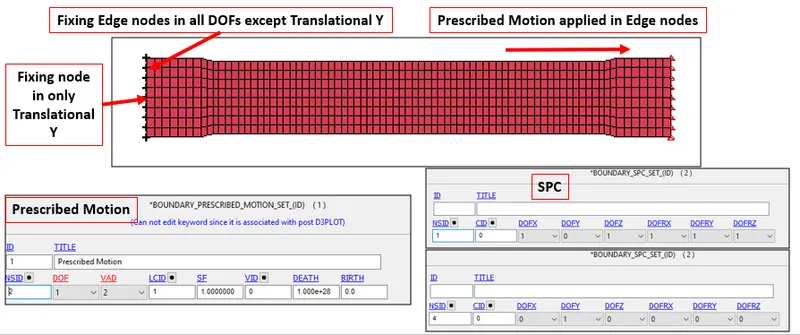
Boundary Conditions -
Units System considered – Kg-mm-ms
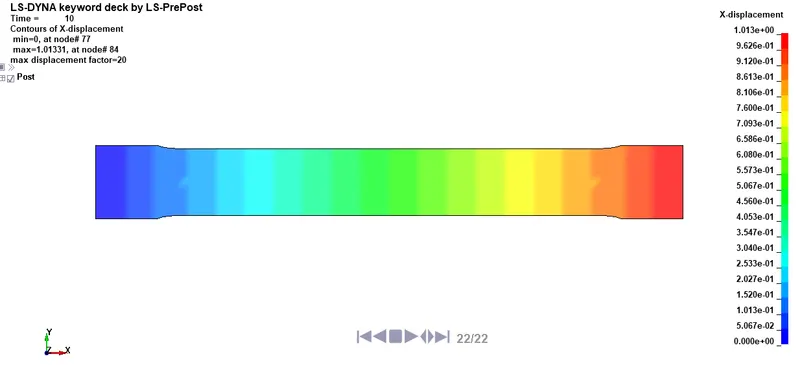
Prescribed Motion = 1.0133 in X Direction
Strain = Extension/Original length or Extension = Strain X Original Length = 0.006988 X 145 = 1.0133
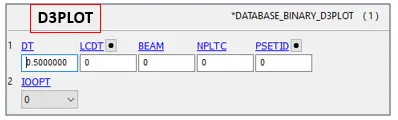
Output Requests -
Control termination – 10 ms
Output Requests –
Database > Binary D3PLOT at DT 0.5 ms
Database > ASCII option – GLSTAT AT DT= 0.5 ms

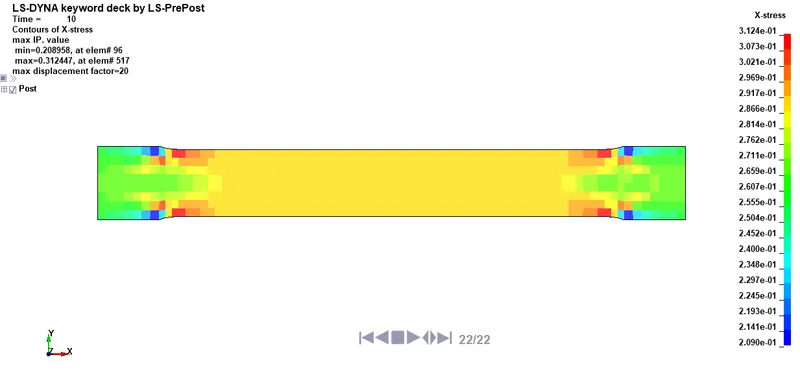
X Stress Plot (GPa) -
Max stress = 312.4 MPa
X Deformation (mm) -
Stress vs Strain Plot -
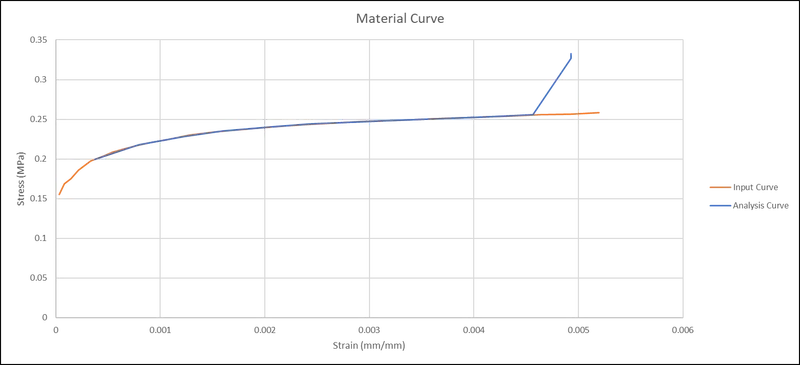
Comparison b/w Stress vs Strain graphs for Input Curve and Curve extracted on an element after analysis
Conclusion -
On comparison the curve obtained from analysis on dogbone specimen follows similar trend as Input curve. Hence material properties considered for Inputs are validated.