Week - 9 Material Modeling from Raw Data
Aim:
The Aim of this Challenge is to extract the data from the given curve and Findout the Youngs Modulus, Yield strength of the Specimen under test and model the same using LS-Dyna.
Chapter-1 MATERIAL MODELLLING_EXCEL:
The following steps are followed inorder to find out the Young's modulus of material under test.
1.1 Extract Raw Data from the Image
1.2 Perform Necessary Unit Changes
1.3 Young's Modulus Identification
1.4 Yield Strength Identification
1.5 True Stress-Strain Curve Creation
1.6 Identification of Proportional Limit
1.7 Modelling of Plastic Curve
1.1 Extract Raw Data from Image:
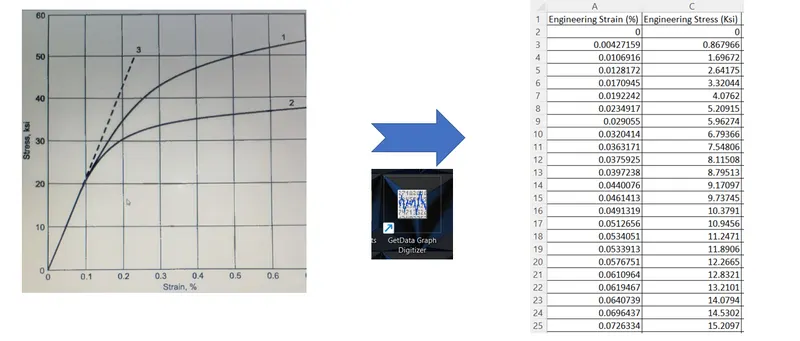
1. The Raw data is extracted from the given image using Get data digitalizer, The Raw Data is imported to Excel for Processing. 104 Data points are created
1.2 Perform Necessary Unit Changes
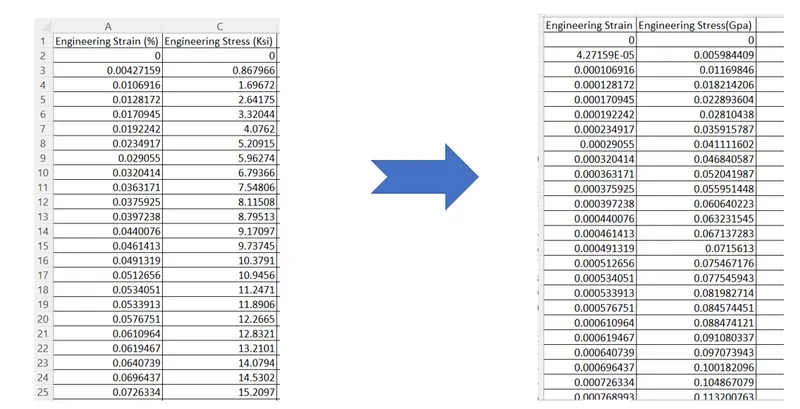
The Engineering strain in % is coverted to absolute value of strain by multiplying by 100 and the Stress in Ksi is converted to Gpa.
1.3 Young's Modulus & Yield Strength Identification
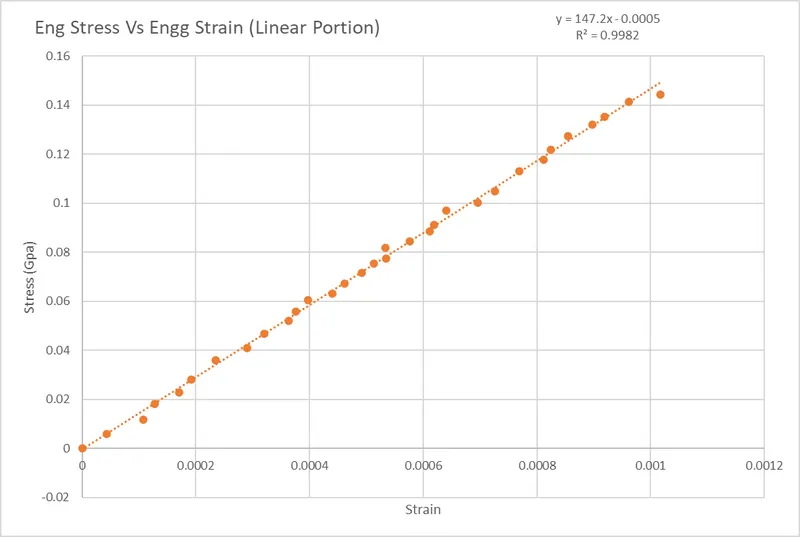
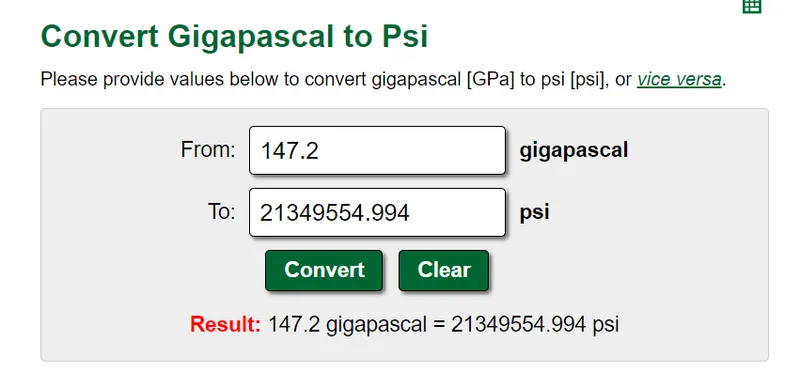
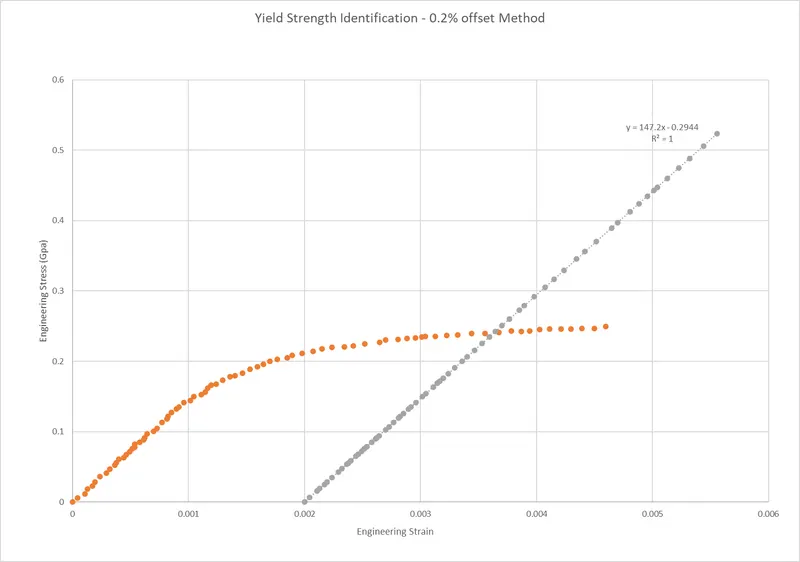
From the given input curve Image, the Curve is found to be linear within 0.1% Strain, Hence the Linear Portion of the Curve within the 0.1% Strain is plotted in form of graph and the linear regression analysis is performed. The Linear Regression Equation found to be y=147.2x-0.0005, Which when Compared to Y=mx+C which tells us that 147.2Gpa is the Young's Modulus of the Material. The Regression Coefficient is 0.9982 which means the High Correlation exist between the Regression Equation and Data Points.
1.4 Yield Strength Identification:
There are Several Methods available to find the Yield strength of Material, One of the Method is 0.2% offset method. The Yield Strength of Material identified by 0.2% offset method is found to be 238Mpa.
1.5 True Stress - True Strain Curve Creation
The True Strain from the Engineering strain is calculated using the below formula,

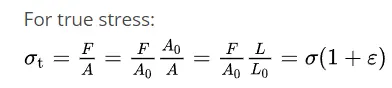
The True Stress is calculated from Engineering Stress & Engineering Strain by the below formula,
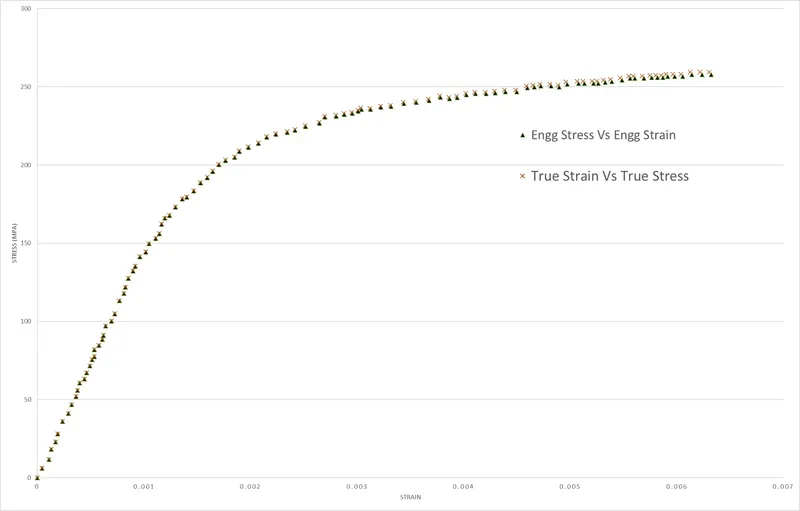
The Plot of Enginering Stress strain Curve and True Stress strain Curve is given below, and we can see that after that after the Yield the True stress becoming higher than engineering stress and become monotonically increasing curve.
1.6 Identification of Proportional Limit:
The Proportional Limit is the limit stress upto which we can relate the Stress and strain through Hooke's law. From the Engineering Stress strain as well as True stress strain curve we can see some datapoints follow a Linear relationship. Such data points are ploted in the graph and the proportional limit is identified. The Proportional limit is identified as 183 Mpa. Hence beyond 183 Mpa, the Material doesn't follow the Linear Hooke's law relationship and hence we need to model the plastic curve.
1.7 Modelling of Plastic Curve:
Since the proportional limit is identified, the uni-axial strain within the proportional limit is completely recoverable. The total strain or True strain is the sum of Elastic strain (recoverable) and Plastic Strain (Permanent Deformations).
The Recoverable Strain (Elastic Strain) is calculated as 183(Proportional Limit)/147.2 X10^3(Young's Modulus) = 0.00124.
The Effective Plastic Strain is calculated by subracting Elastic Strain (Recoverable Strain) from Total True Strain. The Values are ploted in graph and lograthmic regression analysis is performed to findout Relation. The Plot is attached as below. The Regression Coefficient Shows 99.5% correlation between lograthmic regression equation and datapoints
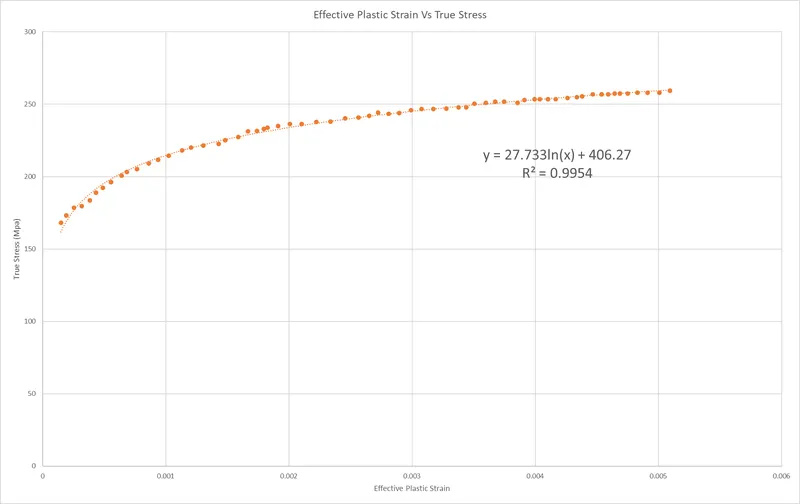
We have given two options to model the material of plastic curve. One is MAT18 and other is MAT24. MAT 18 is the Power law Plasticity which requires the factors called as K and N. Where K is called as Strength Coefficient and N is the hardening Exponent. In MAT 24 we have the option to specify the Plastic Part of the Curve interms of Effective Plastic Strain and True Stress. Since we got the Regression Equation for Effective Plastic Strain Vs True Stress, I am going to model the Tensile Stress simulation using MAT24. We can also find the Factors K & N using the Plastic Strain data and True stress.
CHAPTER-2 SIMULATION:
2.1 Simulation Setup:
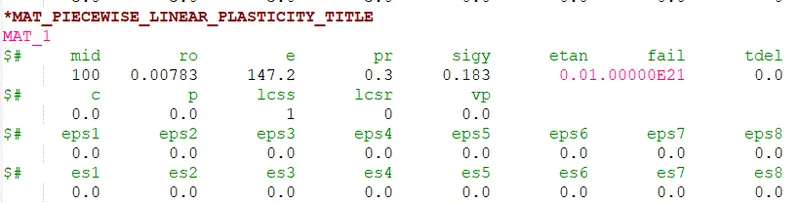
The Material Card is Created with Young's Modulus of 147.2Gpa with Proportional limit of 183Mpa The Effective Plastic Strain is modelled in LCSS Curve.
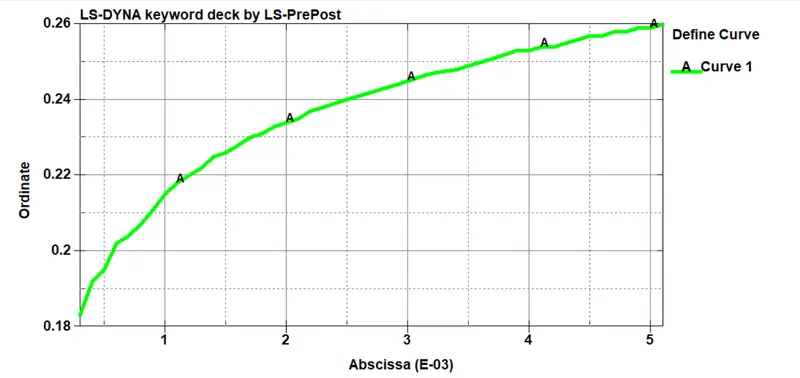
 Effective Plastic Strain Vs True Stress Curve is Defined using DEFINE_CURVE Keyword.
The Section ID is created with Element Formulation-2 with Shell Thickness of 5mm.

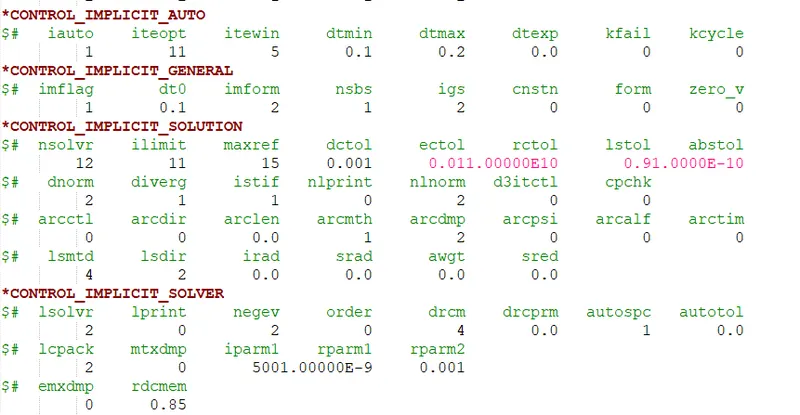
The Problem is solved by Implicit Method, the Implicit Settings are given below,
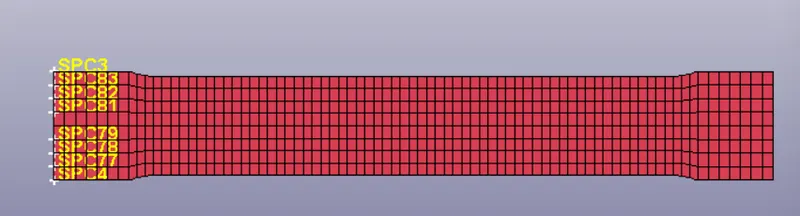
The Nodes shown below are constrained in all degrees of freedom except y degrees of freedom.

The Central Node is Constrained in all Degrees of Freedom.
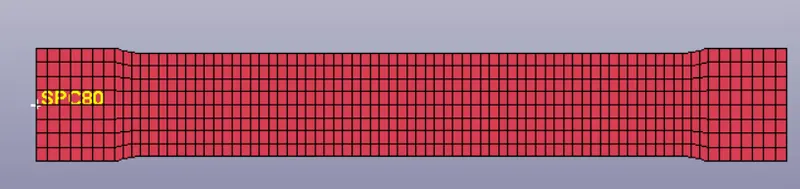
The Boundary Displacement is specified for following nodes (See Picture) using Curve-id-2 using DEFINE_CURVE Keyword.

The Total displacement Value specified is 0.87mm which means the Total Strain will be 0.6%. The Displacement is applied in steps, according to the Curve ID-2
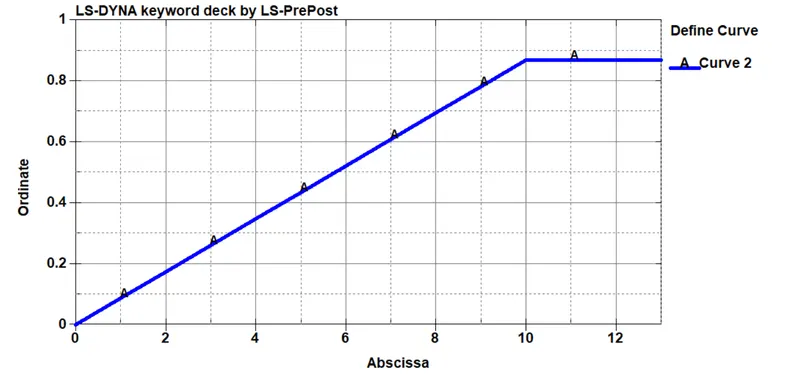
The Output Files requested are:
ASCII:
1. GL-STAT
2. EL_OUT for Elements 311, 319, 322, 330
Binary:
Binary d3plot
2.1 Simulation Results for MAT-24
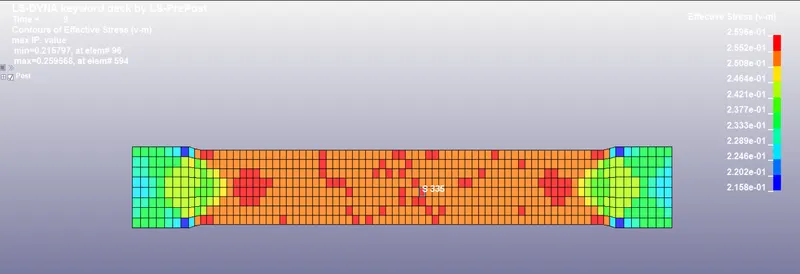
Vonmisses Stress Plot:
The X-stress Vs Time is plotted and there is no huge variation in stress value of Selected elements.
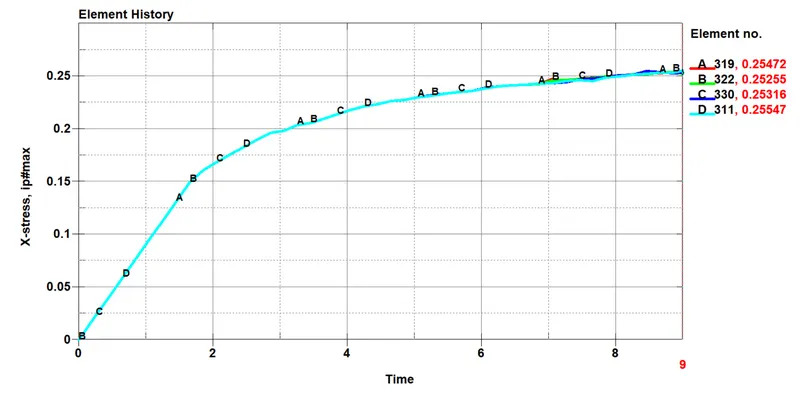
2.2 Simulation Validation:
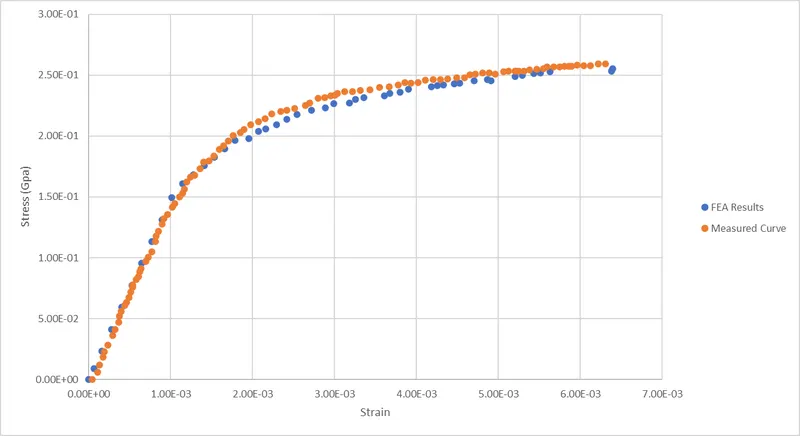
The simulated Results are found to be in close agreement with Expremental Results.
Conclusion:
The Material Modelling with Raw Data is Done and the Results are obtained.