Week - 9 Material Modeling from Raw Data
AIM :
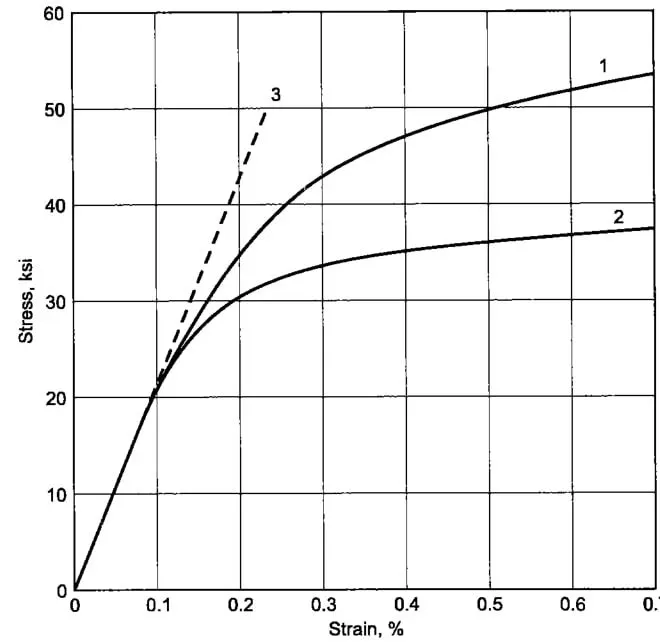
To use the stress-strain curve of graphite iron casting extract the data from the given diagram by using the data digitizer and material modelling MAT_024(PIECEWISE_LINEAR_PLASTICITY) card using the LS-Dyna.
PROCEDURE :
1. First import the stress and strain data from the stress-strain curve by using a data digitizer.
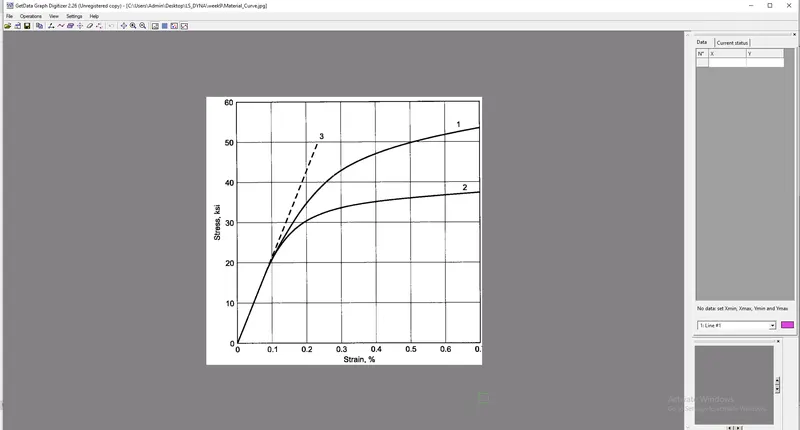
2. Import the Stress-strain curve image in the data digitizer as shown below.
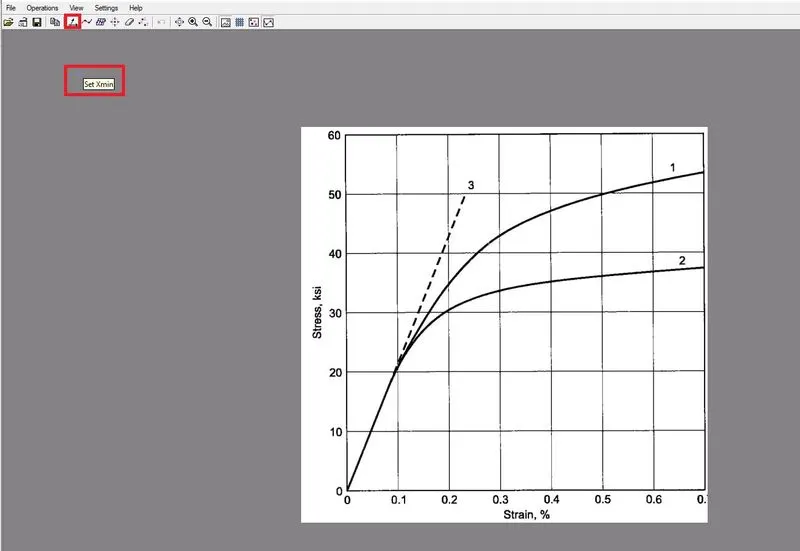
3. Next click on the set the scale it shows the set Xmin, where we want to Xmin select by using the cursor and enter the value is 0 as shown below.
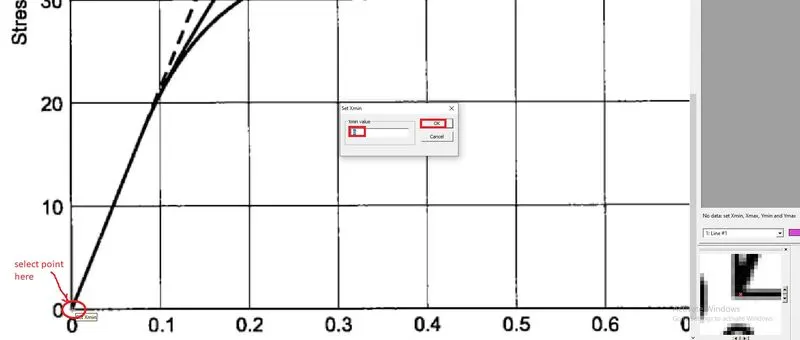
4. Click on ok next shows the set Xmax select X-axis maximum point and give the value 0.7.
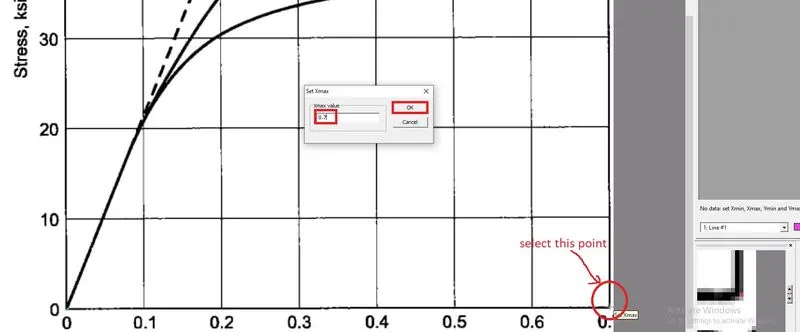
5. Next it is asking set Ymin to select the Ymin point and give the value is 0.
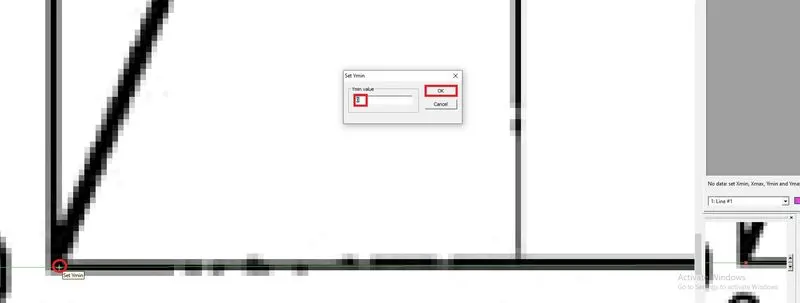
6. Next asking the set Ymax select the maximum point in Y-axis and give the value 60.
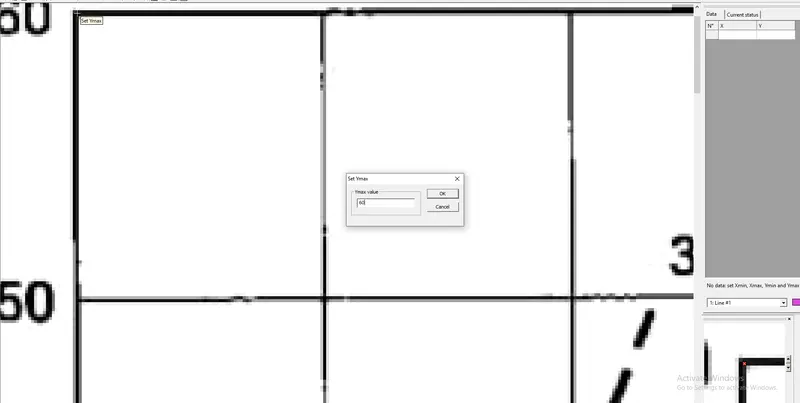
7. Next is shows the dialogue box and see the minimum and maximum values and click ok as shown below.
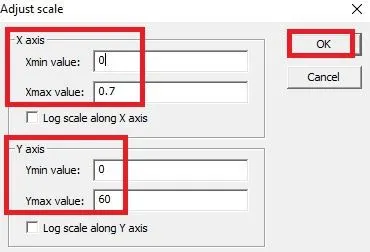
8. It shows X-axis is a green line and Y-axis is a blue line as shown below.
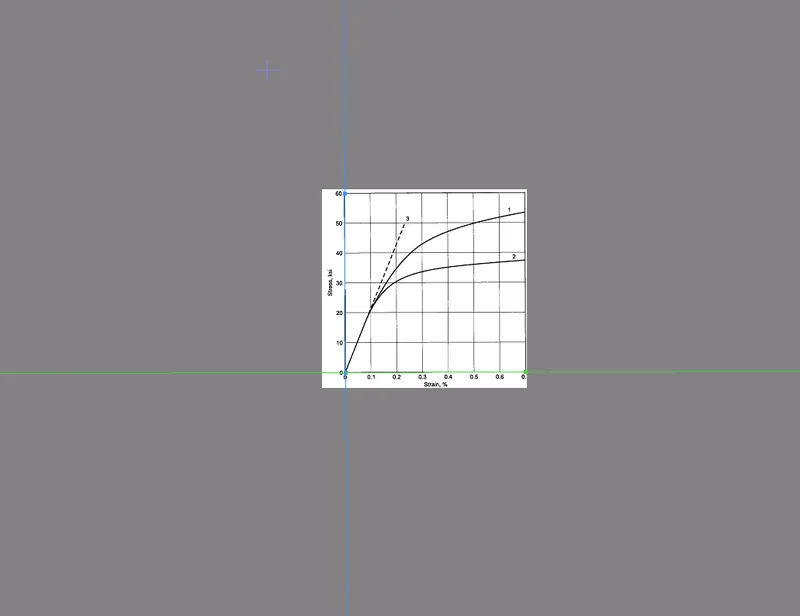
9. Next select the point capture mode and pick the points randomly along the curve path 2 as shown below.
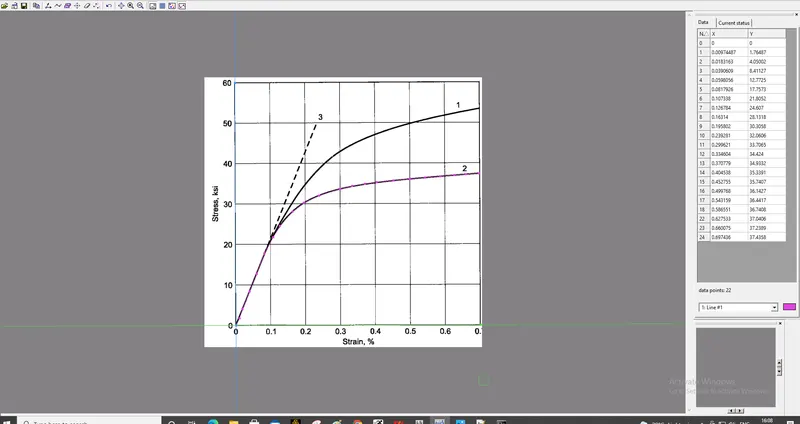
10. Next Export the data to Excel format and save the data.
11. Next open the file in Excel it shows the stress and strain values as shown below.
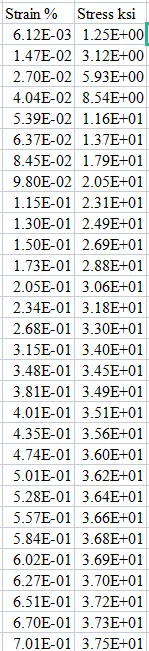
12. Here strain in percentage and stress in kilopound force per square inch (KSI) so convert the both values as shown below.
Strain % = 10^-2
Stress 1 ksi =0.00689476 Gpa
so we have multiplied the values for strain = strain % ×10^-2
For stress = stress (ksi) × 0.00689476
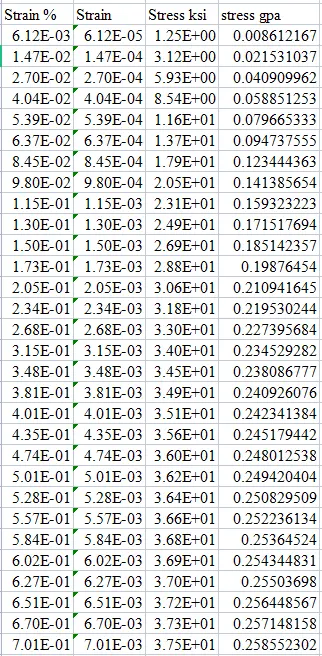
13. Next find the effective plastic strain as shown below.
Effective Plastic Strain = True strain - (True stress / Young's Modulus)
Here,
True stress = Stress
True strain = Strain
Young's Modulus E =20.9E+06 pound-force per square inch (PSI)
change the units of Young's modulus PSI to Gpa as shown below.
1 PSi = 6.894760002998144e-6 Gpa.
20.9E+06 PSI = 144.100427424 Gpa.
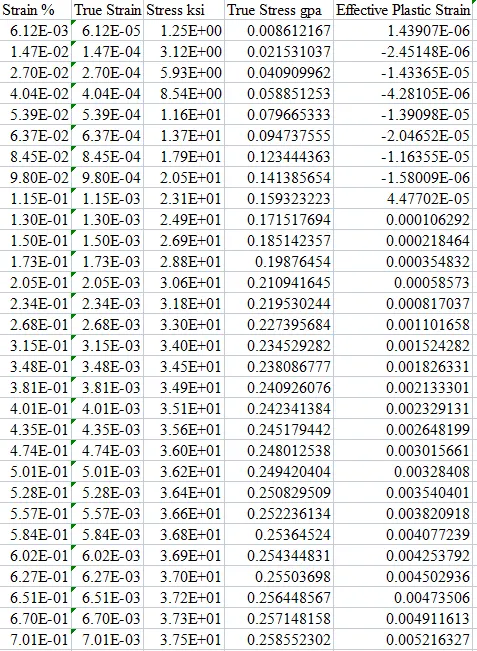
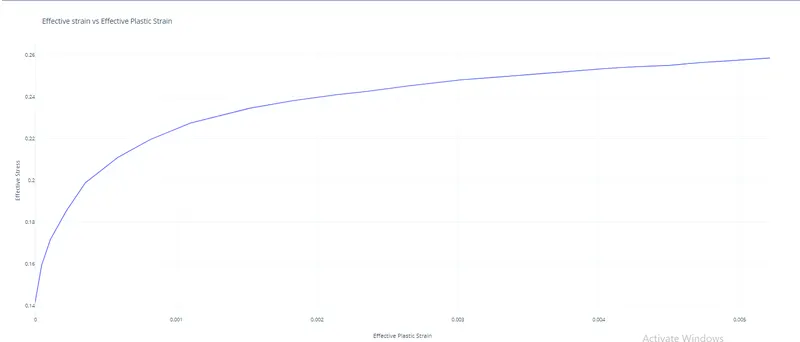
14. Plot the graph Effective stress vs Effective plastic strain. Here effective stress is nothing but True stress
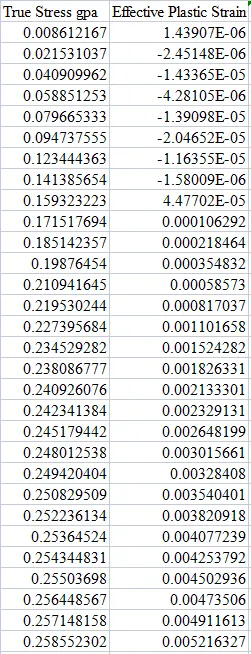
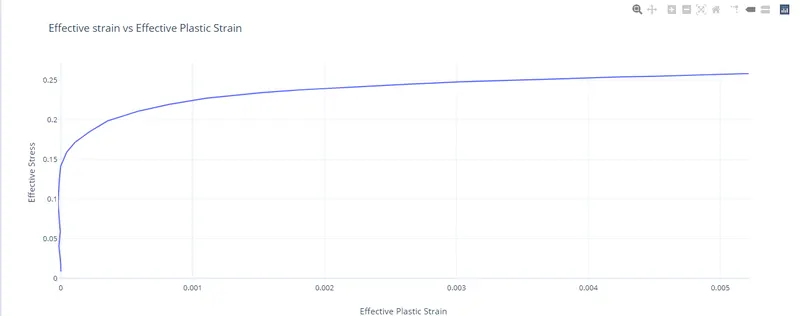
15. In the above image up to 0.14 it is linear above 0.14 it is non-linear so we have taken the values above 0.14 as shown below.
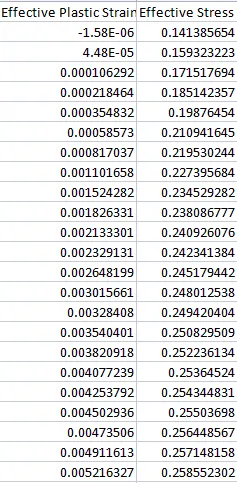
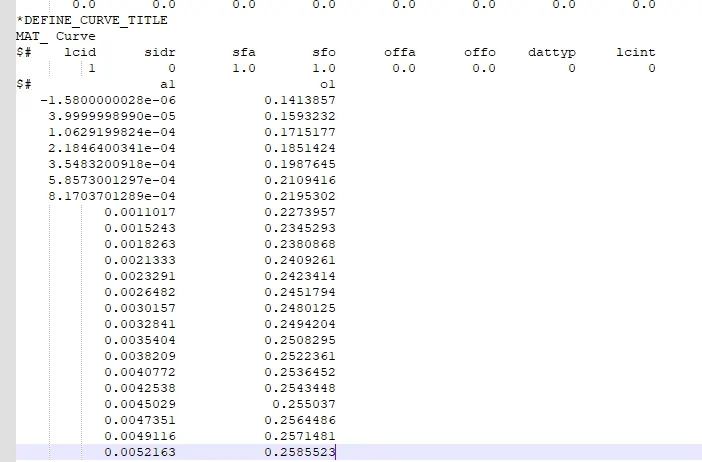
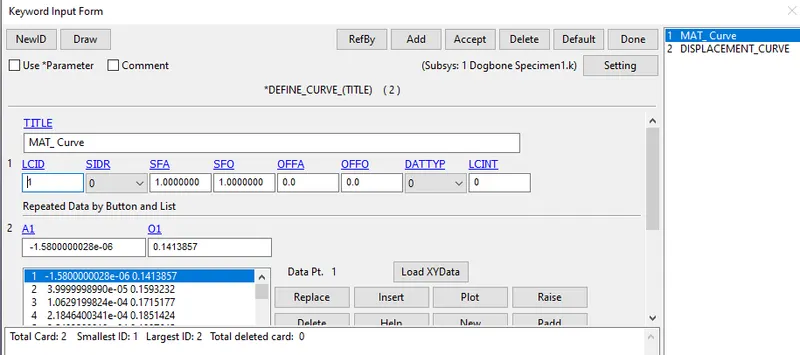
16. Next open the keyword file in note pad and assign the above values for the Mat_curve as shown below.
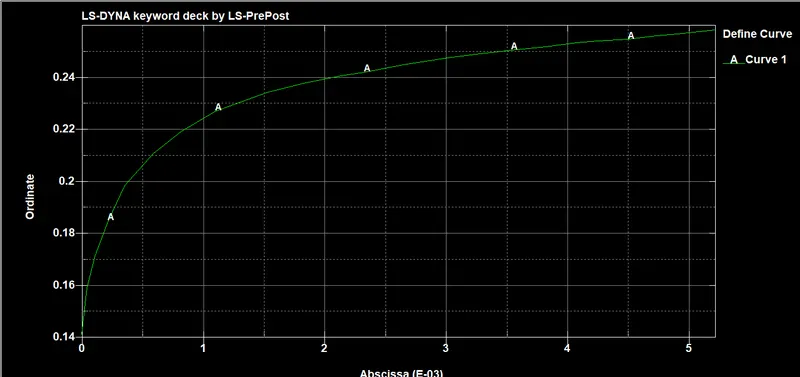
17. Next save the file and open it in LS-Pre post see the mat curve as shown below.
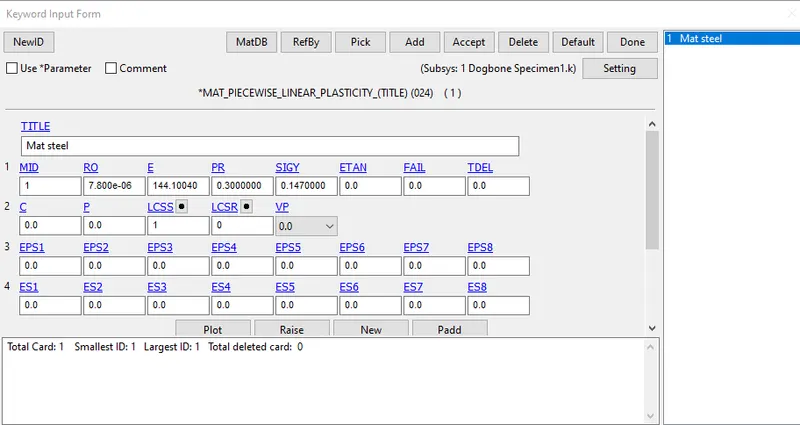
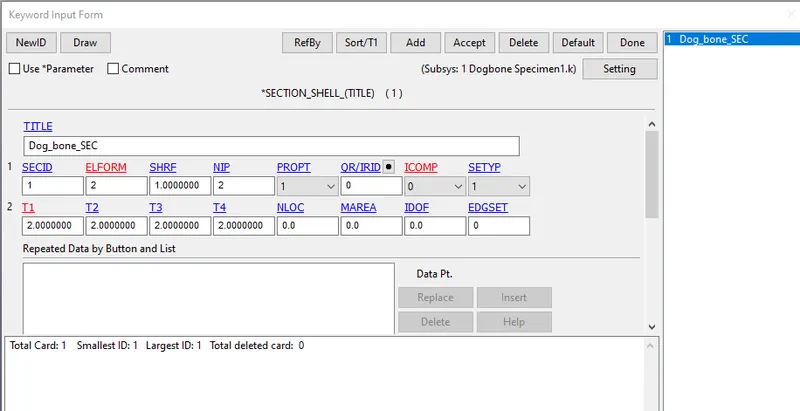
18. Next create the material 024 and section shell as shown below.
Material :
Section :
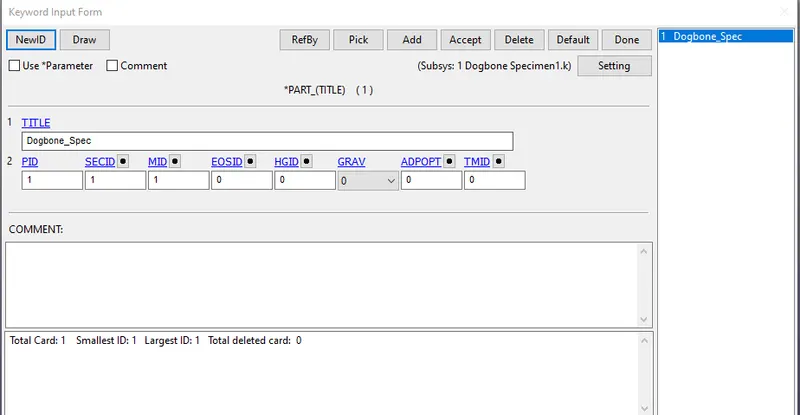
19. Assign the section and material for the dog bone as shown below.
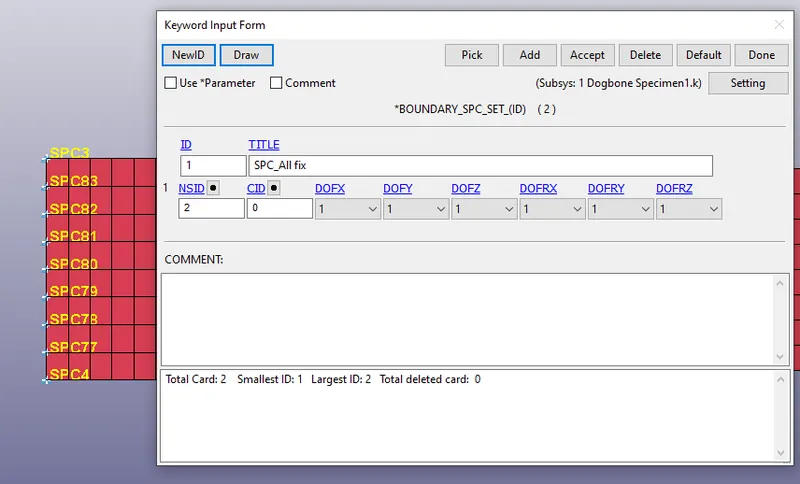
20. Next create the Boundary Conditions as shown below.
SPC set :
Spc constraint y :
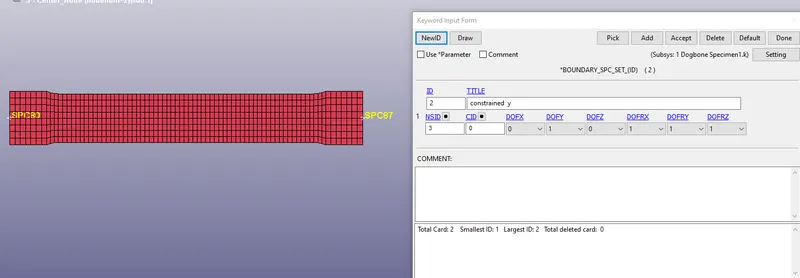
Prescribed Motion set :
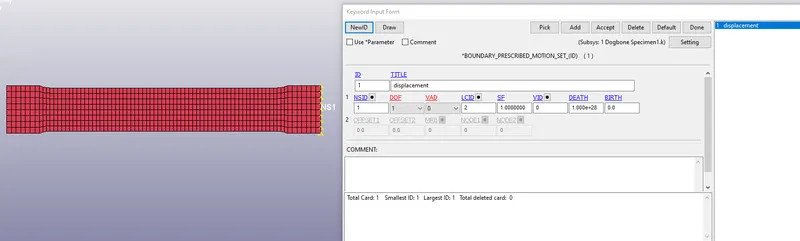
21. Create the curve for displacement as shown below.
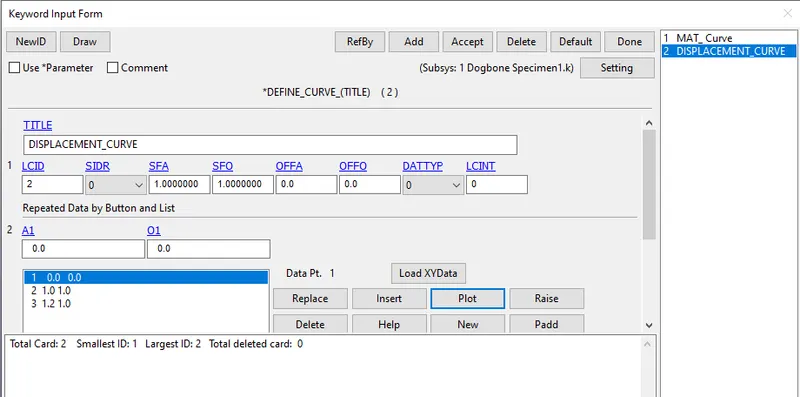
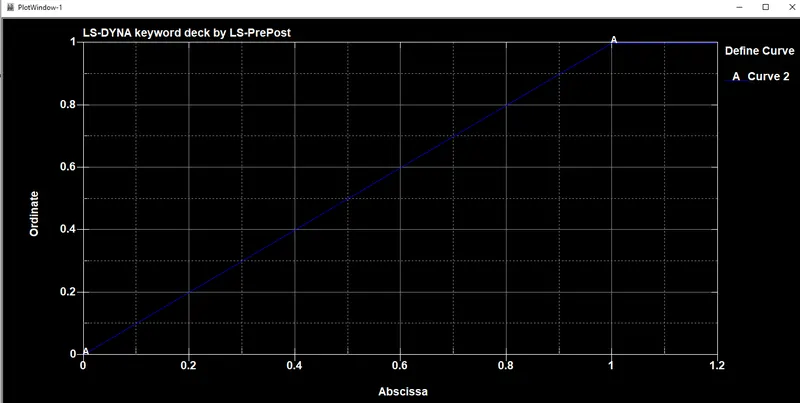
22. Assign the displacement curve to the Prescribed Motion set as shown below.
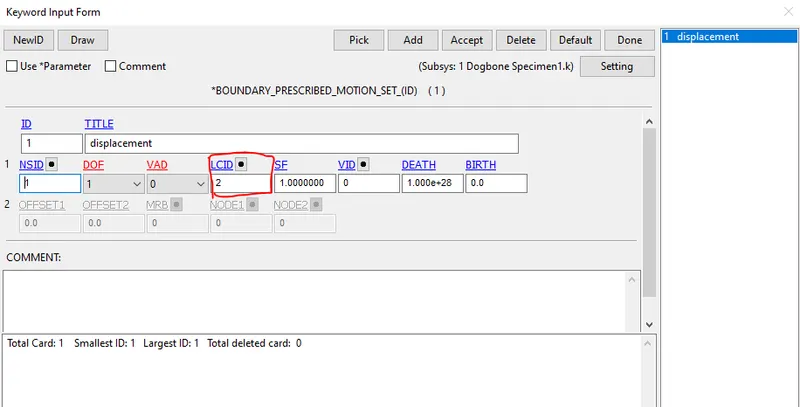
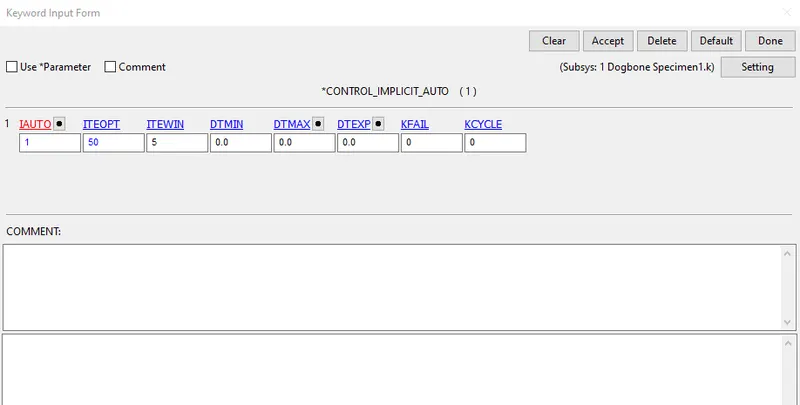
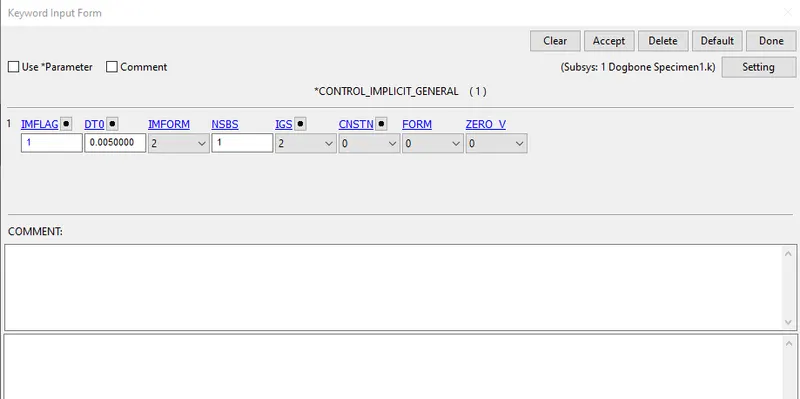
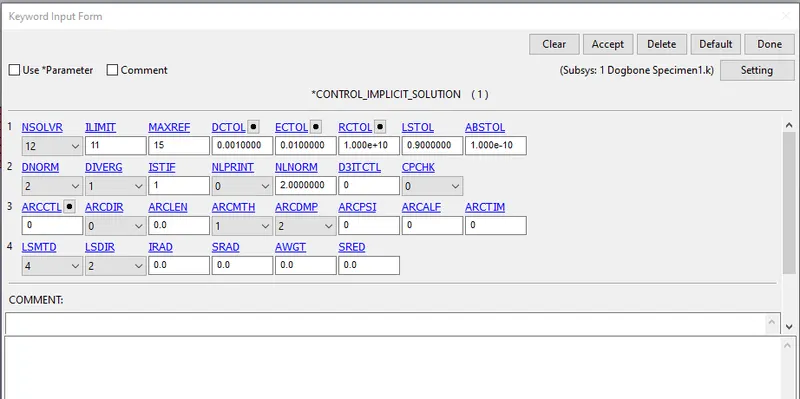
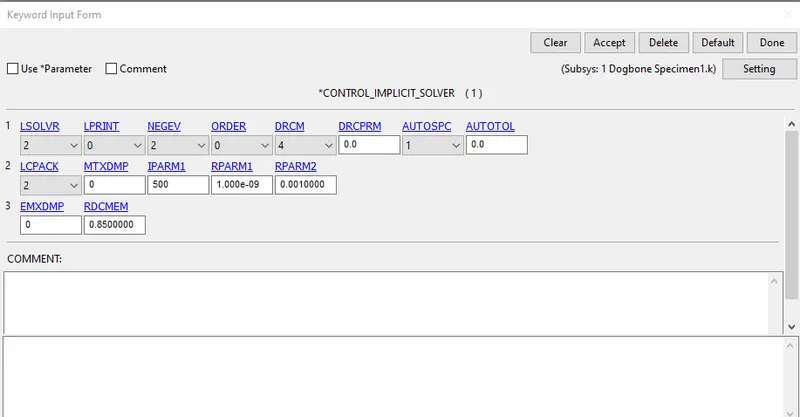
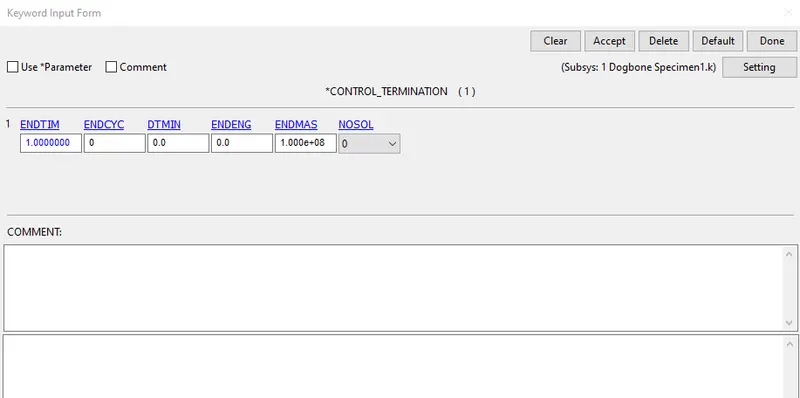
23. Next create controls as shown below.
Implicit_Auto
Implicit_General
Implicit_solution
Implicit_solver
Termination
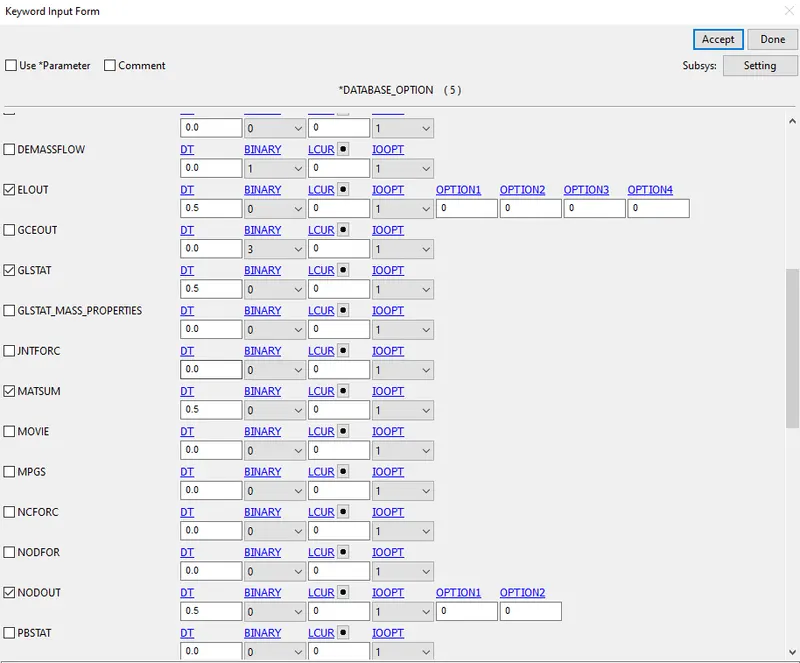
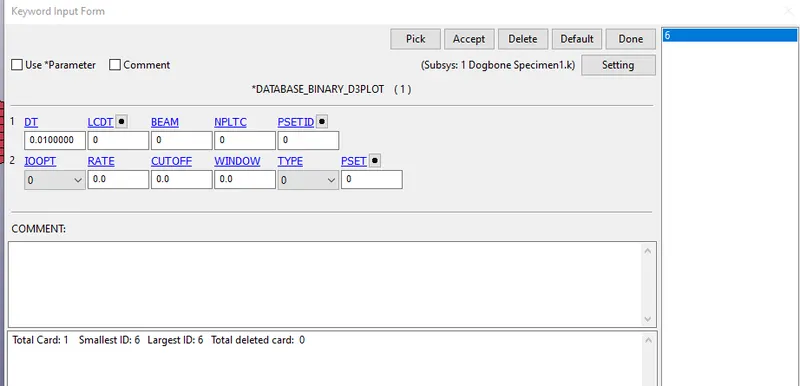
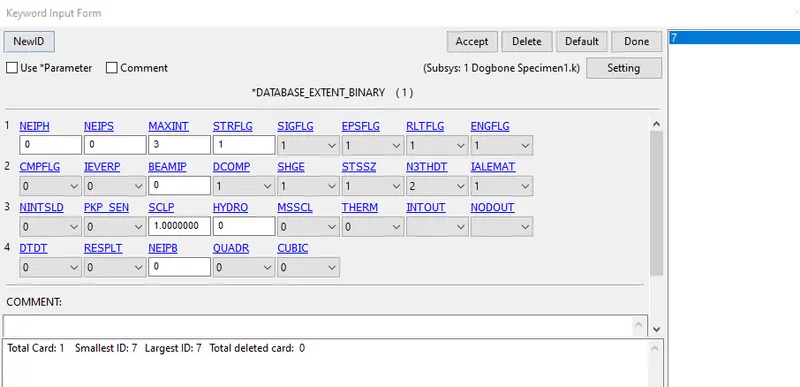
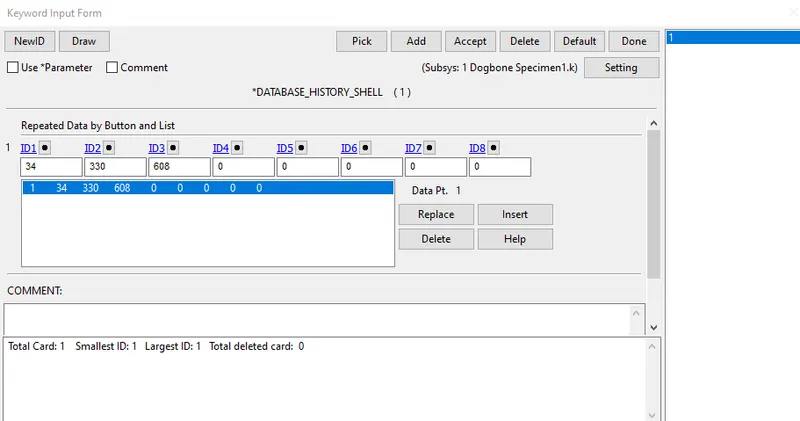
24. Create Database cards as shown below.
ASCII_options give the outputs ELOUT,GLSTAT,MATSUM,NODOUT,RCFORC,SWFORC and SPCFORCE
Binary_D3plot
Extent Binary
History Shell
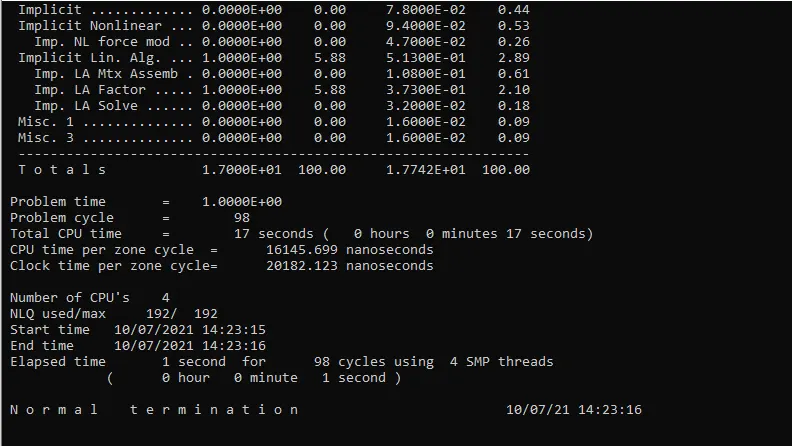
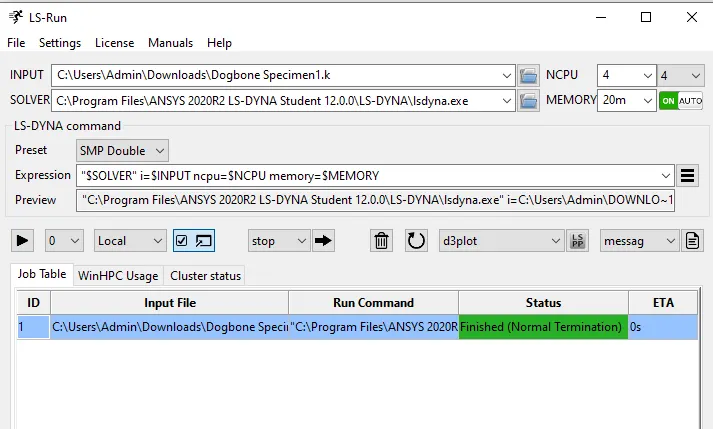
25. Save the keyword file and run the simulation in LS-Run.
26. Next open the d3plot in LS-Pre post as shown below.
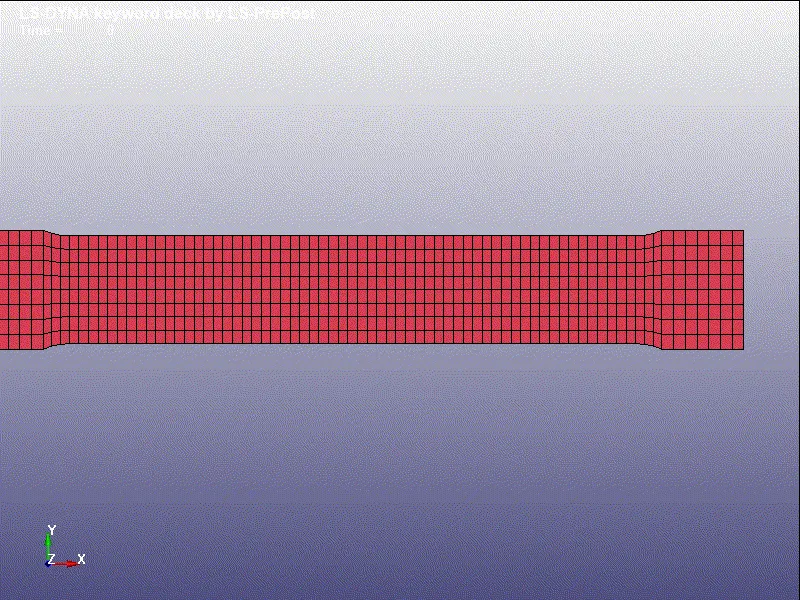
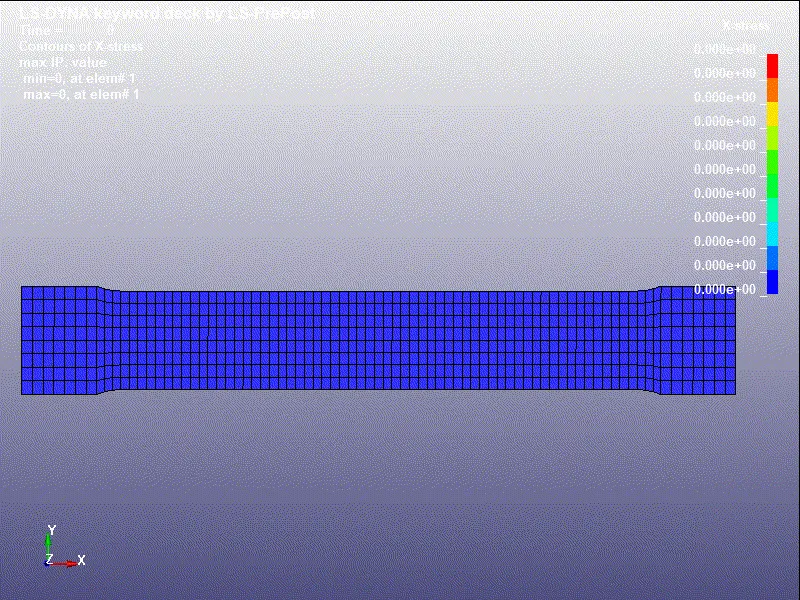
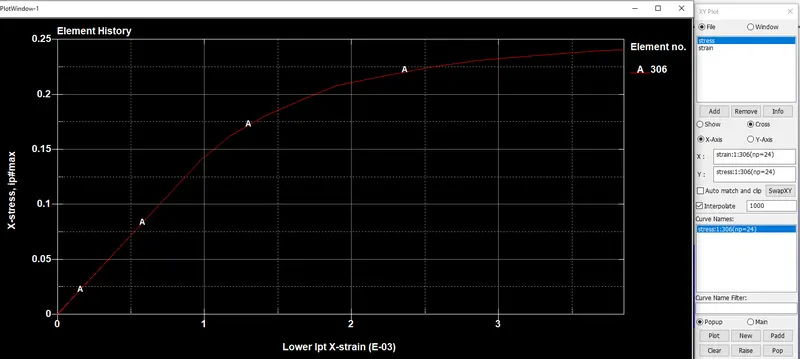
STRESS :
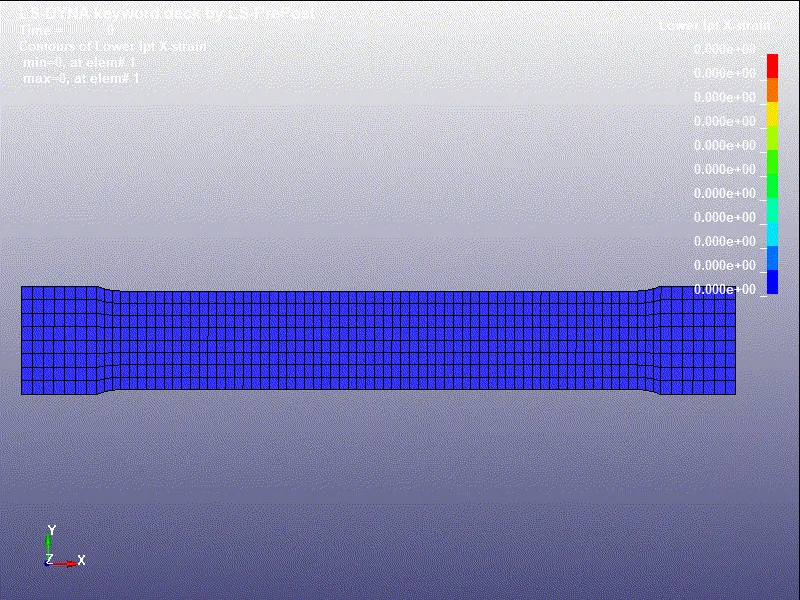
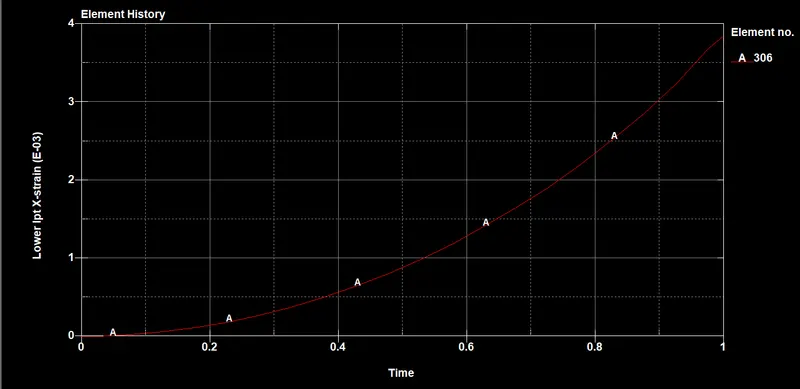
STRAIN :
Effective Stress Graph :
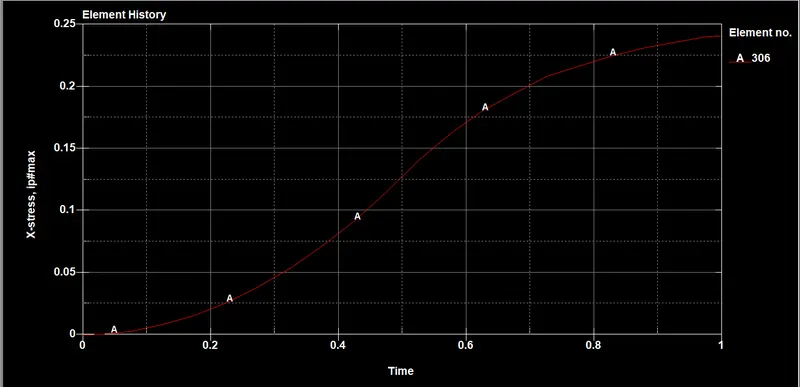
Effective Plastic Strain :
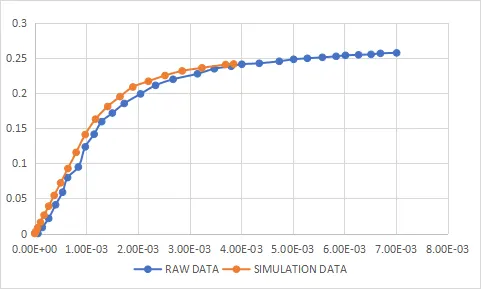
Comparison of raw data and simulation data
RESULT :
The True stress and strain values obtained from the Graphite Iron casting is found to be Similar to the Simulated value as shown below