Week 9 Challenge
SOLUTION
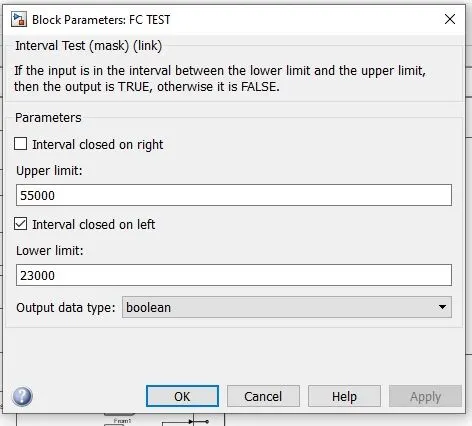
Energy management system: Energy management methods are algorithms that determine how much power is shared between the engine and the motor in order to increase fuel efficiency and HEV performance. The Energy management flowchart is used to determine the power allocation among the battery, ultracapacitor, and fuel cell based on their respective SOC.In addition, the following assumptions and values are used for various parameters. The operational range for the fuel cell is calculated from the polarisation curve and is 23kW to 55kW. The fuel cell's active area is 420cmA2.Cnn e polaritation.The operating rangeof current density is in between 24A/cmA2 and 0.76A/cmA2. And the average voltage of each cell is 0.6V.
Let us assume 380 cells are used in series, then total voltage is 380-0.6 = 228V. Lower limit of current = active area ' lower current density = 420'0.24 = 100.8A Upper limit of current = active area - upper current density = 420'0.76 = 319A
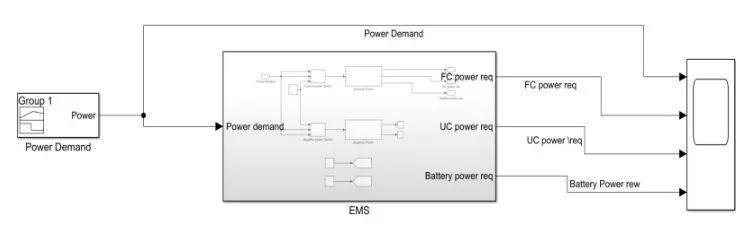
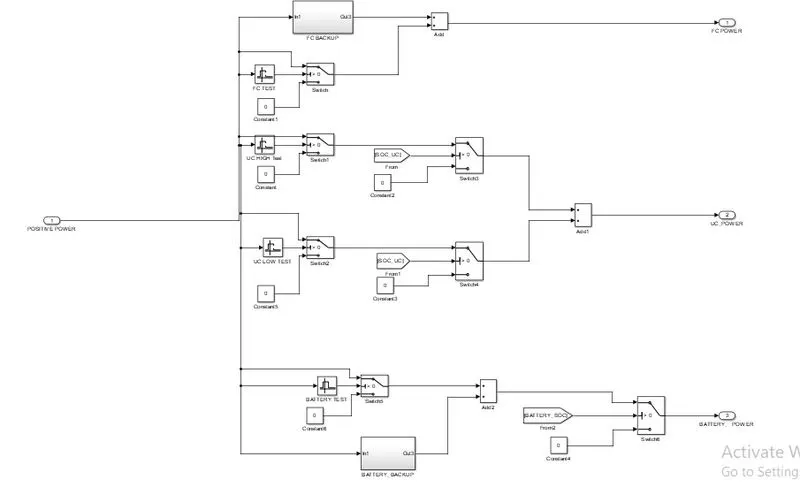
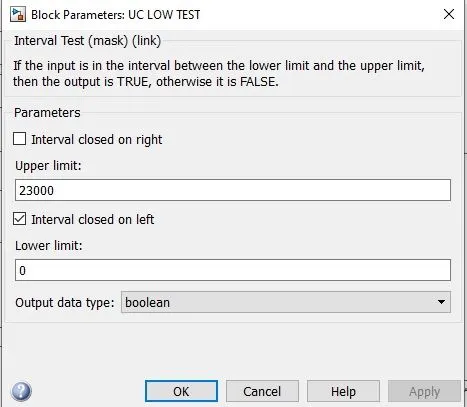
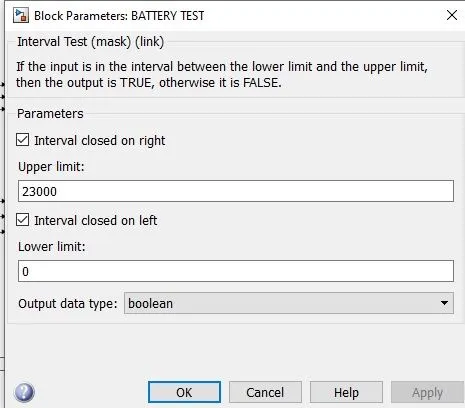
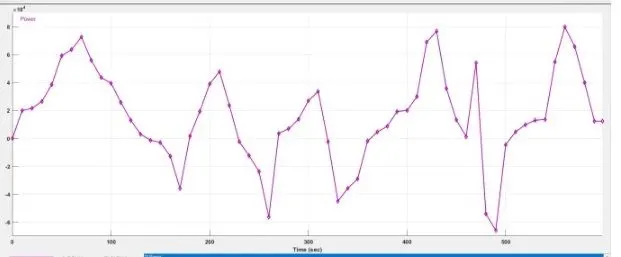
The input to this model is taken as Power demand which is given with the help of a signal builder by considering the acceleration and braking conditions. And the output observed are Battery,UC,Fuel cell power respectively.This is the input which is imported to the signal builder which is power vs time plot.
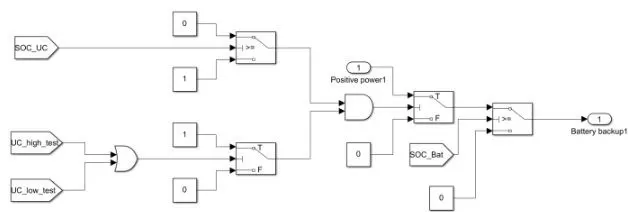
Battery Backup
FC Backup
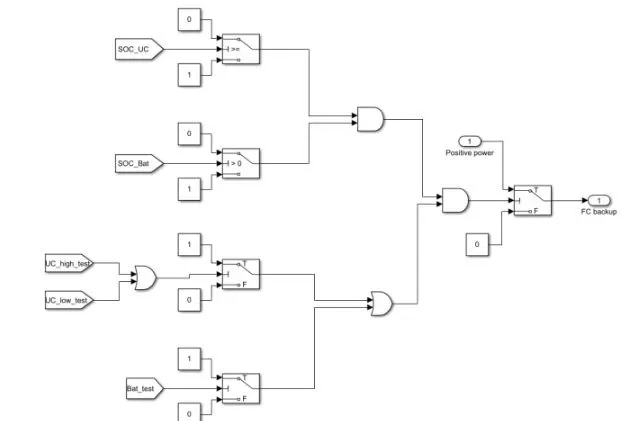
Initially, the SOC of the UC and battery are checked to see if they are larger than the minimum value. There is no requirement for backup power if the SOC minimum values are exceeded. If both SOCs are less than the minimum value, 1 is transmitted through the switch block to the AND block, resulting in 1 as an output from the AND. The UC and battery power ranges are then tested, and these outputs are sent to the OR block, which indicates that output I is true for any one condition. The fuel cell backup power is subsequently delivered to the switch if the output from the AND block is true, i.e. 1.Then the Fuel cell power and the Fuel cell backup power are added and given as ouput. The battery power and battery backup are added as the output.
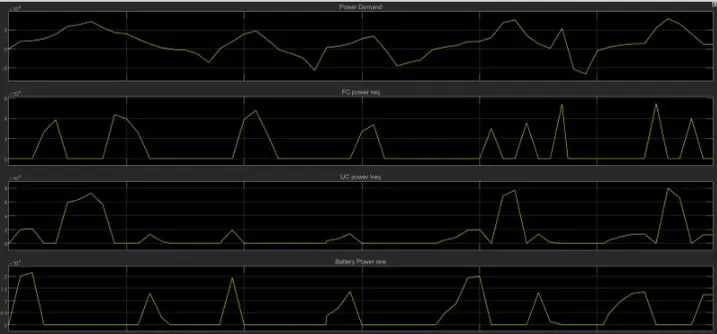
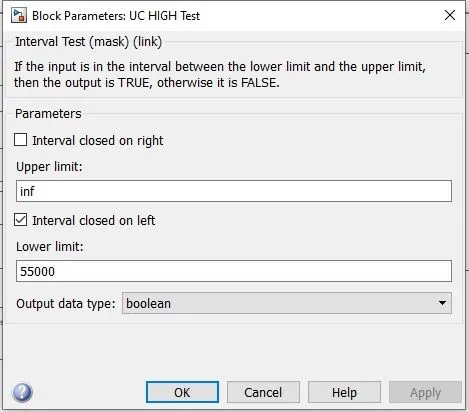
According to the power demand values for Positive power, the power request is shared among several sources such as UC Power, Battery Power, and FC Power based on their operational zones, as shown in the above graphs.The plot shows that the obtained values are fully positive because only positive power is taken into account here, therefore there is no regenerative braking, battery charge, or UC. As can be observed from the graphs, Fuel cell achieves power demands over 23 KW, Ultracapacitor achieves power demands above 55 KW, and Battery achieves power demands between 0 and 23 KW.