Week 9 Challenge
Given Data:-
Linear waterway = 90 m
Design discharge = 700 cumec
Silt factor = 1
HFL = 3 m (from the ground)
The velocity of water = 1.2 m/sec.
Top road level = 100 m
Ground Level = 93.5 m
Diameter of Pile = 1.2 m
Vertical capacity = 250 tonnes
Horizontal capacity = 35 tonnes
Well Diameter = 8 m
Capacity = 70 tonnes.
Well Diameter = 6 m
Capacity = 50 tonnes.
Well Diameter = 7 m
Capacity = 60 tonnes.
Scouring in Bridge:
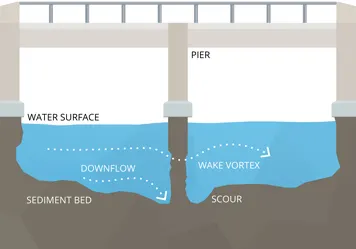
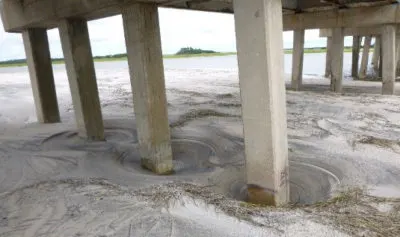
Scouring is defined as the lowering or loss of top bed soil (erosion) around the bridge piers, abutments, etc. due to the water flow currents. Scouring is always a potential threat to bridge stability eventually it can lead to foundation failure.
As per the report, 60% of bridge failures in the world are because of scouring. Bridge scouring is a dynamic act that depends on various factors like flow depth, flow angles, water currents around the pier or abutments, the shape of the pier and abutments, sediments properties etc. Scouring in the bridge is very difficult to monitor and also the foundation failure due to scour is sudden without any warnings.
- Scouring Effect
- Failure in the foundation due to scouring.
Calculation of scouring Depth.
Db =
=
= 10.11 m
Ksf = 1
Dsm =
=
= 6.26 m
Maximum depth of scour for design of foundation,
For Abutment,
= 1.27 X dsm
= 1.27 X 6.26
= 8.41
Depth of foundation below the foundation.
= 8.41 - HFL
= 8.41 - 3
= 5.41 m
For Pier,
= 2 X dsm
= 2 X 6.26
= 12.52
Depth of foundation below the foundation.
= 12.52 - HFL
= 12.52 - 3
= 9.52 m
Conclusion
The depth of the foundation for the Abutment is 5.41 m.
The depth of foundation for the Pier is 9.52 m.
From the above calculation, we have to go pile foundation instead of an open foundation because the depth is high.
As per the given linear waterway 90 m, we can assume that 6 spans of 15-meter distance.
Calculating the forces as per IRC 6 on the foundation,
General
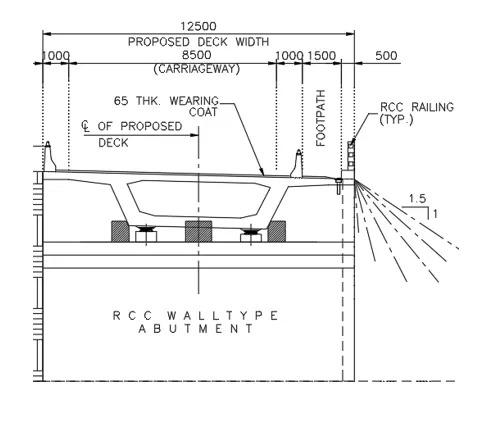
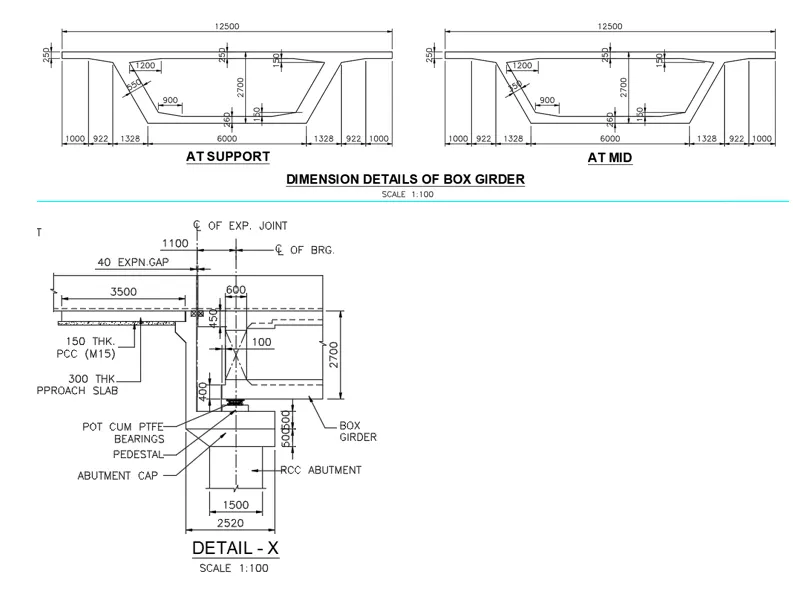
This design note pertains to the design of the abutment. Superstructure consists of a Box Girder of 15.00 m c/c of pot cum PTEF bearing. The substructure consists of an RCC wall-type abutment on a pile foundation.
| Basic Design Data | |||||
| Span and Cross section | Unit | ||||
| 1 | C/c of exp joint | 15.00 | m | ||
| 2 | C/c of bearing | 14.00 | m | ||
| 3 | Dist. Of bearing to exp joint | 0.50 | m | ||
| 4 | Total Deck width | 12.50 | m | ||
| 5 | Carriage width | 8.50 | m | ||
| 6 | Footpath width (One Side) | 1.50 | m | ||
| 7 | Width of Crashbarrier ( Right Side) | 1.00 | m | ||
| 8 | Width of Crashbarrier ( Left Side) | 1.00 | m | ||
| Superstructure Details | |||
| 1 | No fo girder | 1 | |
| 2 | Spacing of girder | 0 | m |
| 3 | Cantilever on both sides | 0 | m |
| 4 | Depth of superstructure | 2.700 | m |
| 5 | Wearing coat thickness | 0.065 | m |
| 6 | Dist. of FRL from the bearing of least height | 10.9 | m |
| 7 | Bearing thickness | 0.065 | m |
| 8 | Pedestal thickness | 0.25 | m |
| 9 | Bearing + pedestal thickness | 0.315 | m |
| 10 | Type of superstructure | Box Girder type | |
| Level | ||||
| 1 | Height of Substructure | Assumption | 6 | m |
| 2 | Finish road Level | FRL | 100.000 | m |
| 3 | Bearing Level | BRL | 97.300 | m |
| 4 | Pier Cap top-level | CTL | 97.235 | m |
| 5 | Pier Cap Bottom level | CBL | 96.235 | m |
| 6 | Ground Level | GL | 93.500 | m |
| 7 | High Flood Level | HFL | 95.900 | m |
| Material Use | ||||
| 1 | Grade of concrete | fck M | 35 | |
| 2 | The design strength of concrete | fcd | 15.63 | |
| 3 | Grade of Steel | fyk Fe | 500 | |
| 4 | The design strength of steel | fyd | 434.78 | |
| 5 | Density of RC concrete | 2.5 | ||
| 6 | Density of Wearing coat | 2.2 | ||
| 7 | Coef. Of thermal expansion of conc. | 1.2 | E-05/ c | |
| 8 | Shrinkage strain | 2 | E-04 | |
| 9 | Modulus of elasticity of Steel | Es | 200000 | Mpa |
| 10 | Modulus of elasticity of Concrete | Ecm for M35 | 32000 | Mpa |
| 11 | Mean axial tensile strength of concrete | fctm | 2.8 | Mpa |
| Dimension of the abutment | |||
| Unit | |||
| 1 | Length of the abutment at the top | 2.52 | m |
| 2 | length of the abutment at the bottom | 1.50 | m |
| 3 | Width of abutment | 12.50 | m |
| 4 | width of the median wall | 3.50 | m |
| 5 | Stem thickness | 1.50 | m |
| 6 | Dritwall thickness | 0.30 | m |
| 7 | Depth of abutment cap varying | 0.50 | m |
| 8 | Depth of abutment cap uniform | 0.50 | m |
| 9 | Return Wall thickness | 0.50 | m |
| Soil Parameter | |||
| 1 | Angler of shear resistance | 30 | |
| 2 | Density of dry backfill | 2 | t/m3 |
| 3 | Density of submerged backfill | 1 | t/m4 |
| 4 | Net SBC | 25 | t/m5 |
| 5 | Gross SBC (LWL) | 33.42 | t/m6 |
| 6 | Gross SBC (HFL) | 27 | t/m7 |
| 7 | Live Load surcharge | 1.2 | m |
| 8 | Type of soil | median | soil |
| 9 | Coefficient of friction | 0.5 | |
| Substructure | |||
| Abutment | |||
| Length ( Longitudinal ) | = | 12.5 | m |
| Length ( Transverse ) | = | 2.52 | m |
| Height | = | 0.5 | m |
| Volume | = | 15.75 | m3 |
| Weight | = | 39.375 | t |
| Trapezoidal Part | |||
| Top Length | = | 12.5 | m |
| Bottom Length | = | 12.5 | m |
| Top width | = | 2.52 | m |
| Bottom width | = | 1.5 | m |
| Height | = | 0.5 | m |
| Volume | = | 12.5625 | m3 |
| Weight | = | 31.40625 | t |
| Total weight of pier cap | = | 70.78125 | t |
| Abutment Shaft | |||
| Length ( Longitudinal ) | = | 12.5 | m |
| Length ( Transverse ) | = | 1.5 | m |
| Height | = | 6 | m |
| Volume | = | 112.5 | m3 |
| Weight | = | 281.25 | t |
| For Material | |||
| Material | Basic Combination | Seismic Combination | |
| Concrete | 1.5 | 1.5 | |
| Steel | 1.15 | 1.15 | |
| Load On superstructure | |||
| Dead Load of Superstructure | |||
| Total weight of the superstructure | = | 228.210 | t |
| Reaction | = | 114.105 | t |
| Total reaction on abutment | = | 114.105 | t |
| Distance between bearing & CL of abutment shaft | = | 0 | m |
| Longitudinal movement | = | 0 | t-m |
| The transverse eccentricity of Dl from C/l of abutment | = | 0 | m |
| Transverse Movement | = | 0 | t-m |
| SIDL (Excluding wearing course) | |||
| Crash barrier weight | = | 84.375 | t |
| Railing weight | = | 0 | t |
| Footpath/service weight | = | 0 | t |
| Total reaction on abutment | = | 42.1875 | t |
| SIDL ( Wearing course) | |||
| Load intensity due to wearing course | = | 0.22 | t |
| DL of wearing course | = | 18.24 | t |
| Total reaction on abutment | = | 9.12 | t |
Summary force at footing Level
| Load Item | P | ML | MT | HL | HT | |
| t | t-m | t-m | t-m | t-m | ||
| Dead Load | 114.105 | 0 | 0 | 0 | 0 | |
| SIDL 1 | 42.185 | 0 | 0 | 0 | 0 | |
| SIDL 2 | 9.12 | 0 | 0 | 0 | 0 | |
Live Load
1 Lane 70 R Wheel
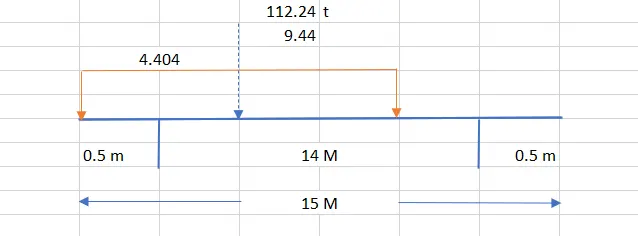
| Live Load reaction | ||||
| Total live load | = | 92 | t | |
| No of lanes | = | 2 | nos | |
| % reduction in live load | = | 0 | % | reduction |
| impact factor - | = | 1.22 | As per IRC 6 | |
| Total load with impact | = | 112.24 | ||
| Ra | = | 80.94 | t | |
| Rb | = | 31.29 | t | |
| vertical reaction on the abutment | = | 84.55 | t | |
| Breaking force | = | 16.91 | t | 20 % of Ra |
| Total horizontal force at abutment | = | 8.455 | t | Fh/2 |
| Breaking Type | = | POT CUM PTFE | ||
| Transverse eccentricity | = | 3.155 | m | |
| Transverse movement | = | 266.75525 | t-m | |
1 Lane Class A
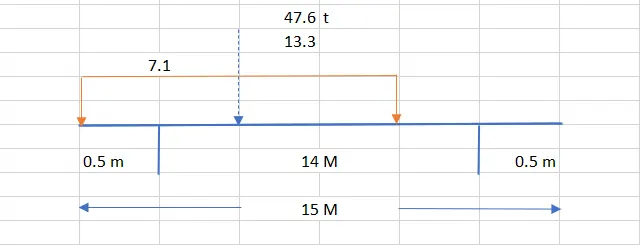
| Live Load reaction | ||||
| Total live load | = | 38.8 | t | |
| No of lanes | = | 2 | nos | |
| % reduction in live load | = | 0 | % | reduction |
| impact factor - | = | 1.22 | As per IRC 6 | |
| Total load with impact | = | 47.336 | ||
| Ra | = | 25.16 | t | |
| Rb | = | 22.34 | t | |
| vertical reaction on the abutment | = | 28.45 | t | |
| Breaking force | = | 5.69 | t | 20 % of Ra |
| Total horizontal force at abutment | = | 2.845 | t | Fh/2 |
| Breaking Type | = | POT CUM PTFE | ||
| Transverse eccentricity | = | 4.5 | m | |
| Transverse movement | = | 128.025 | t-m | |
Summary force at footing Level
| Load Item | P | Load (Min) | ML | MT | HL | HT | |
| t | t | t-m | t-m | t-m | t-m | ||
| Class 70 R vehicle | 84.55 | 31.29 | 84.55 | 266.76 | 8.445 | 0 | |
| Class A vehicle | 28.45 | 22.34 | 28.45 | 128.025 | 2.845 | 0 | |
Earth Pressure Load and Live Load surcharge
| Horizontal force due to earth pressure on the abutment acts in the L-L direction | ||||
| Width of abutment (Skew) | b | = | 12 | m |
| Horizontal Earth Pressure Coefficient | Kah | = | 0.279 | |
| Horizontal Earth Pressure Coefficient | Kav | = | 0.102 | |
| Earth pressure | ||||
| Normal Case -LWL | ||||
| Foundation Bottom Level | ||||
| H | = | Dirtwall top level - Founding level | ||
| = | 9.015 | |||
| Horizontal force in long. Dirn. | = | 0.5*kah*γ*H2*b | ||
| = | 272.09 | |||
| Lever arm from foundation bottom | = | 0.42*H | ||
| = | 3.7863 | |||
| ML | = | 1030.214367 | ||
| Abutment portion | ||||
| Vertical Force | = | 99.47 | ||
| Liver arm from toe | = | 6.5 | ||
| ML | = | 646.555 | ||
| Summary of forces at Foundation bottom level | ||||
| Normal Case | ||||
| p | HL | ML due to HL | ML due to P | |
| t | t | t-m | t-m | |
| LWL | 99.47 | 272.09 | 1030.22 | 646.55 |
| Live Load Surcharge | ||||
| Normal Case: Abutment portion | ||||
| Foundation Bottom Level | ||||
| H | = | Dirtwall top level - Founding level | ||
| = | 9.015 | |||
| Horizontal force | = | kah*γ*1.2*H*b | ||
| = | 72.44 | |||
| Lever arm | = | H/2 | ||
| = | 4.5075 | |||
| ML | = | 326.5233 | ||
| Summary of force at foundation bottom level | ||||
| p | HL | ML due to HL | ||
| t | t | t-m | ||
| LWL | 0 | 72.44 | 326.5233 | |
| Forces on Abutment | ||||
| Width of abutment | b | = | 12.5 | m |
| The Return Wall is on | one side | = | ||
| The horizontal distance of CG of the abutment shaft from the vertical face | = | 0.5 | m | |
| Dirt Wall Bracket | ||||
| Weight | = | 4.05 | t | |
| Horizontal Lever Arm from bearing c/l | = | 0.953 | m | |
| Dirt Wall | ||||
| Weight | = | 28.59 | t | |
| Horizontal Lever Arm from bearing c/l | = | 0.67 | m | |
| Abutment Cap | ||||
| Weight | = | 70.78 | t | |
| Horizontal Lever Arm from bearing c/l | = | 0 | m | |
| Abutment Shaft | ||||
| Weight | = | 281.25 | t | |
| Horizontal Lever Arm from bearing c/l | = | 0 | m | |
| Summary of force at foundation bottom level | ||||
| Description | Weight | Lever arm | ML | |
| t | m | tm | ||
| Abutment shaft | 281.25 | 0.95 | 268.03 | |
| Abutment cap | 70.78 | 0.67 | 47.42 | |
| Drit wall bracket | 28.59 | 0.00 | 0.00 | |
| Drit wall | 4.09 | 0.00 | 0.00 | |
| Total | 384.71 | 315.45 |
| The calculation for the Return Wall | |||
| Portion a | |||
| Weight | = | 53.9 | t |
| Hor.Lever Arm from toe in L-L dirn. | = | 5.26 | t-m |
| Portion b | |||
| Weight | = | 3 | t |
| Hor.Lever Arm from toe in L-L dirn. | = | 2.86 | t-m |
| Portion c | |||
| Weight | = | 0.06 | t |
| Hor.Lever Arm from toe in L-L dirn. | = | 2.91 | t-m |
| Portion d | |||
| Weight | = | 2.1 | t |
| Hor.Lever Arm from toe in L-L dirn. | = | 5.29 | t-m |
| Summary Force | |||
| Portion | Weight | Leaver arm | ML |
| t | m | t-m | |
| a | 53.9 | 5.26 | 283.514 |
| b | 3 | 2.86 | 8.58 |
| c | 0.06 | 2.91 | 0.1746 |
| d | 2.1 | 5.29 | 11.109 |
| Calculation for Backfill Weight | |||
| Width of backfill in transverse direction | = | 12 | m |
| Portion a | |||
| Weight | = | 991.8 | t |
| Hor.Lever Arm from toe in L-L dirn. | = | 5.26 | t-m |
| Portion b | |||
| Weight | = | 52.6 | t |
| Hor.Lever Arm from toe in L-L dirn. | = | 2.86 | t-m |
| Portion c | |||
| Weight | = | 1.1 | t |
| Hor.Lever Arm from toe in L-L dirn. | = | 2.91 | t-m |
| Portion d | |||
| Weight | = | 38.64 | t |
| Hor.Lever Arm from toe in L-L dirn. | = | 5.9 | t-m |
| Summary force | |||
| Portion | Weight | Lever arm | ML |
| t | m | t-m | |
| a | 991.8 | 5.26 | 5216.868 |
| b | 52.6 | 2.86 | 150.436 |
| c | 1.1 | 2.91 | 3.201 |
| d | 38.64 | 5.9 | 227.976 |
Total summary force on foundation
| Loads | P MAX | P MIN | ML | MT | HL |
| Dead load | 114.11 | 114.11 | 0 | 0 | 0 |
| SIDL | 42.19 | 42.19 | 0 | 0 | 0 |
| SIDL (Wearing Coat) | 9.12 | 9.12 | 0 | 0 | 0 |
| Class 70 R vehicle | 84.55 | 31.29 | 84.55 | 266.76 | 8.445 |
| Class A vehicle | 28.45 | 22.34 | 28.45 | 128.025 | 2.845 |
| Earth pressure | 99.47 | 99.47 | 1030.22 | 0 | 272.09 |
| Live load surcharge | 0 | 0 | 326.5300 | 0 | 72.44 |
| Weight of Substructure | 384.71 | 384.71 | 315.45 | 0 | 0 |
| Weight of soil above tie | 1084.14 | 1084.14 | 5598.481 | 3604 | 16.93 |
| Total | 1846.74 | 1787.37 | 7383.68485 | 3998.785 | 372.75 |
For Continous bridge
Longitudinal force clause no 211.1 from IRC 6 we need to consider for the bridge in which free bearing and fix bearing concept is taken for design.
a) What is the zero shear point and if there is more scour at the region what will be the effect of that on the zero shear point?
The points other than the extreme ends of a beam where B.M. is zero are called points of contraflexure or inflexion. The point at which we get zero shear force we get the maximum bending moment of that section/beam at that point.
If Scouring is more, the point from where passive earth pressure shall be considered will be different and hence point of zero shear will be lower than normal.
zero shear point
The "zero shear point" refers to a location within a structural member (like a beam or slab) where the shear force is temporarily zero due to the distribution of applied loads and reactions. At this point, the internal shear forces are balanced, resulting in no net shear force. As you move away from the zero shear point in either direction, the shear forces gradually increase. It's an important concept in structural analysis and design, helping engineers determine where critical points of shear forces occur.
- The points other than the extreme ends of a beam in a beam at which B.M. is zero are called points of contraflexure or inflexion. The point at which we get zero shear force we get the maximum bending moment of that section/beam at that point.
- If there is more scour then there may be the possibility arises for settlement of the structure. Due to settlement, the magnitude of B.M. increases phenomenonly at the maximum B.M. point i.e. zero shear point. for which the structure tends to failure.
- Also due to scouring buckling may arise in the foundation due to which failure may occur.
Effect of Scour on Zero Shear Point: Scour refers to the erosion or removal of soil or sediment around bridge piers or foundations due to flowing water, such as in rivers or streams. If scour occurs around the foundation of a bridge pier, it can undermine the support and stability of the structure. The effect of scour on the zero shear point can be significant. If the scour depth becomes large enough, it can lead to a shift in the location of the zero shear point. This shift can cause an imbalance in shear forces and potentially lead to structural issues, including reduced load-carrying capacity or even collapse.
c) Liquefaction and its effects, how it can affect the foundation. Also, list the remedial measures for the same. How it is different from scouring?
Liquefaction: Liquefaction is a phenomenon that occurs in saturated, loose, granular soils (like sand) during earthquakes or other rapid loading events. It happens when the soil loses its strength and stiffness due to the build-up of excess water pressure within the void spaces between soil particles. This causes the soil to temporarily behave like a liquid, leading to sinking, tilting, and settlement of structures built on or within the liquefied soil.
Liquefaction is a phenomenon in which the strength and stiffness of soil are reduced by earthquake shaking or other rapid loading. Liquefaction and related phenomena have been responsible for tremendous amounts of damage in historical earthquakes around the world.
Liquefaction occurs in saturated soils, that is, soils in which the space between individual particles is completely filled with water. This water exerts a pressure on the soil particles that influences how tightly the particles themselves are pressed together. Prior to an earthquake, the water pressure is relatively low. However, earthquake shaking can cause the water pressure to increase to the point where the soil particles can readily move with respect to each other.
- Effects on the foundation.
Soil liquefication has a disastrous effect on bridges and different structures. The structure built on liquefiable soil may face foundation settlement, crack, tilt, and overturning for the open foundation
For the deep foundation like pile foundation piles may buckle due to seismic force in liquefication soil.
- Remedial measurement for liquefication soil.
Geological studies identify the landfill sediments, and water table in a seismic region. Soil composed of a mix of small and big grains can safely endure liquefaction since the smaller grains fill the pores between the larger grains. Thus, the soil strength is maintained. Furthermore, modern buildings are designed to be liquefaction-resistant. In a shallow foundation, the foundation constituents are joined to ensure uniform settlement of the foundation. Thus, the induced shear forces are decreased. The soil characteristics may also be enhanced by improving the soil density, strength, and drainage characteristics. Popular mitigation methods to reduce the effects of soil liquefaction are:
- Mitigation by deep soil mixing method
- Compaction, Permeation, and Jet Grouting
- Drain Pile technique
- Dynamic compaction and construction of stone columns
How it is different from scouring?
In the scouring, the surrounding soil of the structure (i.e. pier or abutment) is washed away due to the flow of water and exposes the foundation of the structure while in the case of liquefication, soil behaves like water due to seismic load. The two are very different phenomena.
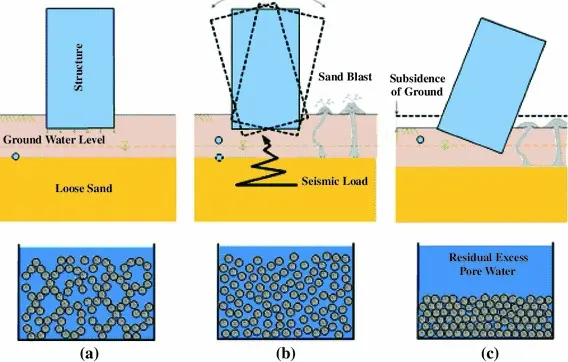
Effects on Foundations: Liquefaction can severely impact foundations, causing structures to settle unevenly, tilt, or even sink. The loss of soil strength during liquefaction reduces the ability of the soil to support the loads imposed by the structure, potentially leading to structural damage or failure.
Remedial Measures for Liquefaction:
-
Improving Soil Compaction: Properly compacted soils are less susceptible to liquefaction. Using proper construction techniques and equipment can help improve soil density.
-
Soil Stabilization: Techniques such as mixing cement, lime, or other stabilizing agents with the soil can increase its strength and resistance to liquefaction.
-
Ground Improvement: Methods like vibro-compaction, stone columns, and deep soil mixing can densify the soil, reducing the risk of liquefaction.
-
Foundational Reinforcement: Strengthening the foundation with appropriate reinforcement can help mitigate the effects of soil liquefaction.
Difference between Liquefaction and Scour:
- Cause: Liquefaction is caused by rapid shaking or loading of loose, saturated soils during events like earthquakes. Scour is caused by the erosion of soil around structures due to flowing water.
- Effect on Soil: Liquefaction temporarily turns soil into a liquid-like state, significantly reducing its strength. Scour removes soil from around structures, potentially compromising their stability.
- Affected Structures: Liquefaction affects structures built on or within liquefiable soils. Scour impacts structures built near or in water bodies, like bridges.
- Time Scale: Liquefaction occurs rapidly during seismic events. Scour can occur gradually over time or more rapidly during flood events.
Both liquefaction and scour are geotechnical challenges that engineers must consider in foundation design to ensure the safety and longevity of structures.