Week 8 - Simulating Cyclone separator with Discrete Phase Modelling
AIM:
The aim of the report is to perform an analysis on cyclone separator using Ansys fluent and calculate separation efficiency and pressure drop.
OBJECTIVES:
The objectives of the report are -
- Discuss the empirical models used to calculate the cyclone separator efficiency.
- Perform cyclone separator analysis by varying particle diameter from 1micro meter to 5 micrometer for inlet velocity of 3m/s.
- Perform cyclone separator analysis by varying particle inlet velocity from 1m/s to 5 m/s for particle diameter size of 5 micrometer.
THEORY:
Cyclone separator -
The Cyclone separator is a device used to remove particulate matter from air, gas or water stream without the use of filters through vortex generation. The gravitational and centrifugal are the main forces responsible for the separation of particulate matter from fluid streams.
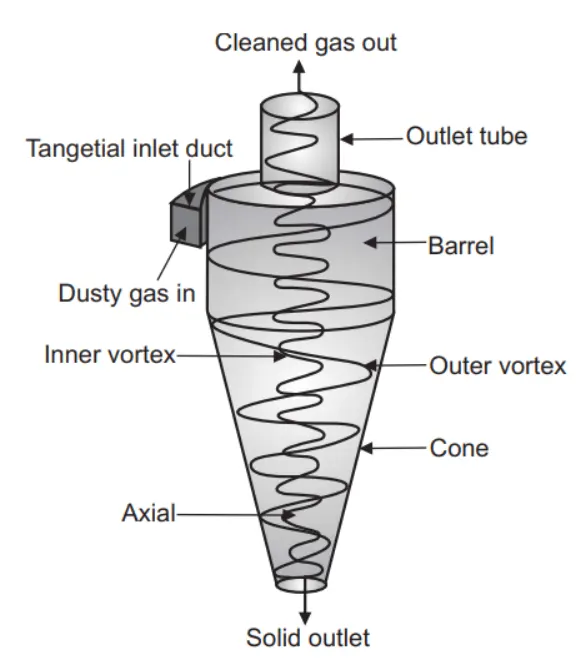
The cyclone separator consists of 1 inlet and two outlets. At inlet, dusty gas is inputted at a high tangential velocity and due to swirling motion, outer vortex generation takes place. Due to inertial effect, the particulate matter don't follow the exact vortex motion and momentum losses of particulates occurs due to Collison with the walls of cyclone separator. The heavy particulate matter gets collected at the bottom of the cyclone separator. The axial velocity of fluid in the conical section, gets reversed and the fluid forms inner vortex and cleaned gas exits from the top outlet.
Factors affecting cyclone separation efficiency -
- Particle density - As the particulate density increases, the separation efficiency increases.
- Particle size - As the particulate size increases, the separation efficiency increases.
- Flow rate - As the flow rate increases, the separation efficiency increases.
- Cone and body length - The separation efficiency increases with increase in the body length and decrease in cone, body diameter.
- Pressure drop - The efficiency of collector depends of pressure drop, as it indirectly estimated the amount of energy required to move the gas through the separator. The pressure drop depends on various parameters such as inlet velocity, cyclone diameter, roughness of inner surface wall of cyclone separator, viscosity of fluid etc. Pressure drop = Pinlet - Poutlet
Advantages -
- It involves low capital cost.
- It can operate at high temperatures.
- It can be used for liquid mist and dry materials.
- Maintainance requirement is less.
Dis-Advantages -
- Its operating cost is high under high-pressure drop conditions.
- It shows low efficiency for small particle separation.
- It cant be used for sticky material.
Empirical models -
1) Iozia and Leith model - This model was developed based on force balance. In this model, since the particle undergoes vortex flow, two main forces are considered - i.e, centrifugal force and flow resistance.
The collection efficiency(ηi) of particle diameter(dpi) is given as -
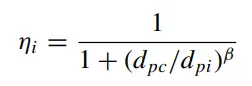 , where

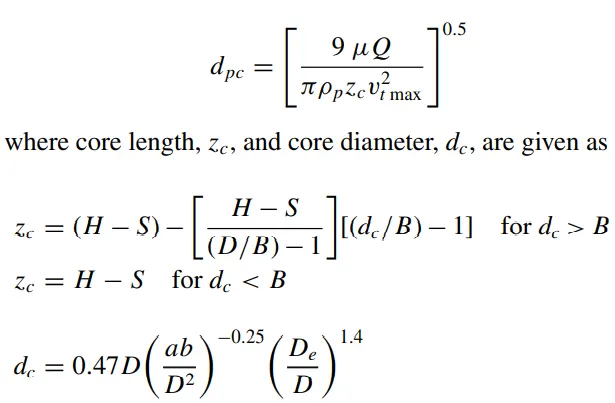
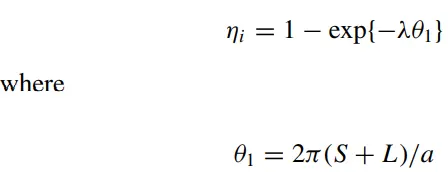
2) Li and Wang model - This model includes particle bounce or re-entrainment and turbulent diffusion at the cyclone wall. In this model, 2D analytical expression of particle distribution in the cyclone is given as -
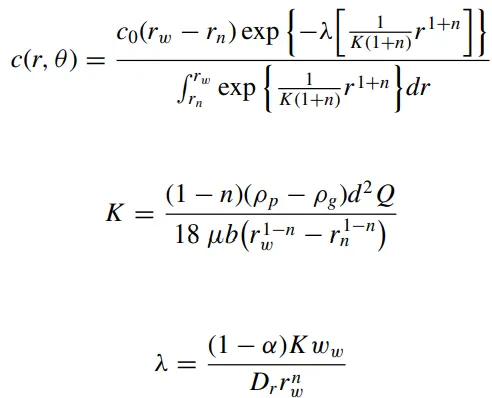
The resultant expression of the collection efficiency for particle of any size is given as -
3) Koch and Licht model - This model includes the inherently turbulent nature of cyclones and the distribution of gas residence times within the cyclone.
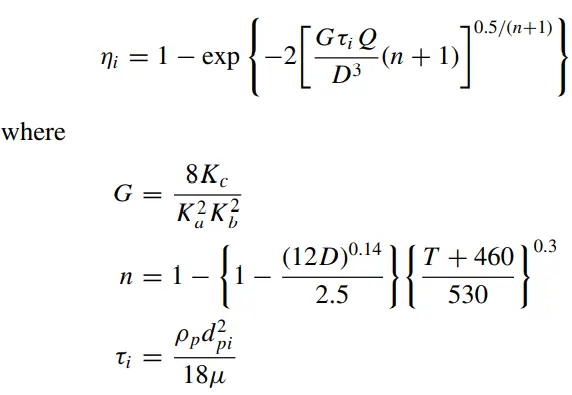
A force balance and an equation on the particles collection yields the grade efficiency (ηi) as -
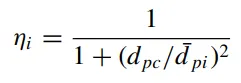
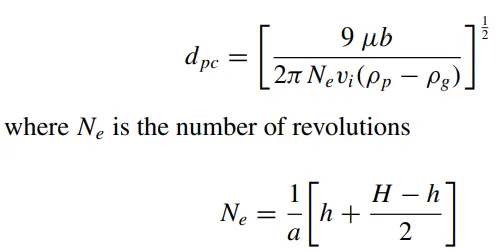
4) Lapple model - This model was developed based on force balance without considering the flow resistance. Lapple assumed that a particle entering the cyclone is evenly distributed across the inlet opening.
The efficiency of collection of any size of particle is given by -
PROCEDURE:
In this report, analysis on cyclone separator is performed in two different case setups.
In case 1, the cyclone separator efficiency is computed for inlet velocity of 3m/s with different particle diameter sizes.
In case2, the cyclone separator efficiency is computed for particle size of 5 micrometer with different inlet velocities.
In order to perform discrete phase modeling simulation, certain steps has to be followed.
Step 1 - Geometry
First import the cyclone separator cad model in space claim.
The cyclone separator consists of the following parts -
1) Inlet duct of dimensions - 50mm x 100mm
2) Top outlet of cylinder diameter 100mm from which purified air passes.
3) Bottom outlet of cylinder diameter 50mm in which particulate matter is collected.
4) Height of cyclone separator of nearly 1000mm.
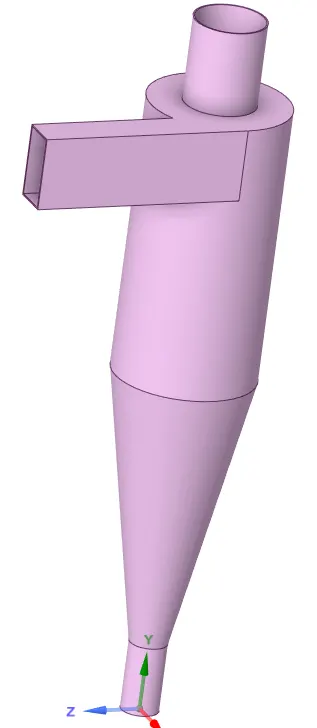
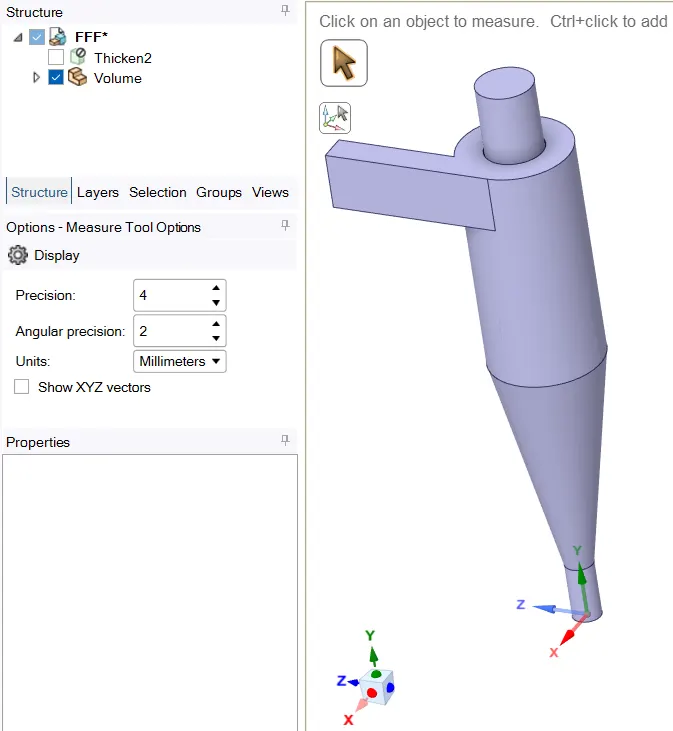
Next, extract the fluid volume inside the cyclone separator by Prepare -> Volume extract as shown in the fig and suppress the solid geometry.
Step 2 - Mesh
First, before generating the mesh, assign names to the parts and boundaries in named selection as shown in the fig.
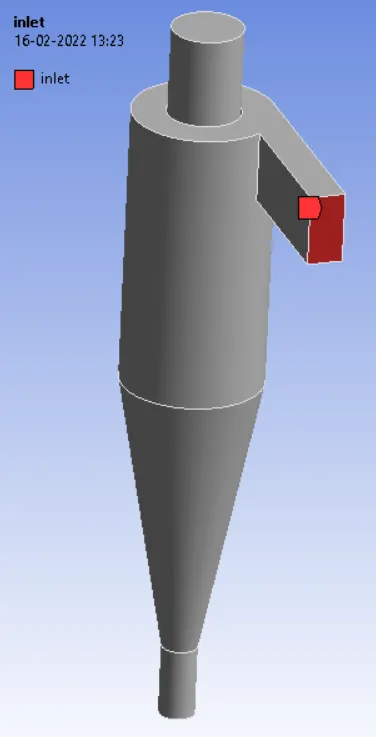
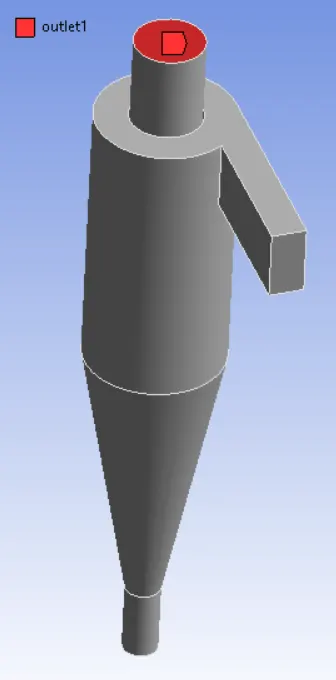
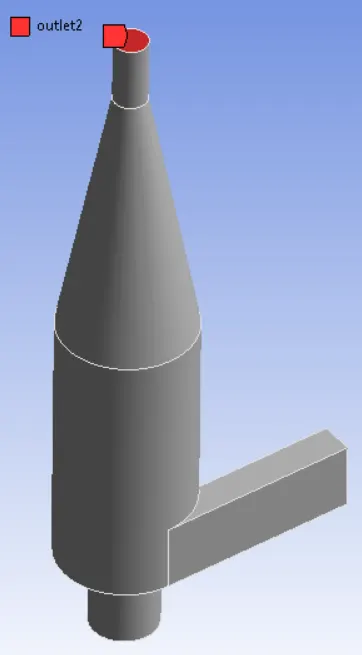
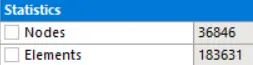
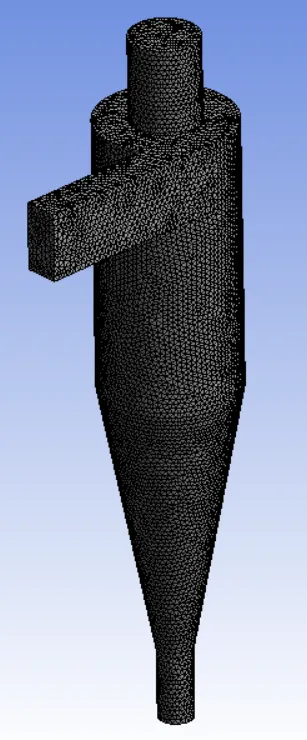
Next, generate mesh of element size 8mm. A total of 1,83,631 elements are generated
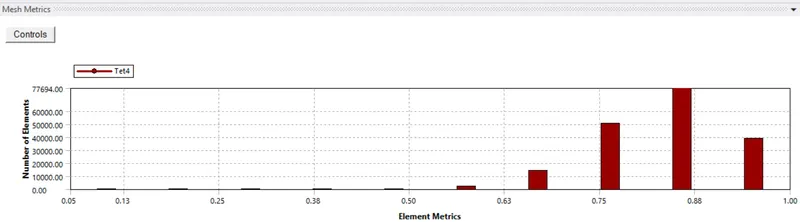
Since, the minimum element quality is 10.2%, the generated mesh is can produce accurate results.
Step 3 - Setup
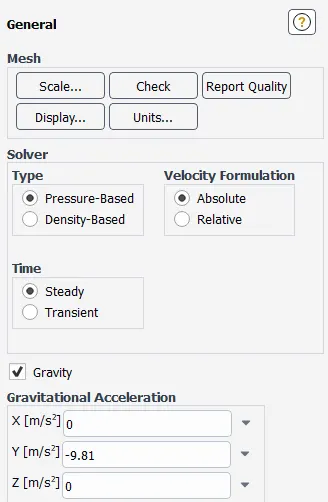
Solver type - Pressure based, Velocity formulation - Absolute, Time - Steady.
Since, in cyclone separator, gravity effects also considered, include gravity in the problem.
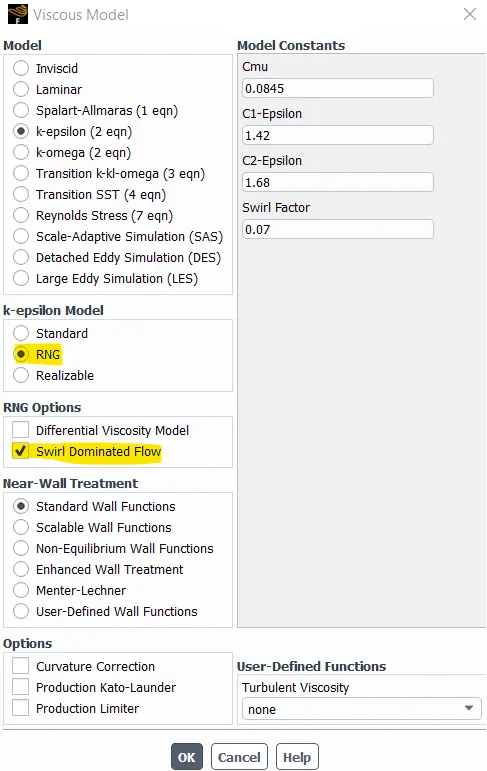
Since, in cyclone separator, turbulence dissipation effects plays an important role, RNG K - epsilon turbulence model is used. RNG is a slight modification to standard K - epsilon, which increases accuracy of swirling flows.
Since, particulate matter don't obey the continuity law, discrete phase modeling is performed with coupled analysis.
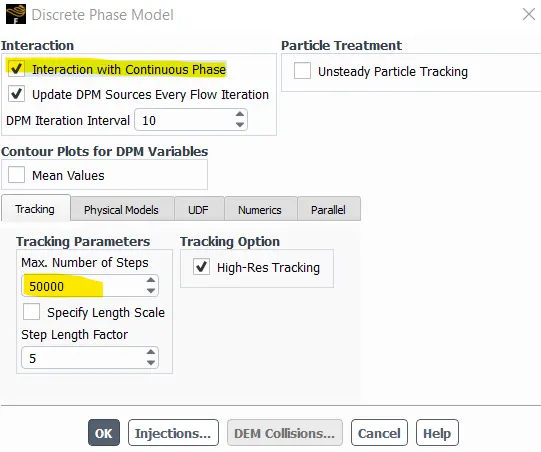
In tracking parameters, maximum no.of steps are considered as 50,000 by which, the stucked particles in the recirculation zone are not tracked.
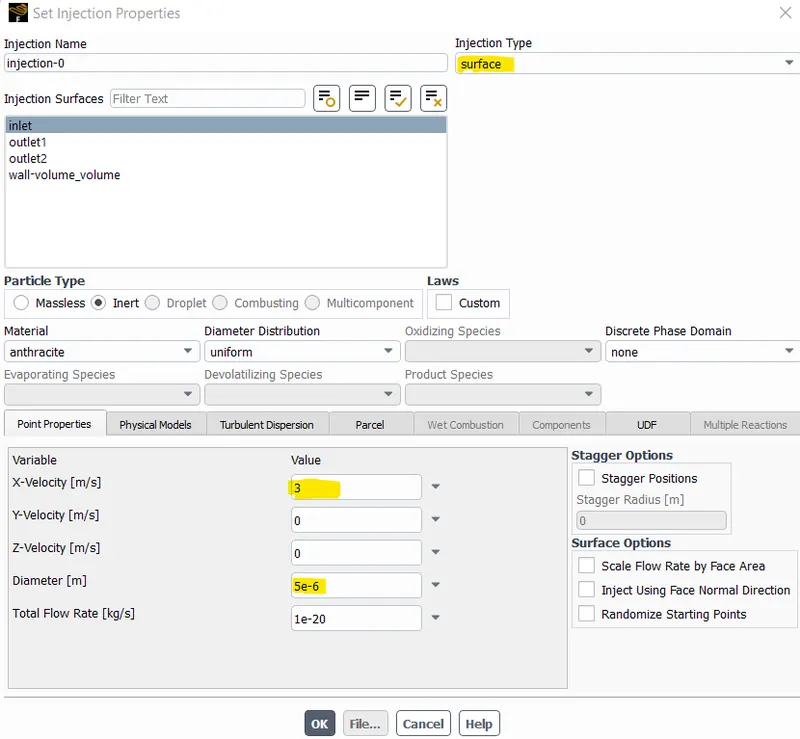
The injection particulate, Anthracite material is considered which is inert type as shown in the fig. The injection type is surface injection with velocity of 3m/s and particulate diameter of 5 microns.
Boundary conditions -
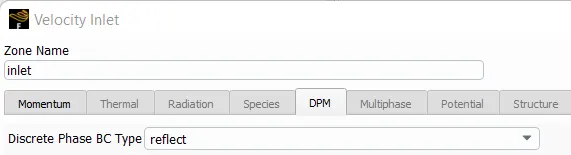
1) Inlet type - Velocity, magnitude = 3m/s and reflect type
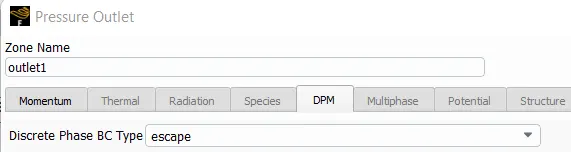
2) Outlet1 type - Pressure, magnitude = zero gauge and escape type
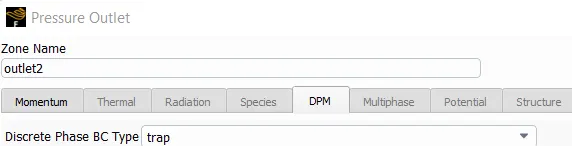
3) Outlet2 type - Pressure, magnitude = zero gauge and trap type
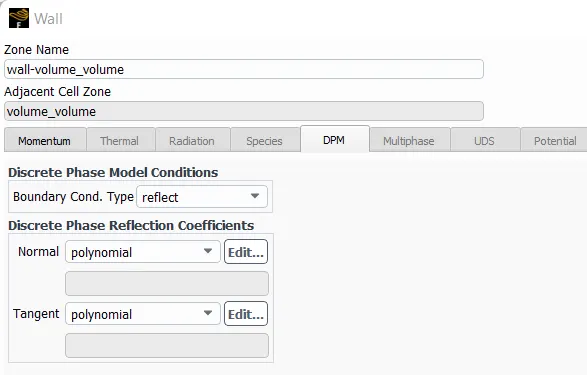
4) Wall type - no slip conditions, magnitude = zero gauge and reflect type
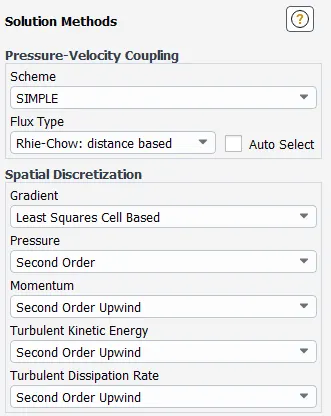
Solution methods -
2nd order upwind scheme produces more accurate spatial discretization schemes.
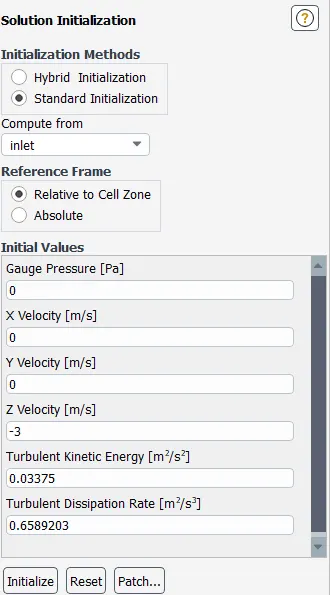
Initialize the model with standard method and compute from inlet.
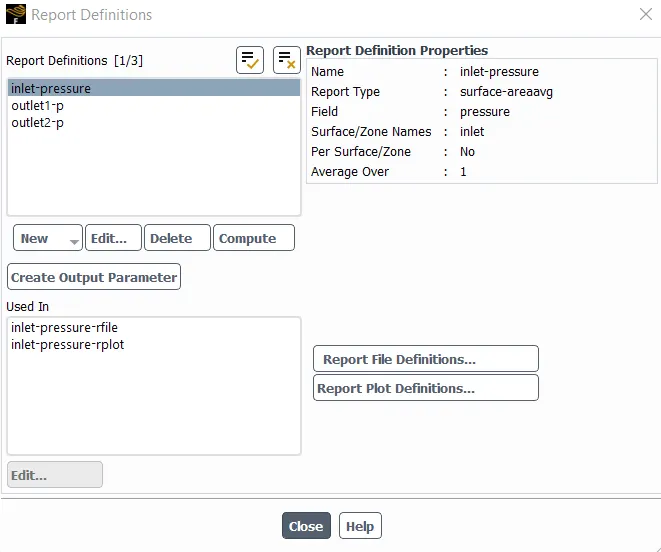
Report types -
Compute pressure at inlet and outlet by area-weighted average
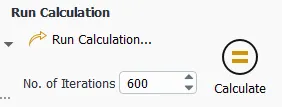
Perform simulation with 600 no.of iterations
After the simulation is performed, export the particle history data, so that information about the tracked particles is visualized.
Step 4 - Results
In CFD POST, in order to visualize the particle tracking data, import the file by File -> Import -> Import fluent particle track file.
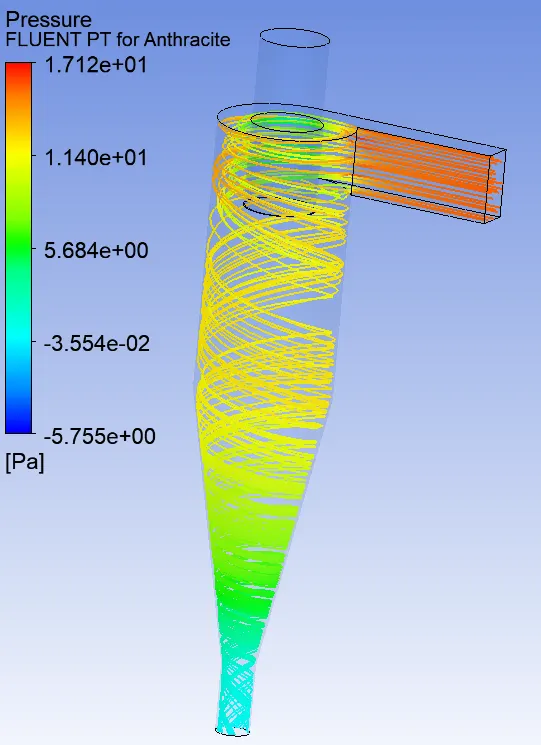
The following fig shows the particle time and particle pressure contours. A total of 172 particles are tracked, but inorder to have better visibility, only 25 particles are tracked as shown in fig.
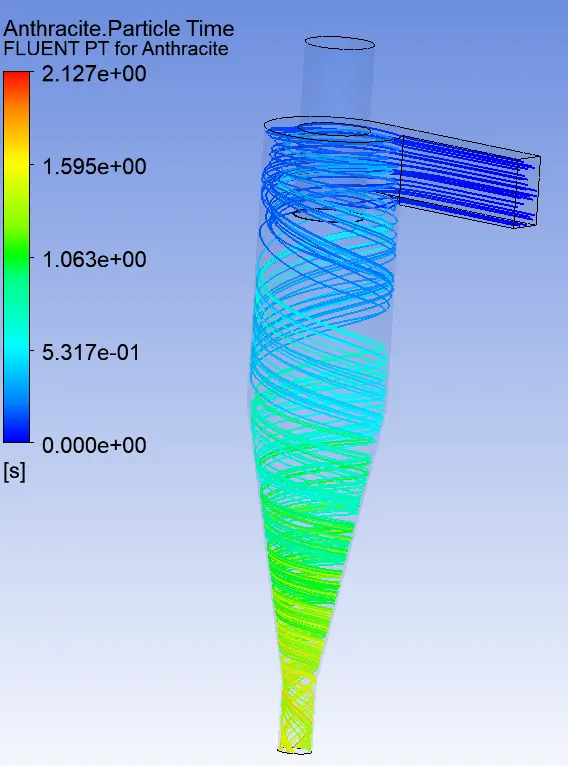
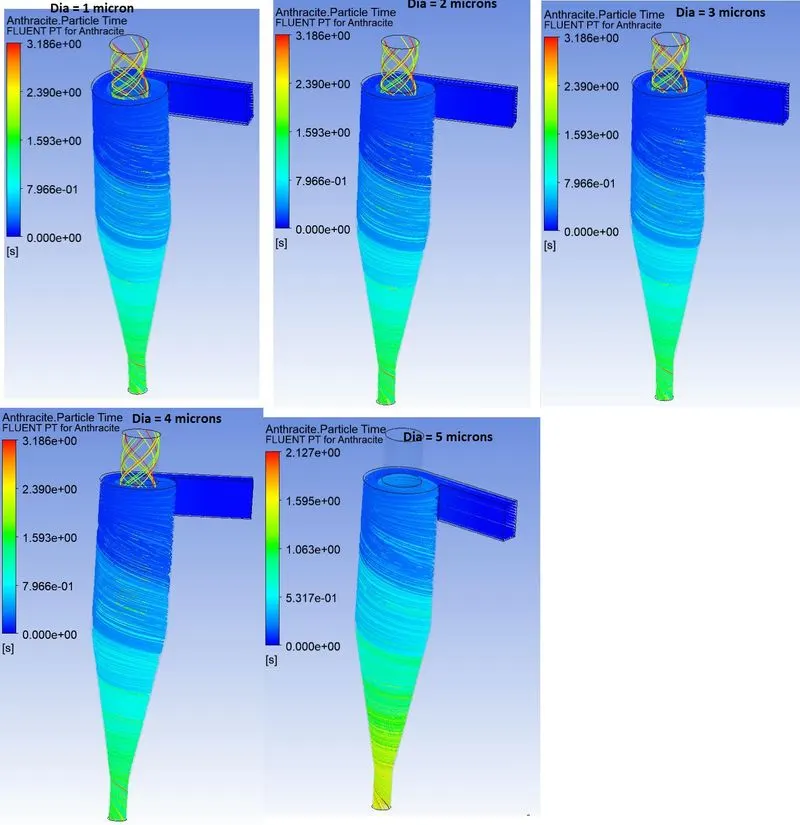
The left fig shows the flow time of particles in the cyclone separator. It is observed that, maximum flow time of particle is around 2.127 sec.
The right fig shows the pressure exerted on particles in the cyclone separator. It is observed that, inlet pressure of 17.12 Pa. Since, a pressure drop occurs along the cyclone separator due to roughness of walls, fluid stream viscosity, So at bottom outlet a vacuum pressure of 5.755 Pa is obtained.
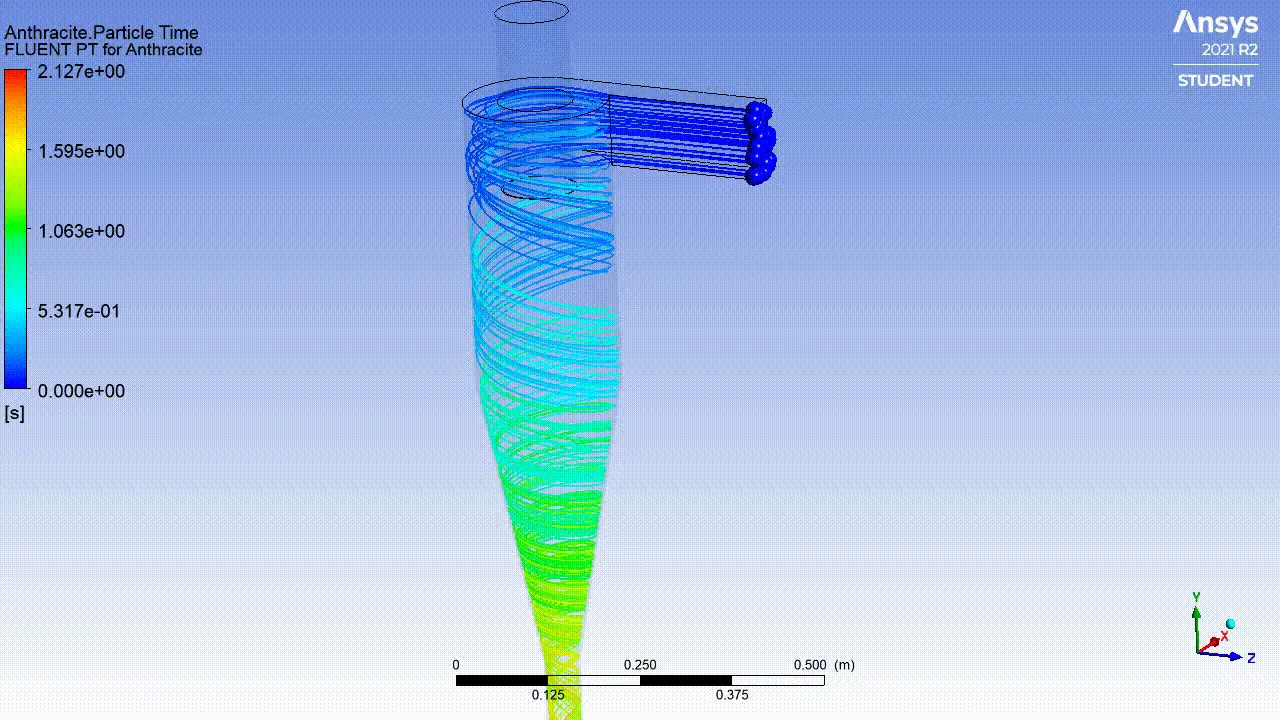
The following animation shows the track followed by the particles.
SOLUTIONS:
In Ansys fluent, the efficiency of cyclone seprator is computed by using the formulae-
Cyclone separator efficiency = no.of particles trapped / no.of particles tracked
The pressure drop is computed by using this formulae
Pressure drop = Inlet pressure - Outlet Pressure
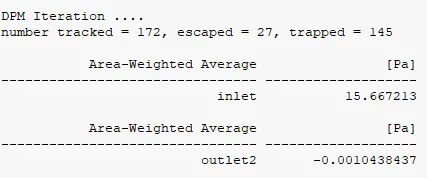
Case 1 - Inlet velocity = 3m/s and varying particle diameter sizes of 1, 2, 3, 4, 5 microns
case 1(a) dia = 1 micron
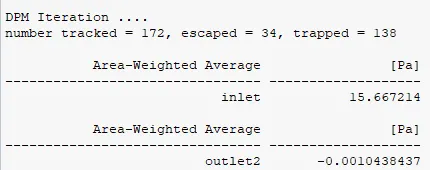
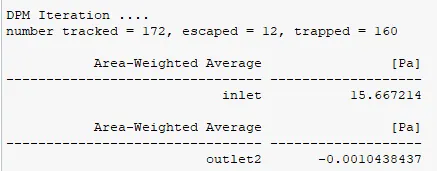
case 1(b) dia = 2 micron
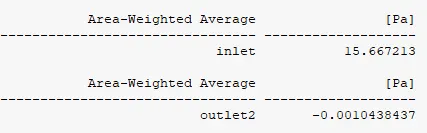
case 1(c) dia = 3 micron
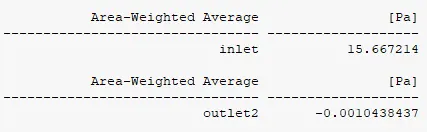
case 1(d) dia = 4 micron

case 1(e) dia = 5 micron

| S.No | Particle diameter | Separator efficiency | Pressure drop [Pa] |
| 1 | 1 micron | 0.802 | 15.668257 |
| 2 | 2 microns | 0.843 | 15.668257 |
| 3 | 3 microns | 0.930 | 15.668257 |
| 4 | 4 microns | 0.988 | 15.668257 |
| 5 | 5 microns | 1 | 15.668257 |
Tabel1: Cyclone separator efficiency and pressure drop
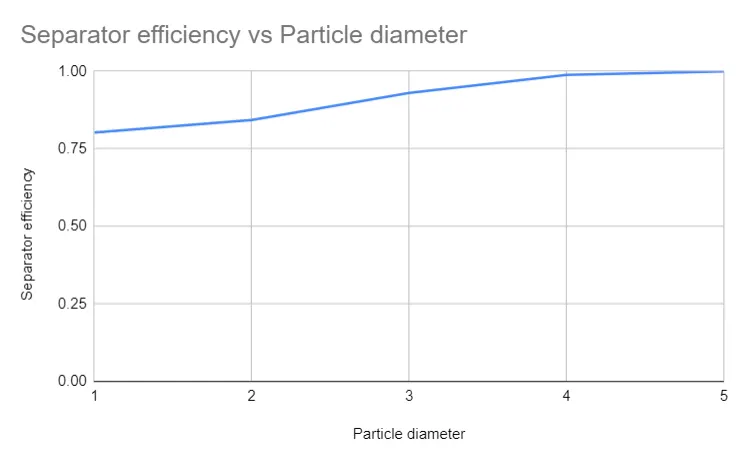
From the table and graph, it is observed that as the particle diameter increases from 1 micron to 5 microns, the separator efficiency increases. For dia = 5 microns, 100% efficiency is achieved.
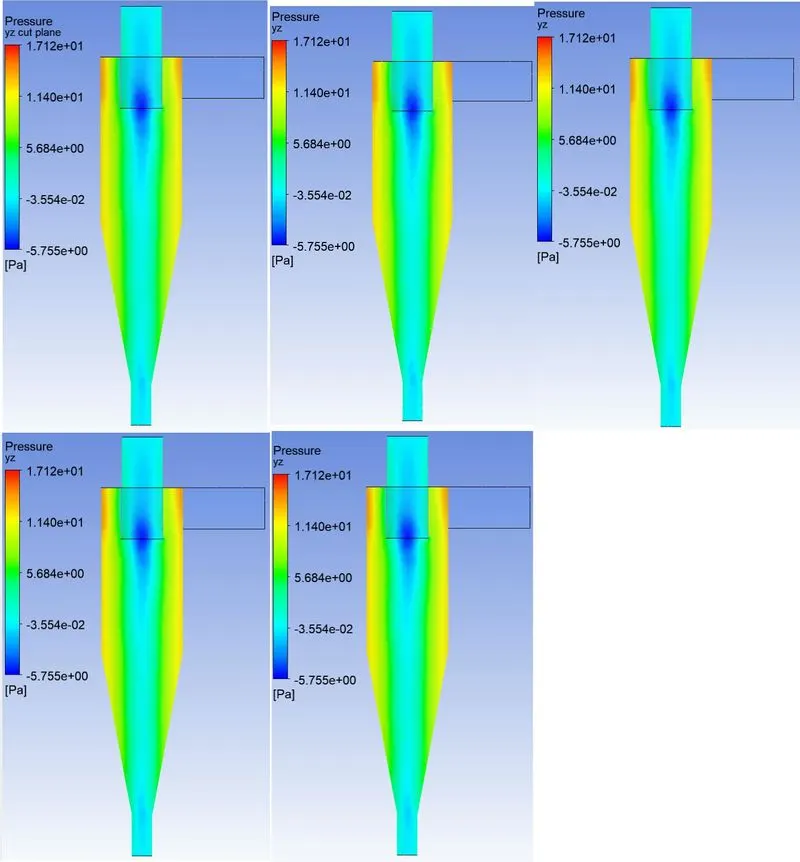
The particle diameter doesn't affect the pressure drop in the cyclone separator. In all the cases, a pressure drop of 15.6682 Pa is observed which indicates that a total energy required to drive the flow is constant for varying particulate diameter operated under constant inlet velocity condition.
The following fig shows the particle time for different particle diameter.
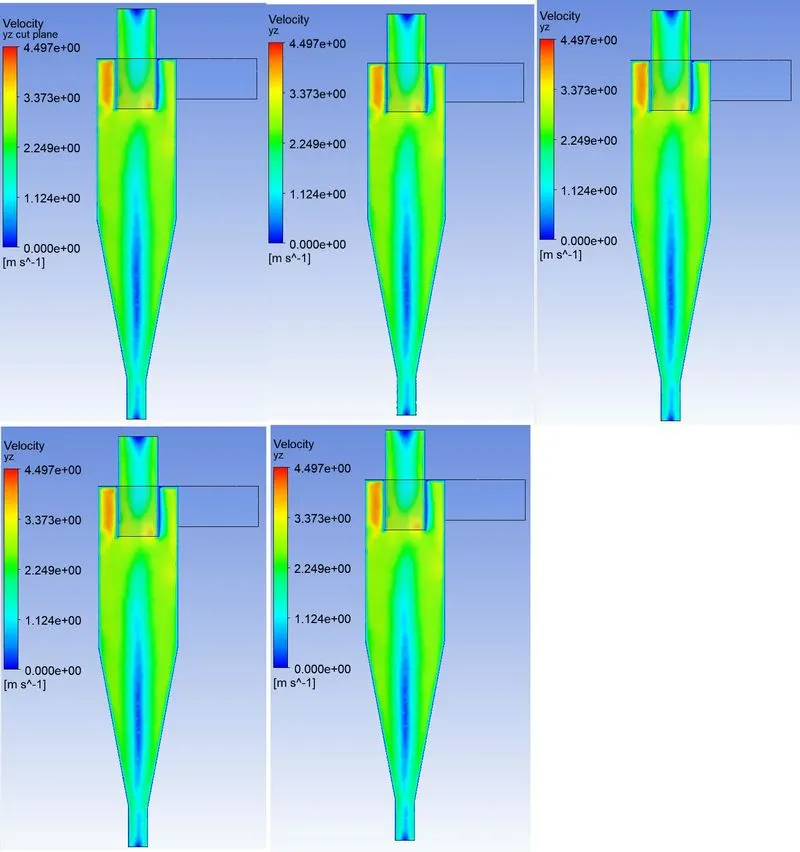
The following fig shows the velocity contours for yz plane section located at the center of the cyclone separator. Since, the inlet velocity is same in all the cases, similar velocity contours are generated.
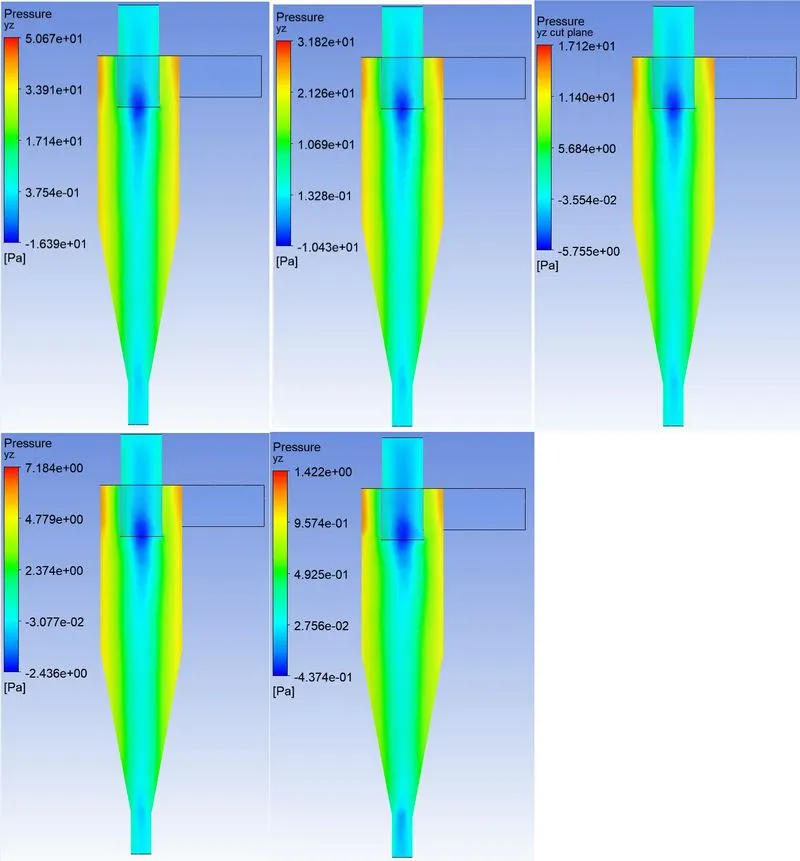
The following fig shows the pressure contours for yz plane section located at the center of the cyclone separator. From the above discussion and from the contours, it is observed that by varying particle diameter from 1 micron to 5 microns, there is no significant effect on the pressure drop. Since, fluid and particles undergoes vortex motion inside the cyclone separator, vacuum pressure is generated at the center of the cyclone separator.
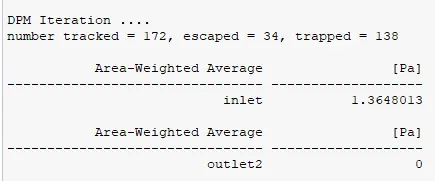
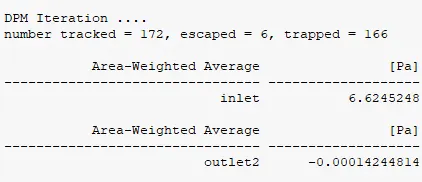
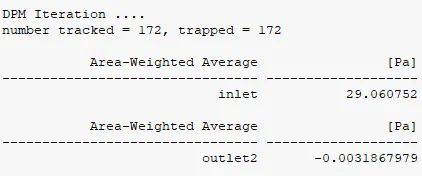
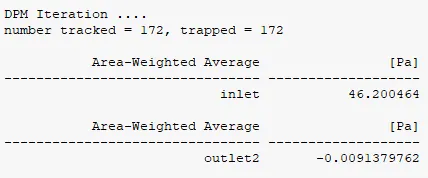
Case 2 - Particle diameter size = 5 microns and varying inlet velocity = 1m/s, 2m/s, 3m/s, 4m/s, 5m/s.
case 2(a) Velocity = 1 m/s
case 2(b) Velocity = 2 m/s
case 2(c) Velocity = 3 m/s
case 2(d) Velocity = 4 m/s
case 2(e) Velocity = 5 m/s
| S.No | Inlet Velocity | Separator efficiency | Pressure drop [Pa] |
| 1 | 1 m/s | 0.8023 | 1.3648 |
| 2 | 2 m/s | 0.9651 | 6.6246 |
| 3 | 3 m/s | 1 | 15.6682 |
| 4 | 4 m/s | 1 | 29.0638 |
| 5 | 5 m/s | 1 | 46.2095 |
Tabel2: Cyclone separator efficiency and pressure drop
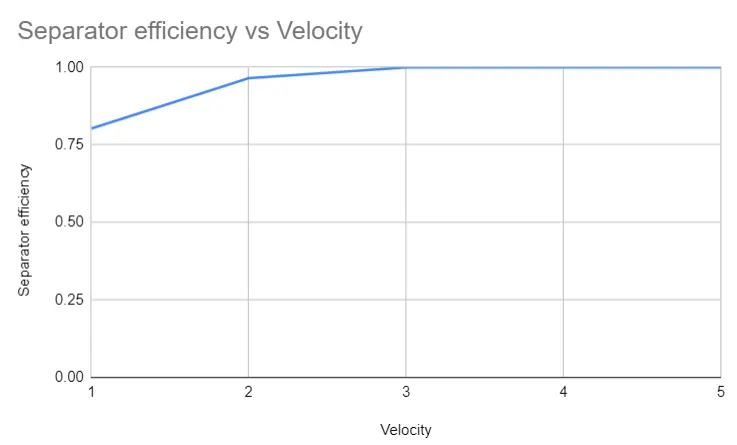
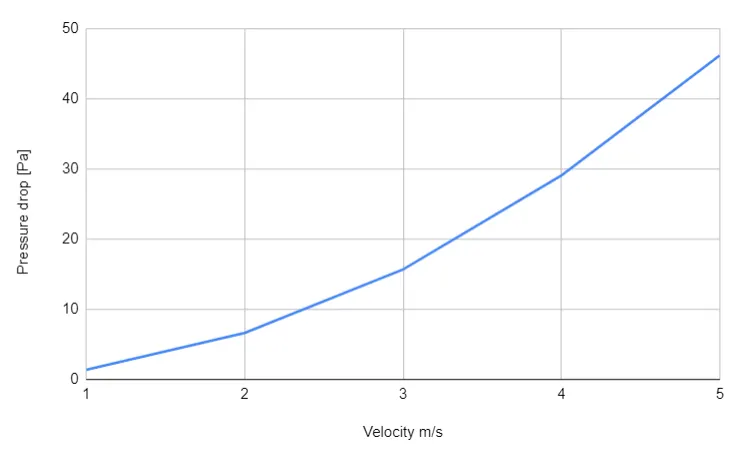
From the table and graph, it is observed that as the inlet velocity increases from 1 m/s to 5 m/s, the separator efficiency increases. For velocity = 3, 4, 5 m/s, 100% efficiency is achieved.
As the inlet velocity increases, the total pressure drop in the cyclone separator increases. So, it can be estimated that the energy losses increases for the increase in the inlet velocity.
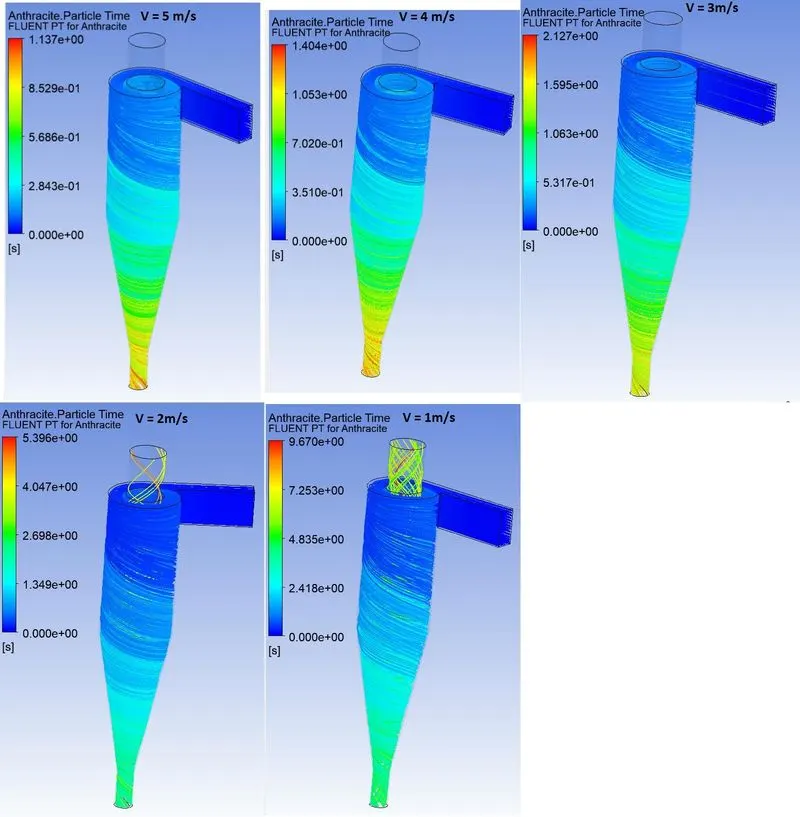
The following fig shows the particle time for different particle diameter. It is observed from the fig that as the inlet velocity increase, the flow time of the particle decreases.
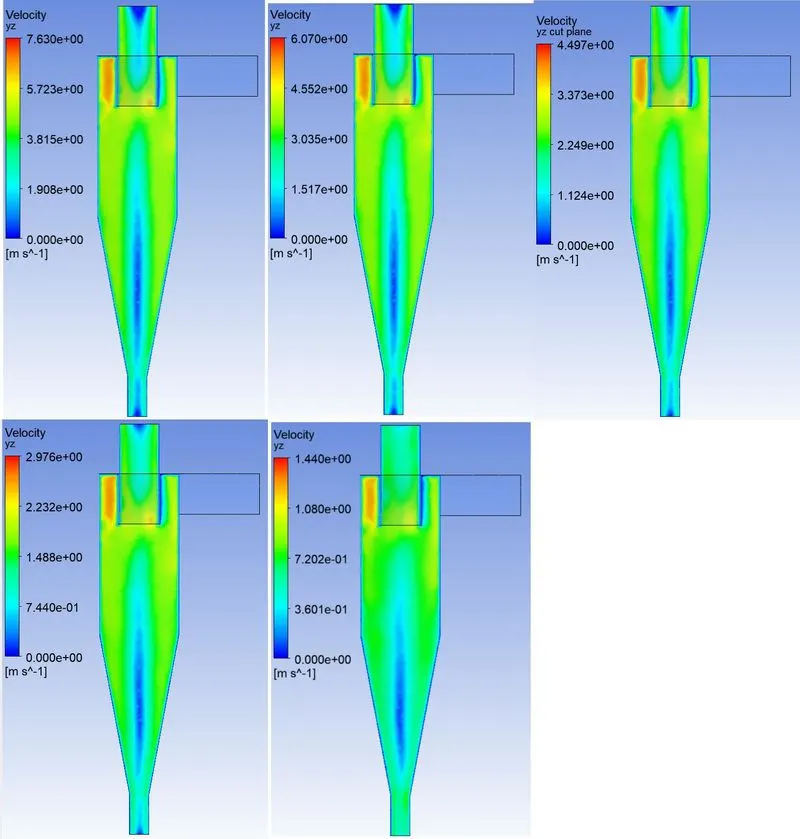
The following fig shows the velocity contours for yz plane section located at the center of the cyclone separator. Since, the inlet velocity is same in all the cases, similar velocity contours are generated.
The following fig shows the pressure contours for yz plane section located at the center of the cyclone separator. It is observed from the contour that as the inlet velocity increases, the pressure drop also increases which indicate more energy losses in the cyclone separator.
CONCLUSION:
It is concluded that, the cyclone efficiency increases when particle inlet velocity is increased and the particle diameter size is increased. The pressure drop inside the cyclone separator increases when the inlet velocity is increased and the particle size doesn't affect the pressure drop inside the cyclone separator.
REFERENCES -
[1] Wikipedia
[2] https://www.sciencedirect.com/science/article/pii/S0307904X06000291
[3] https://www.researchgate.net/publication/232747389_A_CFD_Study_on_the_Prediction_of_Cyclone_Collection_Efficiency