Week 8:Centrifugal pump simulation
JORGE LOZANO
Advanced Turbomachinery Simulation using Converge
Centrifugal pump simulation
Run 3 cases with following outflow mass flow rate.
- 130 kg/s
- 156 kg/s
- 180 kg/s
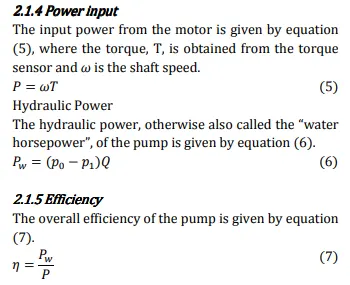
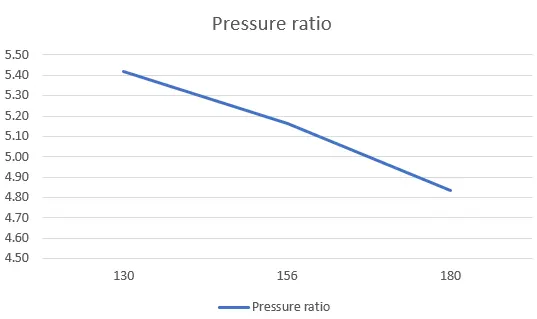
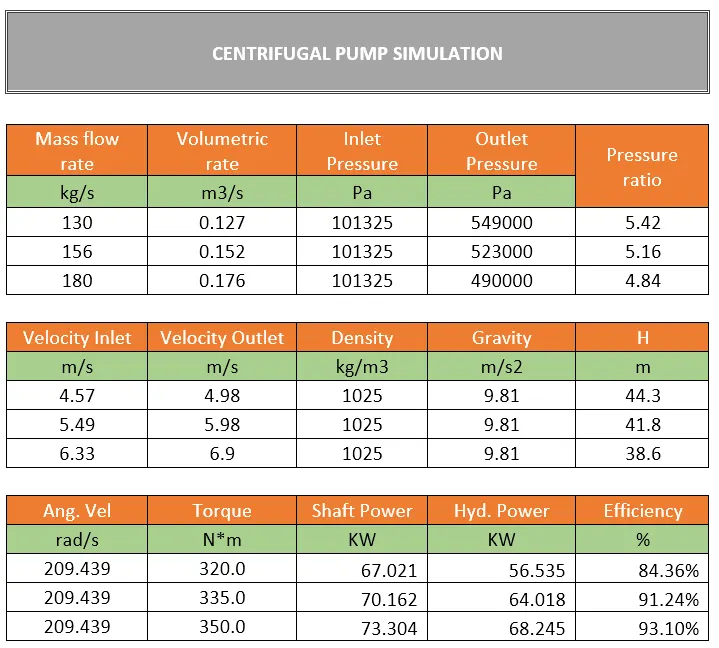
Create a performance plot (Total Pressure ratio vs Mass flow rate) and obtain pump efficiency.
- Total pressure can be obtained from mass_avg_flow.out.
Preprocessing
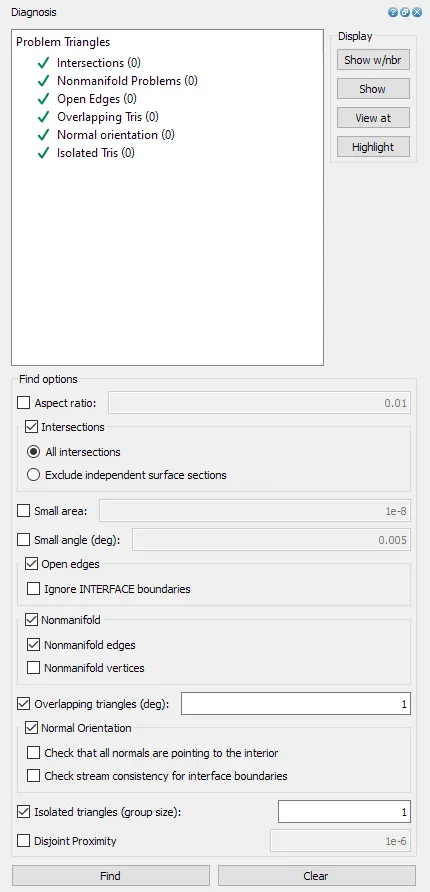
Before the set-up configuration, a cleanup must be perform checking all issues from the diagnosis ran, to produce a well and accurate to reality boundaries and geometry.
The following image shows the final geometry diagnosis ran:
The next most important selections will condition the simulation to a certain kind of flow, main material as mixture with oxygen and nitrogen, simulation parameters as what kind of simulation is, how many iterations, algorithm used, initial conditions with the boundaries, grid control, physical models and the post processing variables obtained from the simulation.
The pre-processing was realized in Converge Simple, while the processing of the simulation will be using the software Cygwin which allows systems to be recompiled and run natively on Windows that by using several processors the simulation will be run using the Converge Studio initial conditions.
After having all boundaries and geometry correct the general flow simulation is set uo as in the right side in the image to generate and apply the equations needed.
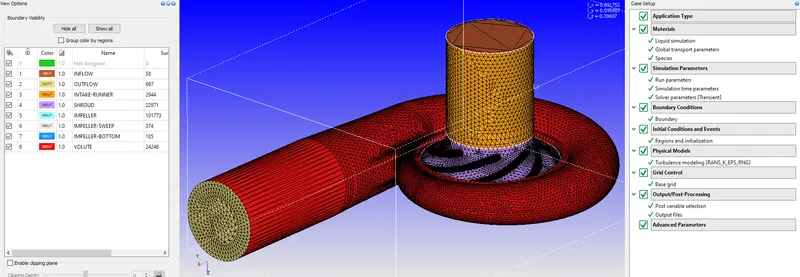
After it is pre-processed and before running the actual simulations no hydro simulations must be performed, the following shows a mesh generation in the 180kg/s case:
Processing
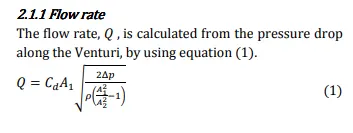
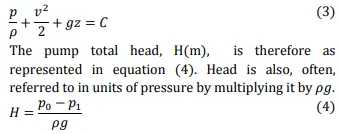
Analysis [3]
Simulations
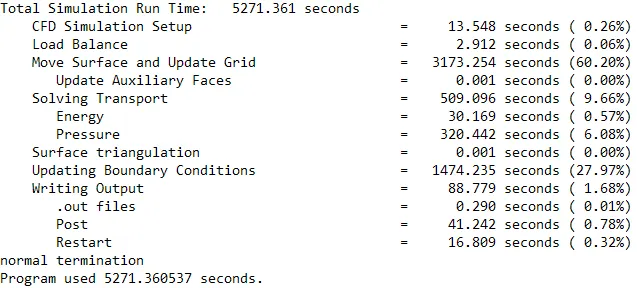
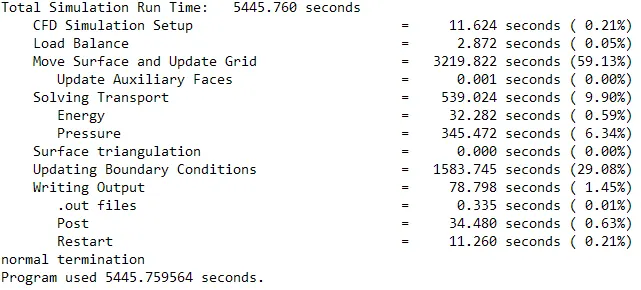
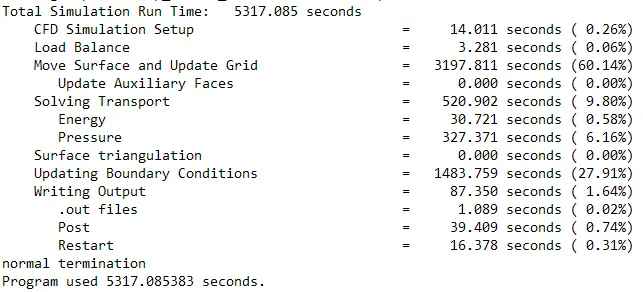
The following images present the overall timing of the simulation, containing the load balance and section time recording to see and be able to optimize the simulation if needed.
130 Kg/s Simulation case
156 Kg/s Simulation case
180 Kg/s Simulation case
Postprocessing
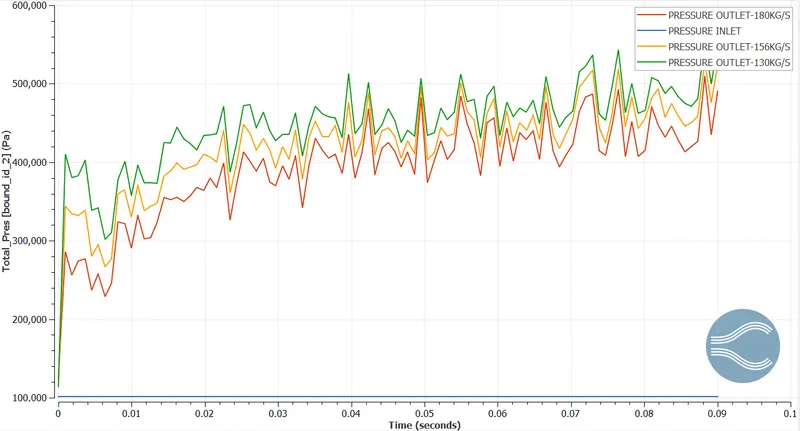
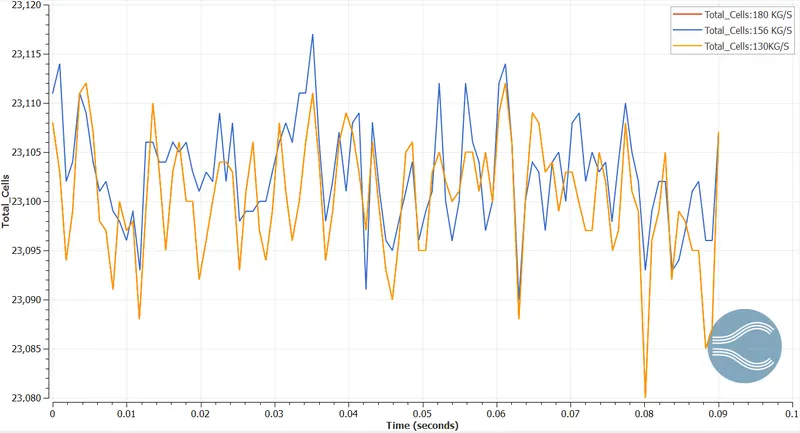
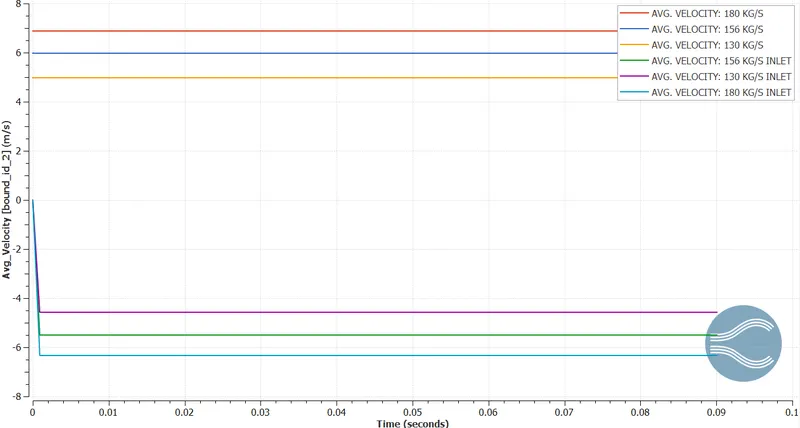
The post processing was carried out using the Para view software and converge plot generation as required comparing the three cases simulated.
Pressure inlet and outlet Converge graph:
Total cells Converge graph:
Avg. Velocity Converge graph:
Videos post processing:
Video 1 No hydrodynamic simulation 130 kg/s
Video 2 No hydrodynamic simulation 156 kg/s
Video 3 No hydrodynamic simulation 180 kg/s
Video 1 Complete simulation velocity contour 130 kg/s
Video 2 Complete simulation velocity contour 156 kg/s
Video 3 Complete simulation velocity contour 180 kg/s
Conclusion
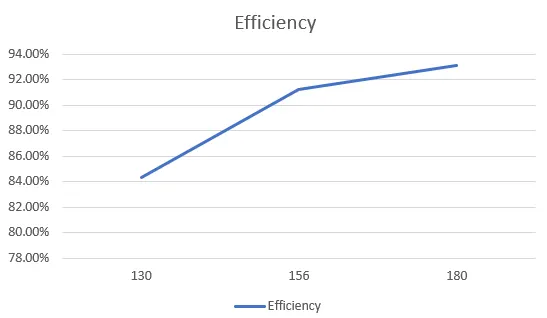
From the simulations and analytical analysis, the best pump seen due to the efficiency obtained is the one having the 180 kg/s as mass flow rate, being expected form the inputs. Converge shows a very efficient fast simulation as seen from the computational timing and other validations from users at the same pre-processing conditions and geometry.
Efficiency plot:
Pressure ratio plot:
References
- https://www.hindawi.com/journals/ijrm/2015/729140/
- https://www.simscale.com/docs/tutorials/incompressible-flow-in-centrifugal-pumps/
- “Performance Analysis of an Experimental Centrifugal Pump”, Akinola Adeniyi et al., April 2014, Research Gate