Week 7 State of charge estimation
Solution 1:
1.The input to the BMS from the battery pack are voltage,current and temperature.Based on these input the battery pack provides output as SOC,SOH,Thermal and Capability of battery pack.The BMS output are given to dashboard through CAN bus.
The BMS implementation is shown below:
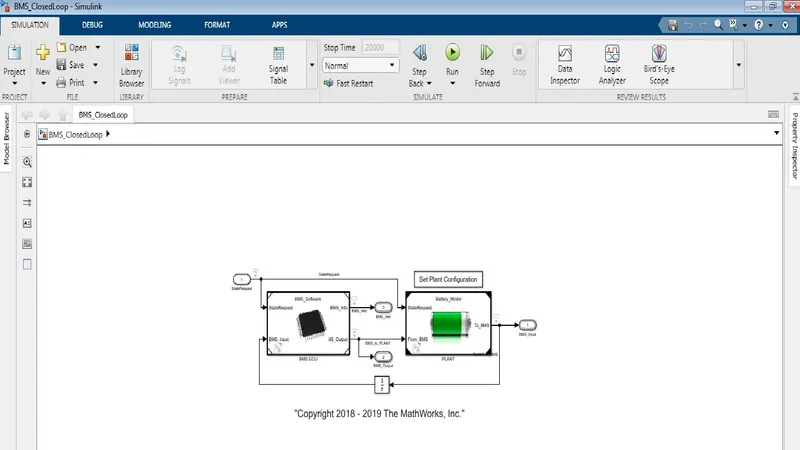
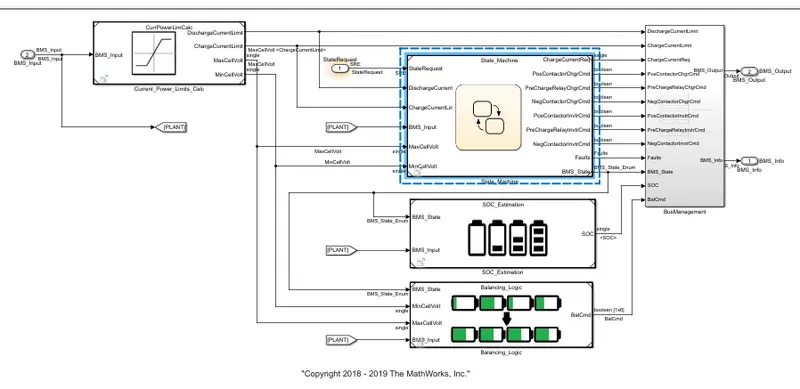
The BMS ECU model represents software and controls part of model.it shows how SOC is estimated and reponse to different states.
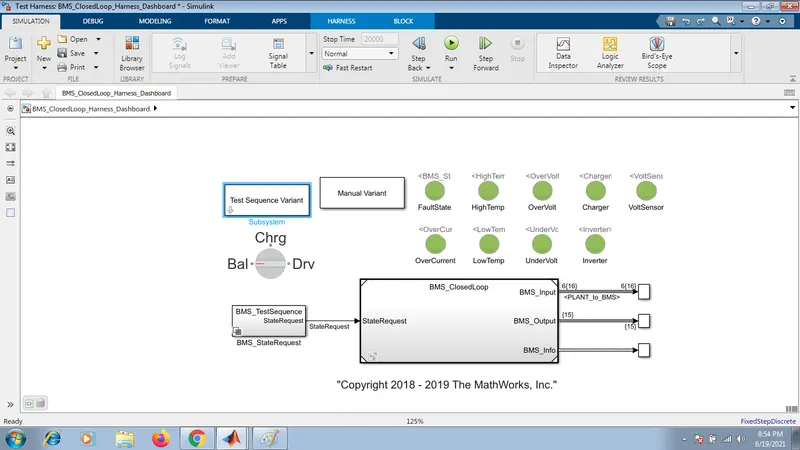
From the above matlab model we are simulating 3 test cases from harness dashboard to find fault condition in BMS.The Dashboard is used to get information related to faults like over voltage,over current,high temperature,under voltage.
Test CAse 1: No fault condition in vehicle.
Observations:
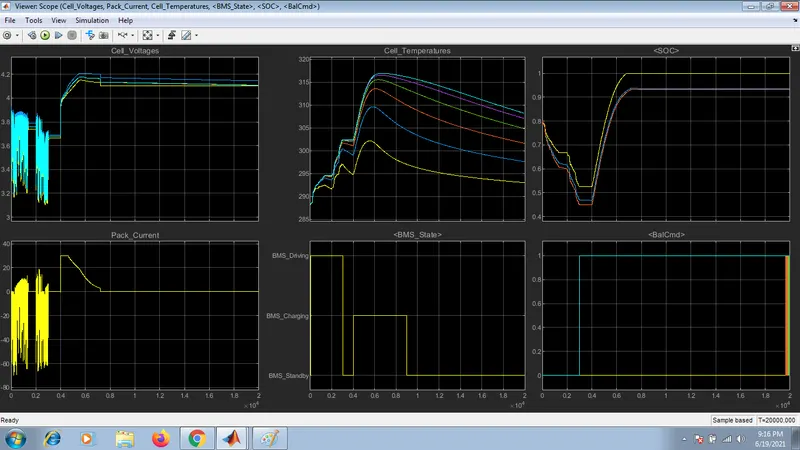
1.From the cell voltage and pack current we can observe the constant current and constant voltage characteristics of battery pack.Initially the cell voltage is 3.8v and the cell current is 0,when the battery is fully discharged.
2.At a time interval of 0.4 sec,the voltage is gradually increased from 3.8 to 4.2V,and at the same instant of time the peak current is increased from 0 to 30A.And it is constant till 0.5 sec,this phase of cell is called as CC mode and then it gradually decreases to zero at 0.7 sec.
3.At time 0.5 sec the voltage are increased to 4.2 V and then from 0.7 sec the voltage remains constant till the end of simulation,this phase is called constant voltage CV mode.Usually the CV mode takes longer time then CC mode.
4.Output results:Comparison of BMS state condition.
a) Discharging Mode/BMS driving:At time interval 0 to 0.4 sec
Cell voltage reduced from 4.2 to 3.7V.
pack current reduced to 0.
SOC is initially 80% and then reduced to 30%.
cell temperature increased from 289 to 300k
cell balancing is idle in this time.
b)Charging Mode/BMS charging : At time interval 0f 0.4 to 0.9 sec
cell voltage is constant from 4.2V.
pack current is increased from 0 to 30 A, reches its capacity and then reduced to zero,in this CV mode.
SOC is initially 30% and then increased to 100% to its full capacity.
Cell temperature increased from 300 to 315K.and gradually reduced as cell are fully charged.
Cell balancing is operating in this period to ensure maximum capacity reached by all the cells while charging in equal mode of opeartion.
Result of SOC:
As we can see that SOC is calculated by diff. methods like
1)Coloumb Counting:From the result of yellow graph,the SOC is increase to 100% at 0.7sec.
2)UKF Kalman filter: SOC etimated is 93%.
3)EKF Kalman filter: SOC etimated is 93%.
Hence there is no fault observed in Dashboard and all indications are green.
Test Case 2:
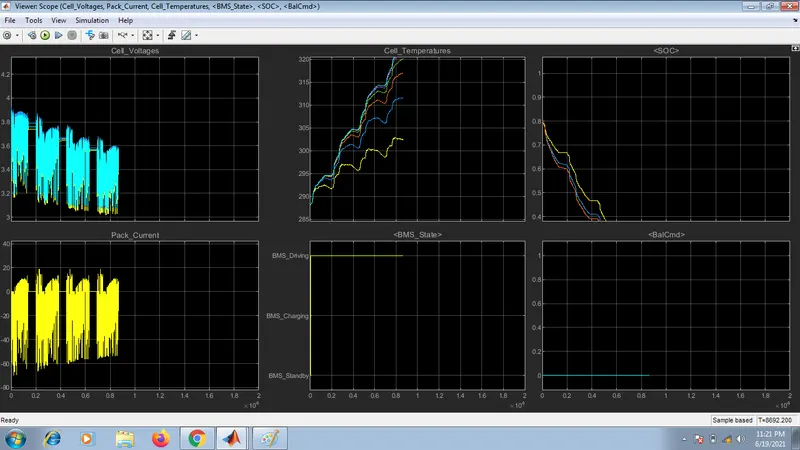
Output results:Comparison of BMS state condition.
a) Discharging Mode/BMS driving:At time instant 0 to end of simulation.
Cell voltage reduced from initial value of 4V.
pack current reduced to 0.
SOC is initially 80% and then reduced to 0%.
cell temperature increased from 289 to 320K.
cell balancing is idle in this time.
Hence there is no fault observed in Dashboard and all indications are green
Test Case 3:
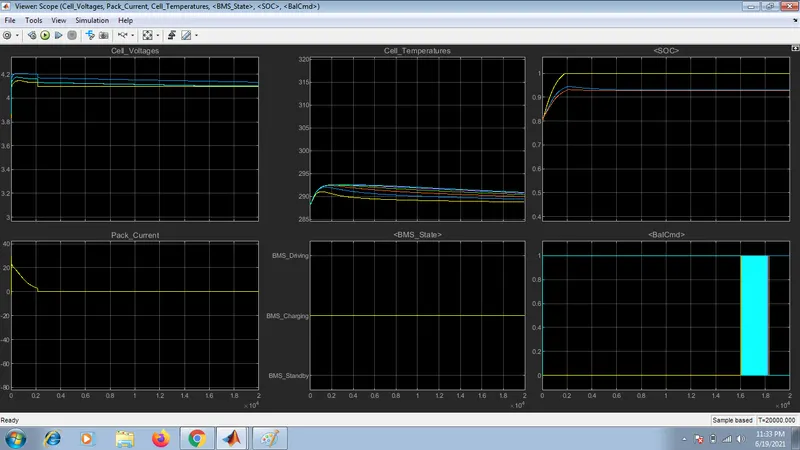
The battery is only in charging mode.
Observations:
1) Since the battery is onllyin charging mode , the sudden change in current from 0 to 30A is seen within first few seconds.The temperature is also rising in all cells.
2) Cell balancing is in process
3) There is a little difference in both the EKF and UKF Kalman filter.The EKF SOC shows 93% where as UKF shows 94%.And in coloumb counting method it is 100%.
Solution 2:
Coloumb Counting:
SOC is a measure of how much charge is available for use in battery.It measures amount of current entering and leaving the battery integrated over a period of time. Coloumb Counter will measure the current supplied or removed from battery over a period of time and it compares to the pre programmed capacity of battery to determine current SOC.
The below model shows the implementation of Coloumb Counting method:
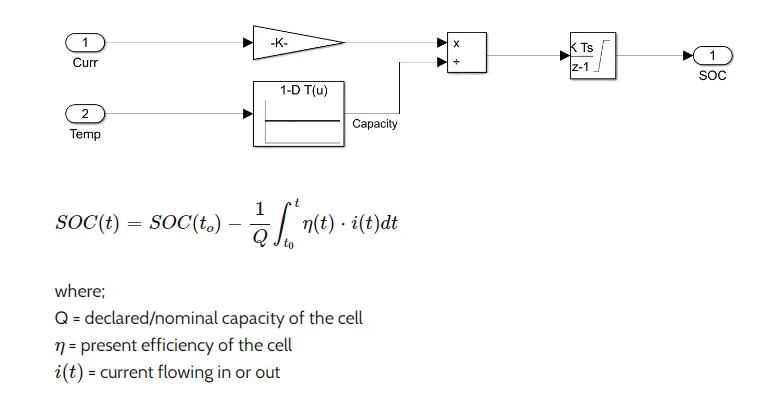
The amount of current entering/leaving the battery is integrated over time and the effect of temperature on capacity is also considered by using a 1-D look up table.
This is one of the method to calculate SOC but it is not reliable as we need to recalibrate SOC everytime the battery is fully recharged.This method does not consider the changing effeciency of cell.With greater Charge/Discharge current ,the temperature of the cell increases, which affects efficiency.
With time ,the pre declared capacity (Q) and effeciency reduces.And reduction in life cycle reduces SOC.