Week 7 State of charge estimation
1.Simulate the 3 test cases from harness dashboard and write a detailed report on the results
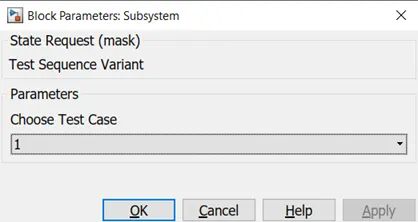
Selecting the First Test Sequence
Result:-
After running the Simulation for about 20000 seconds we observe the following things
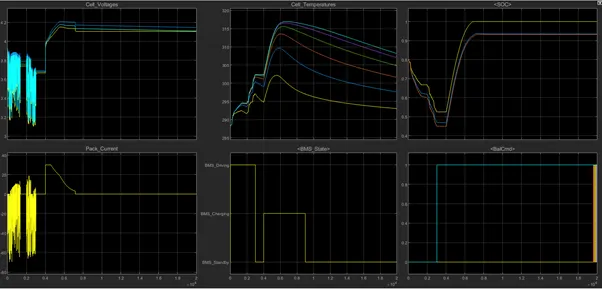
Cell Voltage:- The Cell Voltages fluctuated in the time Interval of 0-3000 sec as the BMS was implementing the Drive cycle. After 3000 sec the BMS was in the Standby mode, therefore a constant value of voltage can be seen. Between 4000-5000 sec we can se the Cell voltages rising because the BMS was in charging mode. The charging occurred from 4000 sec to 9000 sec. At almost 5000 sec we can see that the peak voltage has been achieved and thereby from there onwards constant voltage charging takes place and the Voltage of the Battery pack attains a constant value till the end.
Pack Current:- The Current of the overall battery pack also fluctuated a lot when the BMS was running the Drive cycle. After 5000 sec we observe the graph of the current falling. This is due to constant voltage charging. From 4000 to 5000 sec it was constant current charging. The current then attains a value of 0 as there is no flow detected after charging.
Cell Temperatures:- The Cell Temperatures started to rise when the drive cycle was implanted. After some time we can see that the temperature decreases, because the battery was in Standby mode. While Charging we can again see that there is an increase in the Temperature. This is due to the Constant Current and Constant Voltage Charging. After the desired Voltage is reached, we can see that the cell temperatures decreases.
Various Cells are having different temperatures. This is due to various factors and one of them is arrangement. The cell having greater Temperature is more inside the battery pack and which is having the lowest temperature is almost on the edge of the Battery pack
BMS State:- This graph shows us in which state the BMS is currently in. It is in Driving State from 0 to almost 3000 sec. After 3000 sec it is in Standby mode, till 4000 sec. After 4000 sec till 9000 sec the BMS is in Charging state, and after that again in standby mode.
SOC:- The SOC of the pack gradually falls at the starting of the time until the charger is connected. After connecting it to the charger, we can see the SOC of different cells. The BMS implements an algorithm of Cell balancing so that each an every cell has the same SOC value.
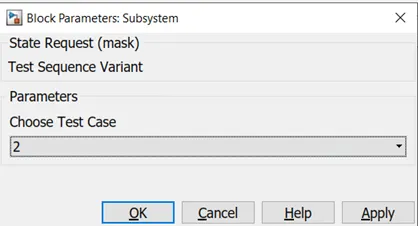
Selecting the Second Test Sequence
Result:-
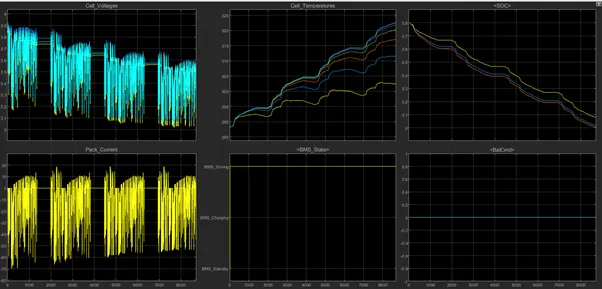
Since the SOC of the battery reaches 0 at the end of almost 8500 sec, the simulation stops running
Cell Voltages:- We can observe that the Voltages of Cells Fluctuates a lot, as the BMS is in Driving mode the whole time. The simulation stops at almost 8500 sec because of complete discharge of the cells as seen from the SOC graph
Pack Current:- The Pack current also fluctuates a lot as the BMS is in driving mode the whole time.
Cell Temperatures:- The Cell temperatures increases and the same theory applies as explained in Test 1
BMS State:- The BMS is only in Driving mode.
SOC:- At the beginning of time the SOC of the Battery was at 80%. At the end of almost 8500 sec the SOC drops down to 0% and the simulation stops running
Selecting the Third Test Sequence
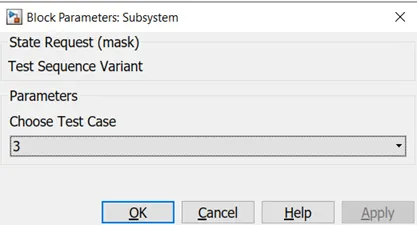
Result:-
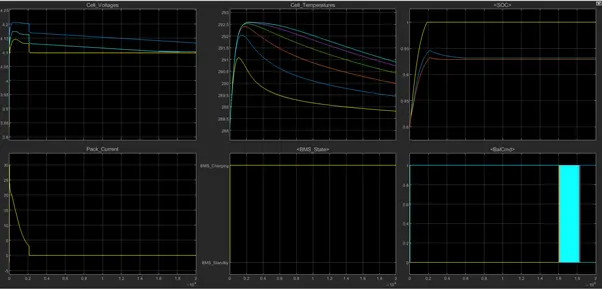
The Test 3 is when the BMS is connected in Charging mode For the whole time.
Cell Voltages:- The Cells were already at the 80% value before charging as seen from the SOC graph. Before attaining 100% SOC we can observe a change in Voltage of different cells. The Voltage increases to its peak, and when 100% SOC is achieved at almost 2000 sec, the voltage drops and attains a constant value of 4.1V.
Pack Current:- At the time of Constant Voltage Charging the Current in the Pack decreases. After achieving 100% SOC value the BMS disconnects the Charger from the Pack and the current remains 0 till the end
Cell Temperature:- The Cell temperature increases while charging and when charging is done, the temperature falls down. Various cells have different temperature in this test also and the same theory applies for this as mentioned in Test 1 of Cell Temperature
BMS State:- Here the State of the BMS is in Charging only.
SOC:- We can observe the state of charge rising from 0 sec till 2000 sec. In this Time the Cells get fully charged and then attains a constant value.
2.What is coulomb counting? Refer to the above model and explain how BMS implements coulomb counting for SOC estimation ?
Hint :(Download the file from the link and go to SOC estimation model-ECU block)
The “coulomb counting” or CoulCount method was developed by Schmitt et al. As a heuristic method, although the underlying theory is reasonably accessible. It depends on the recording of the current noise only. The signal is filtered with a high-pass filter with a cut-off frequency of 0.01 Hz. The filter may be either analogue (although the implementation of a good-quality 0.01 Hz analogue filter is difficult) or digital. The absolute value of the measured current samples is then summed over time. A steep slope is taken as an indication of rapid corrosion, although it is not possible to calibrate this in terms of an estimated corrosion rate.
It can be shown that this method is similar to integrating the standard deviation of current over time. The use of the integrating plot provides a form of low-pass filtering that may make it easier to see trends, but this can also be accomplished by digital filtering. The use of only the current noise restricts the value of the technique, as it does not allow for the estimation of the noise resistance (and hence the corrosion rate), and it is difficult to see what real advantages the method has over the conventional three-electrode method, although the use of integrating plots may be of value.
The Coulomb counting method measures the discharging current of a battery and integrates the discharging current over time in order to estimate SOC. Coulomb counting method is done to estimate the SOC(t) , which is estimated from the discharging current, I(t), and previously estimated SOC values, SOC(t-1) . SOC is calculated by the following equation:
`SOC(t) = SOC(t-1) + ((I(t))/Q_n)* delta t`
But there are several factors that affect the accuracy of Coulomb counting method including temperature, battery history, discharge current, and cycle life
Below is SOC estimation block in the given BMS plant
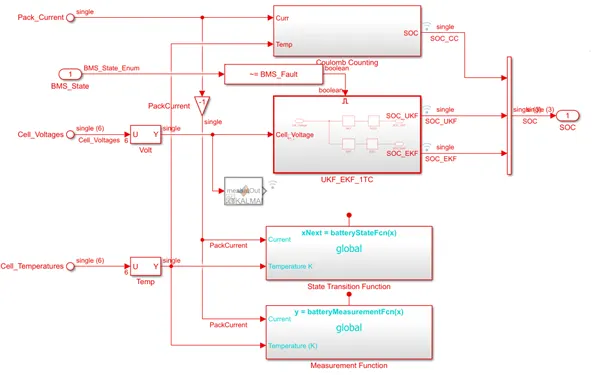
Under this Block there is a coulomb counting block which is shown below
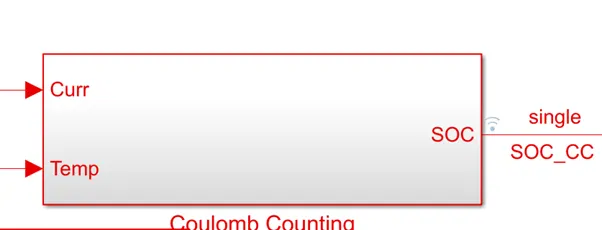
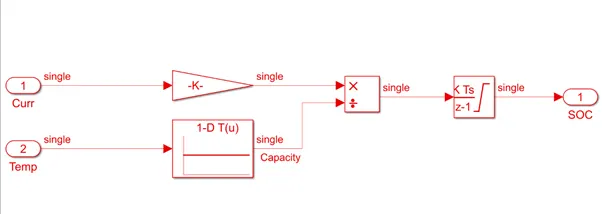
The Coulomb counting is the integration of current over the period of time, and this is done in a Discrete Time Integrator block as shown below
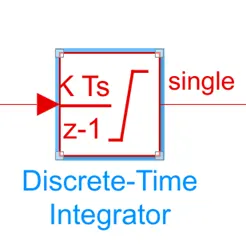
Here the current from ‘1’ is integrated over the period of time with consideration of Temperature of the battery. The Discrete Time Integrator is implemented in Z-transform i.e in Z domain and this will give an idea about the SOC