Week 7 State of charge estimation
WEEK 7 (STATE OF CHARGE ESTIMATION)
Objective:
1.Simulate the 3 test cases from harness dashboard and write a detailed report on the results
2.What is coulomb counting? Refer to the above model and explain how BMS implements coulomb counting for SOC estimation ?
Hint :(Download the file from the link and go to SOC estimation model-ECU block)
Task 1] Downloading and opening BMS harness dashboard project model:
Go to the https://in.mathworks.com/matlabcentral/fileexchange/72865-design-and-test-lithium-ion-battery-management-algorithms and download the required version according to the software version required.
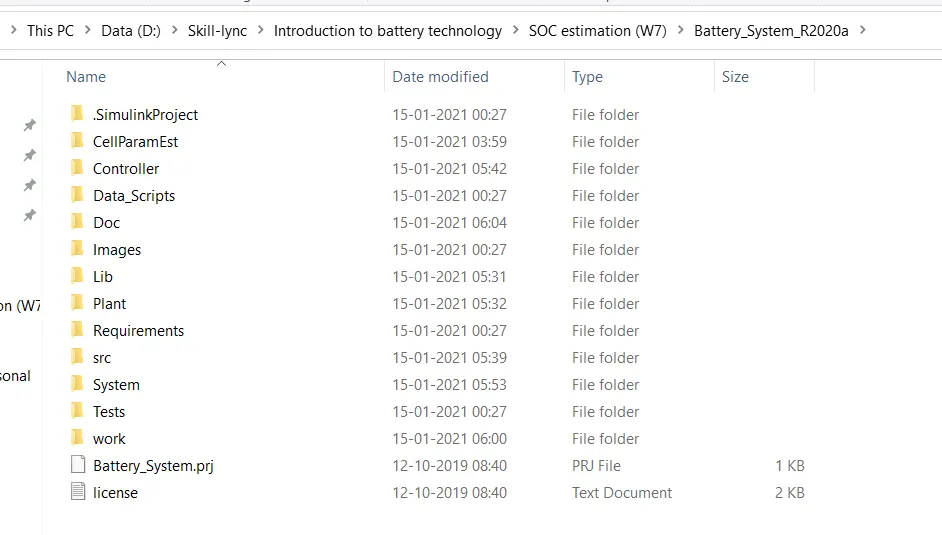
Extract a zip file to a folder. The folder consist of these files as shown below,
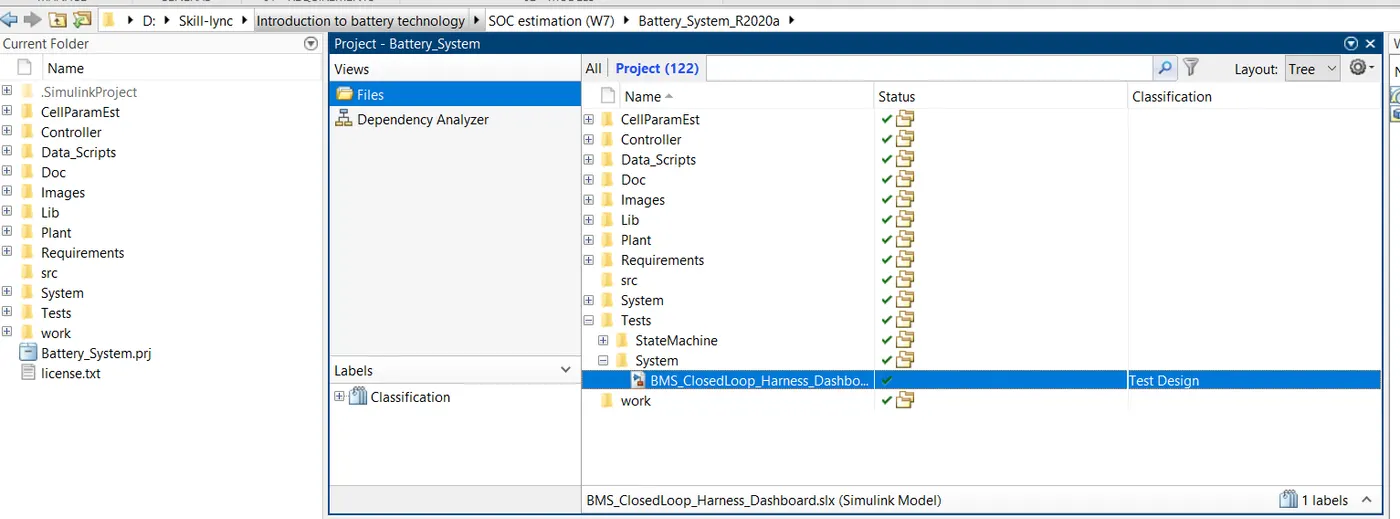
Open the MATLAB application and navigate the current folder to the folder where the project model is present and go to Tests-->System-->BMS_Closed loop_Harness_Dashboard model file.
Open the BMS_Closed loop_Harness_Dashboard model file as shown below.
Blocks in model:
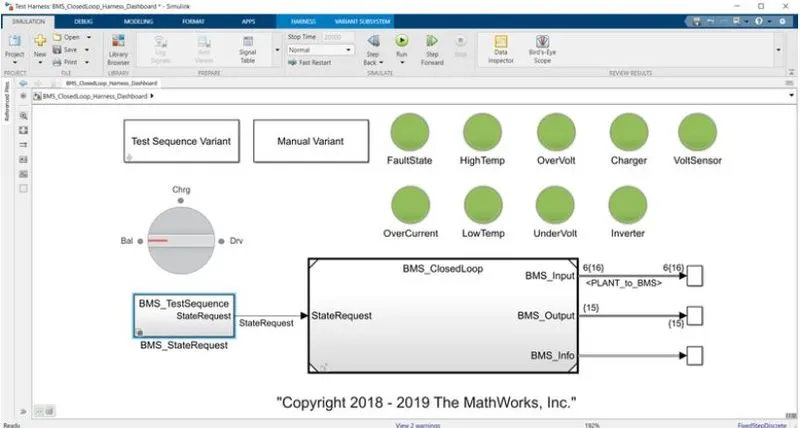
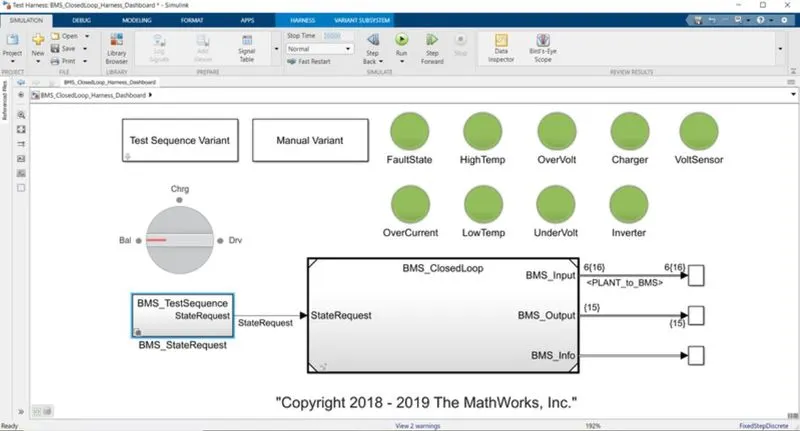
1)Dash board
Ø Test Sequence Variant (Selector).
Ø Manual Variant (Selector).
Ø BMS_Test sequence state request (Subsystem) to provide state request commands.
Ø Lamps to indicate Fault state, High temperature, Over voltage, Over current, charging , voltage sensor, inverter, low temperature, Under voltage. Green light can be seen when the system is in good condition or without faults. Red light can be seen when there is a problem or issue with the respective lamps.
Ø Rotary switch for manual mode changes while running simulation such as Balance, Charge and Drive.
Ø Results can be analyzed by using scope with signals SOC, Module current, Individual cell voltages, Individual cell temperature, Battery state, Cell balancing states.
2) BMS_Closed loop
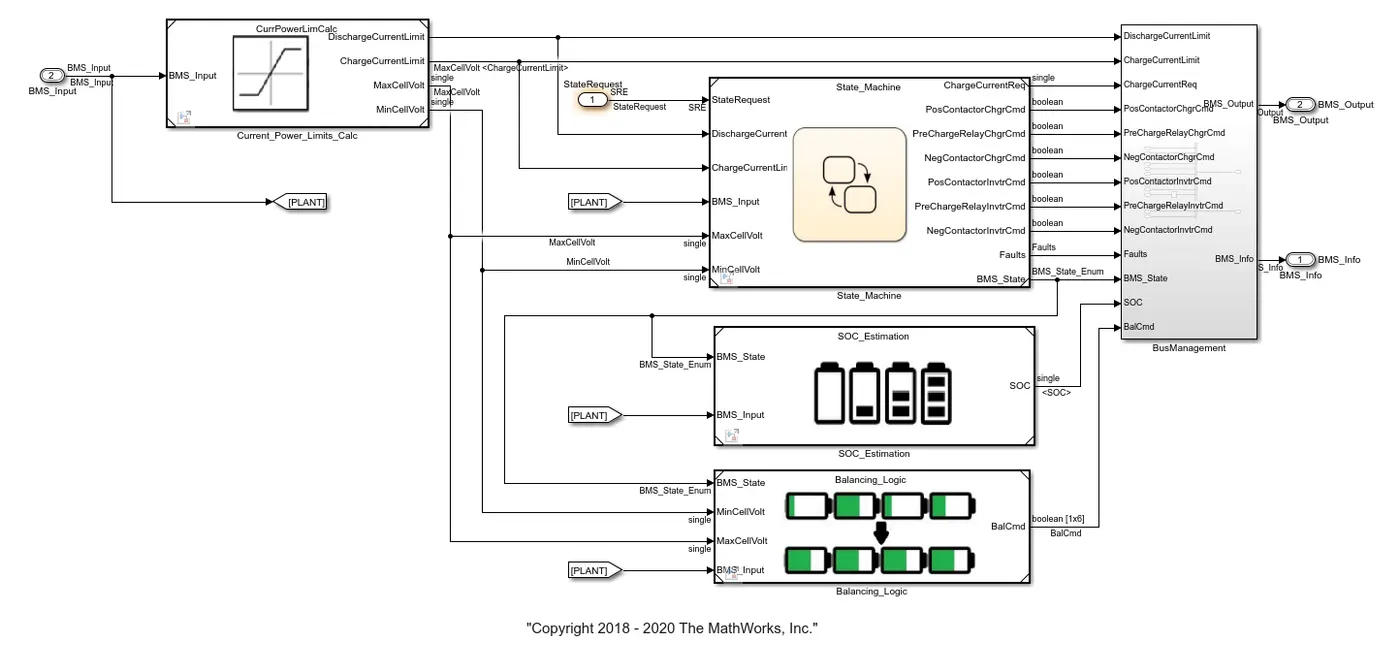
BMS ECU and PLANT units are two subsystems in BMS_Closed loop subsystem.
2.1) BMS ECU
BMS ECU is the software like unit which controls,protects,balance and manage the battery,
It consists of subsystems
Current_Power_Limits_Calc - This block calculates and sets the limit of charge and discharge current, minimum and maximum voltage of cell by taking current, voltage and temperature of the cell.
State_machine - The state_machine using state flow logic to determine the state of machine such as driving, standby, charging by taking input from battery pack characteristics and request of state from user. Fault monitoring changes the state based on the cell current, voltage and temperature and shows the fault. Charger contactor and inverter contactor opens or close based on the state request.
SOC estimation - SOC is accurately estimated by coulomb counting and using the Kalman filters based on the BMS state, input of pack current, cell voltage and temperature.
Balancing logic - This is the subsystem which consist of state machine which will balance the cell according to the BMS state,It will activate balancing or deactivate the balancing according to the BMS state requirements.
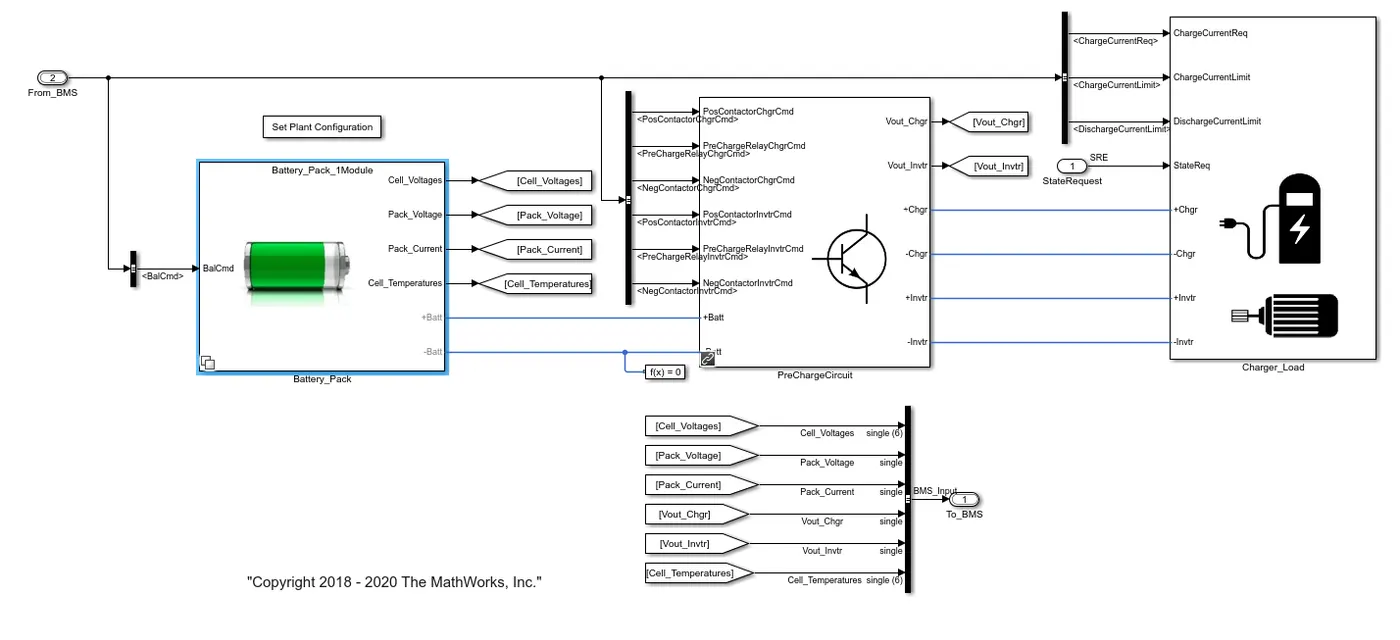
2.2) PLANT
Battery pack - Consists of the cell with configurations of voltage and capacity.
Precharge circuit - It is used to limit the Inrush current to slowly charge the downstream capacitance.
ChargerLoad - Charger subsystem is with controlled current source which charges the battery according to the BMS state and drive load subsystem consist of load requirements of the drive cycle which draws the current and discharge the battery according to the load.
After the compilation is successful the scope opens up. The scope consist of the measurements of cell voltages,cell temperatures,SOC,pack current,BMS State,Balancing command.
Results:-
Test case 1:Procedure:
Select the test sequence variant as 1 and inside the BMS state request subsystem the test sequence 1 is selected.
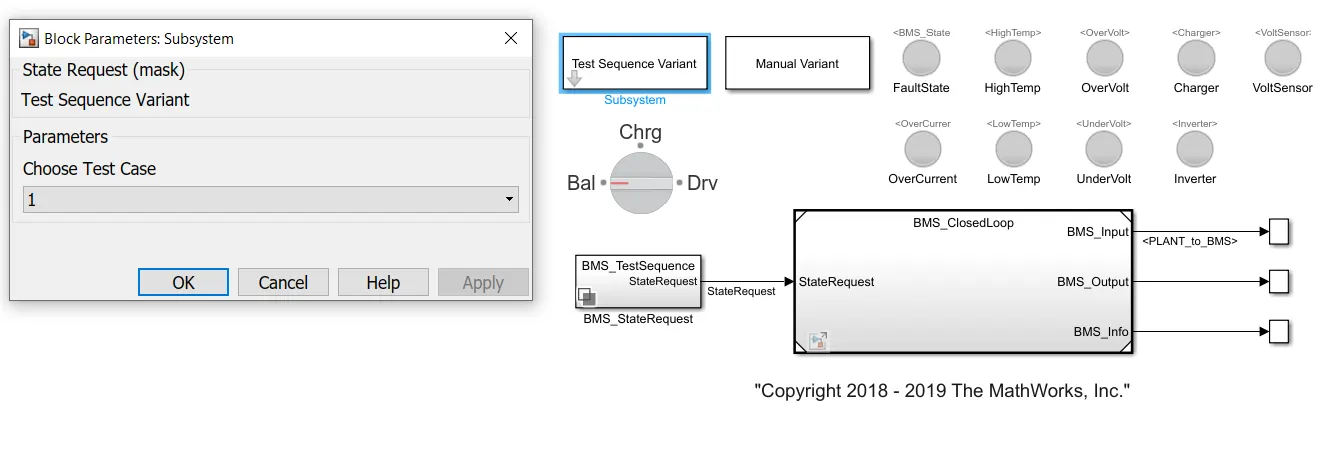
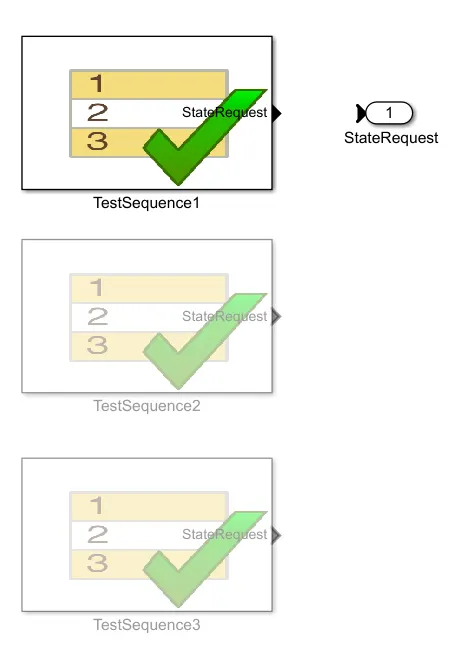
Double click on the test sequence it will open the sequence editor as shown above
Ø Driving state for the first 3000 sec.
Ø Then after driving state Balancing of cell occurs for the next 1000 secs duration.
Ø After the balancing Charging and balancing occur for next 5000 secs
Ø Post Charge Balancing is occurring after 9000sec till 20000 secs simulation end time.
Results of Test case 1:
Dashboard results:
The Lamp indication were green for all states which means the model is in good condition and no fault is occurred.
Scope of test sequence 1:
Observations:
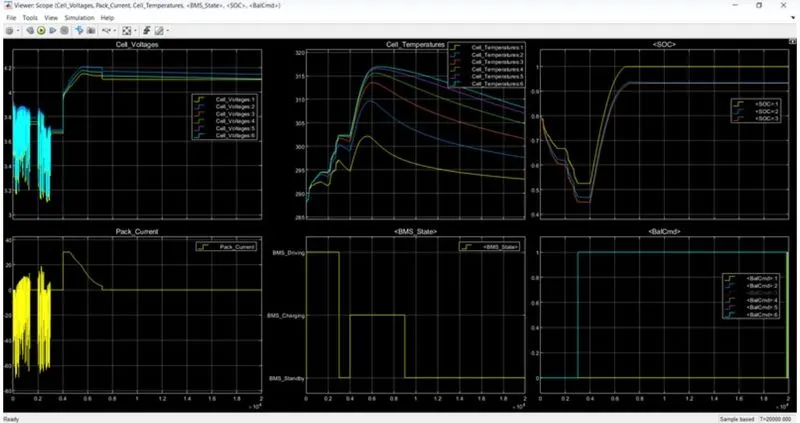
Driving state (0-3000 secs):
Ø During the first 3000 secs, all the cells are in the driving state, which causes all of the cells to discharge. The range of discharge is 3.1 to 3.9 V (minimum and maximum).
Ø The temperature of the cell rises to 302 K from 288 K.
Ø Moreover, SOC drops from 80% to 45%.
State of Balance (3000–4000 seconds):
Ø Cell balancing occurs after 3000 seconds for 1000 seconds, at which point the modules enter standby mode and maintain a steady voltage of roughly 3.7V.
Ø As no current passes through the cells during balancing, the temperature of the cells gradually drops.
Ø Moreover, SOC stays steady at 45% during this time.
State of charging and balancing (4000–9000 seconds):
Ø Following 4,000 seconds, the cell voltage rises from 3.7 to around 4.2 V in constant current mode with a current of approximately 30 A. Subsequently, the constant voltage charging commences, and the current drops from 30 A to 2.5 A. Cells continue to charge and balance for nine thousand seconds.
Ø Additionally, cell temperature begins to climb exponentially up to the constant current area and then decreases when the constant voltage mode's current flow decreases.
Ø Moreover, SOC rises from 45% to 94%.
Condition of post-charge balancing (9000- 20000 sec):
Ø The post-cell balancing enters standby mode after 9000 seconds.
Ø In this phase, the cell temperature lowers and attempts to approach the surrounding air temperature.
Ø SOC doesn't change up to 94%.
Test case 2:Procedure:
Select the test sequence variant as 2 and inside the BMS state request subsystem the test sequence 2 is selected.
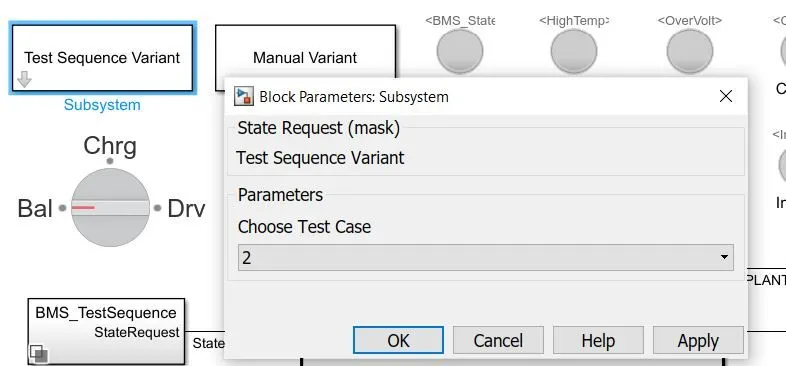
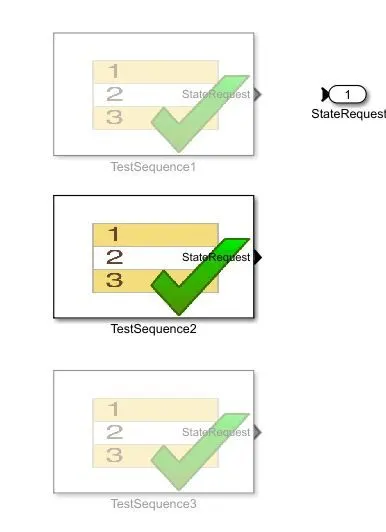
Double click on the test sequence it will open the sequence editor as shown above
Driving state for first 10000 secs.
Then Charging state for next 10000 secs.
Results of Test case 2:
Dashboard results:
The Lamp indication were green for all states which means the model is in good condition and no fault is occurred.
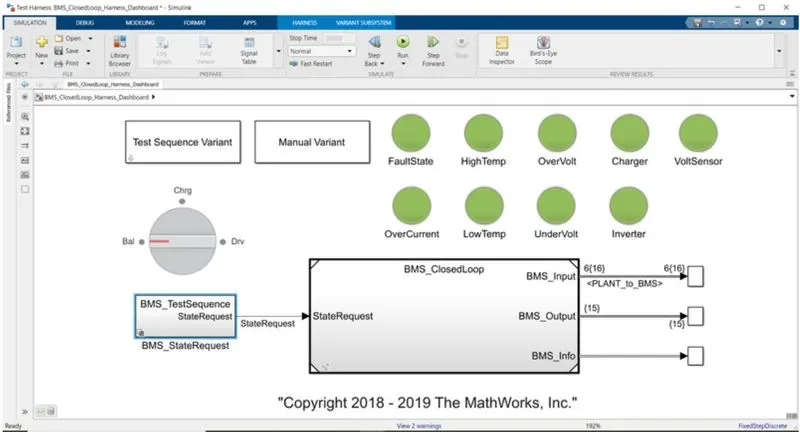
scope of test sequence 2:
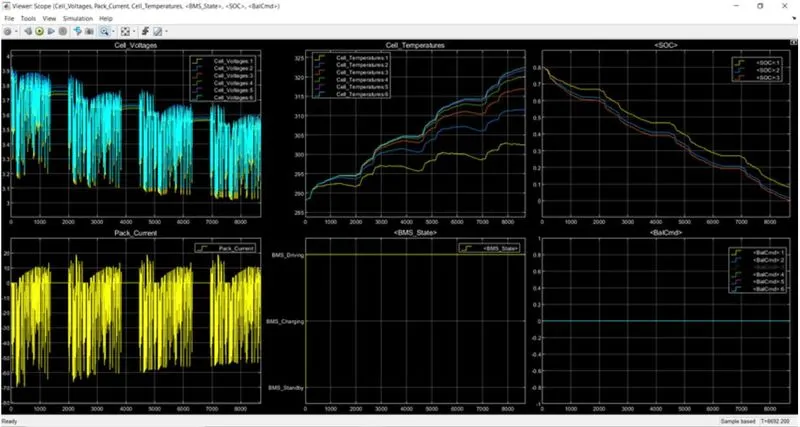
Observations:
Driving State (0-10000 sec):
Ø The voltage of the battery ranges from 3.9 V to 3.05 V, which is the cut-off value. The cell is completely drained in 8690 seconds.
Ø The temperature of the cell ranges from 288K to 323K.
Ø In the drive mode, the SOC drops from 80% to 0% (complete cell drain) in less than 8690 seconds.
Ø In between the drive modes exist some standby mode circumstances.
Ø All of the sequence is operating in drive mode, as the plot above illustrates.
Ø Cell balancing is not carried out as depicted because balance states are at 0 during the whole drive mode.
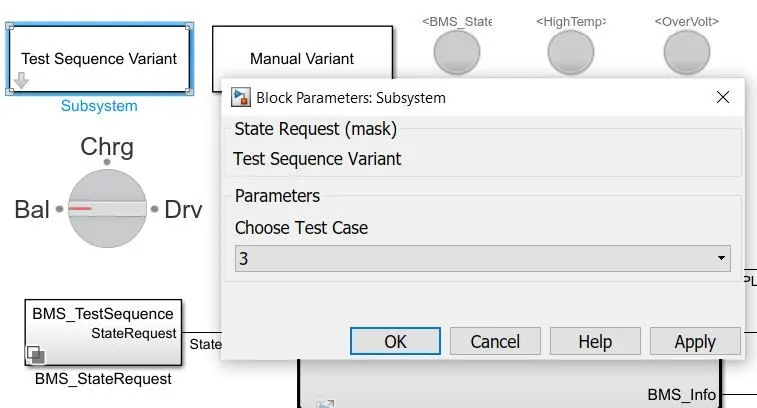
Select the test sequence variant as 3 and inside the BMS state request subsystem the test sequence 3 is selected.
double click on the test sequence it will open the sequence editor as shown above
Results of Test case 3:
Dashboard results:
The Lamp indication were green for all states which means the model is in good condition and no fault is occurred.
scope of test sequence 3:
Observations:
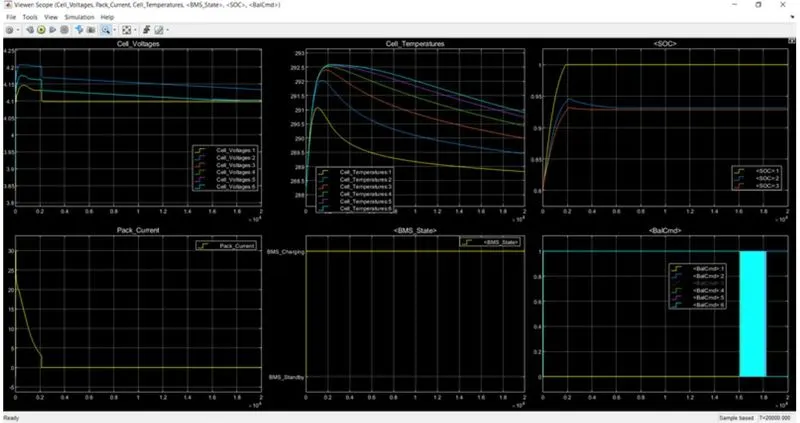
Charging state (0-20000 sec):
Ø Cell voltages rise from their starting points and become steady after 2000 seconds.
Ø Pack current starts at 0 A and goes up to 30 A initially. When the constant voltage mode is present, it starts to decrease to 2.5 A and fully charges in 2000 seconds.
Ø SOC was originally 80% and reached 100% charge in 2000 seconds.
Ø The temperature of the cell rises initially, reaching room temperature after the battery is fully charged.
Ø As seen above, the entire battery pack process is in charging mode.
Ø At the conclusion of the simulation, all cells are balanced.
Conclusion:
All the three test sequences of battery management systems are simulated and analyzed for various characteristics and results are plotted and observed.
Task 2] What is coulomb counting? Refer to the above model and explain how BMS implements coulomb counting for SOC estimation ?
SOC: SOC is an acronym for a battery's state of charge. When a battery is fully charged, its state of charge (SOC) is the proportion of total energy in the battery that is still inside. SOC can assist a user in figuring out when to stop charging a battery and how much energy can be taken out of it at that particular moment. A Li-ion battery cannot have its SOC directly calculated, but there are a few different approaches we can take with the aid of a few extra parameters.
Battery voltage translation is the simplest way to determine a battery's state of charge (SOC). While not exact, this method can be used to rapidly and roughly compute state of charge (SOC) in devices such as power banks, where SOC is displayed as a range rather than a precise percentage. A standard power bank, for instance, displays a SOC between 0 and 25%, 25 and 50%, 50 and 75%, and 75 and 100%.
The Coulomb counting method, the fuzzy logic method, the Kalman filter, the RBF neural network, the fuzzy neural network, the hybrid methods, etc. are some of the more precise approaches that are required because of the limitations of this method.
When choosing methods for SOC estimation, careful consideration should be given to each one's limitations, accuracy, and complexity.
Coulomb counting:
One method for monitoring a battery pack's state of charge is coulomb counting. In order to calculate the total amount of energy entering or leaving the battery pack, it integrates the active flowing current (measured in amps) over time. This yields a capacity that is commonly expressed in ah.
Coulomb Counting Method :
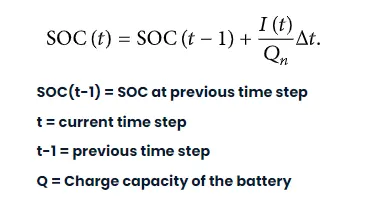
The battery current integration method is another name for the coulomb counting method. This method determines the amount of energy left in the battery by measuring and integrating a discharging/charging current I(t) over time. By using this method, the SOC is determined at the previous time step, SOC(t-1), and the energy added or subtracted at the current time step is added to or subtracted from the SOC of the previous time step, SOC(t-1) to determine the current amount of energy in the battery.
The SOC estimation in the coulomb counting method is done using the below equation,
This method is accurate and reliable than the voltage translation method but does not take into account the discharge rate, temperature, hysteresis, age of the battery, etc.
Coulomb counting block in BMS:
soc estimation block:
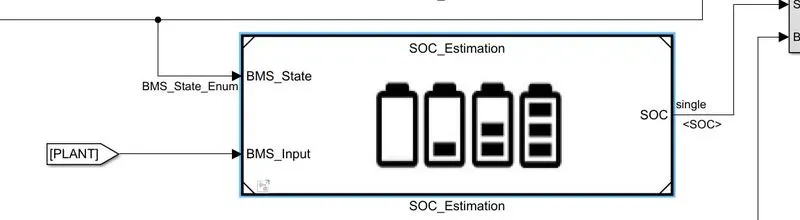
Here soc is estimated by
i) Coulomb counting method
ii) Unscented Kalman filter
iii) Extended laman filter.
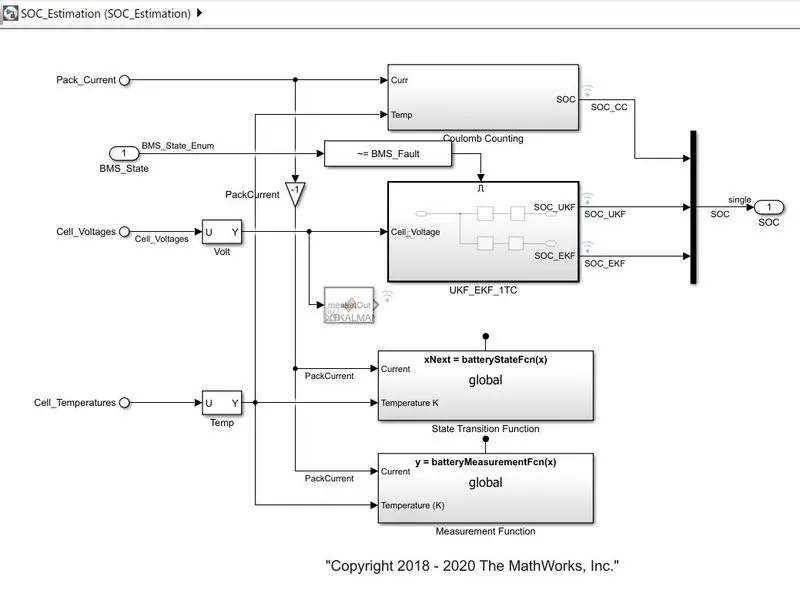
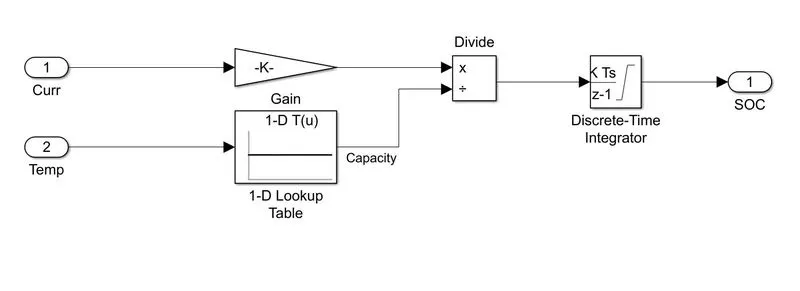
Coulomb counting method:
This block implements the above mentioned soc equation to estimate the SOC.
In this method, a discharging/charging current I(t) is measured and integrated over time to calculate the amount of energy remaining inside the battery.
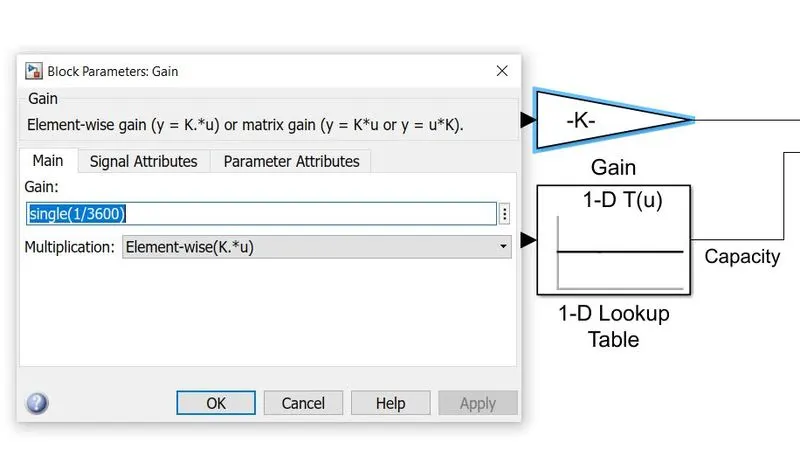
Gain value is given as 1/3600 to convert the current in A to Ah.
Discrete time integrator block and its configuration:
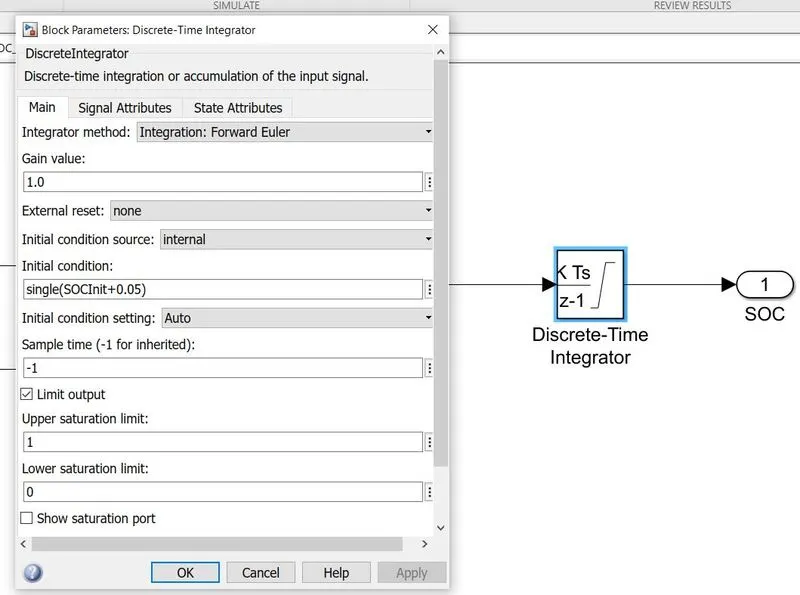
Thus the BMS system implements the SOC equation using above blocks to estimate the SOC.