Week 7 State of charge estimation
Objective-1:
Simulate the 3 test cases from the harness dashboard and write a detailed report on the results
Ans:
Battery management system:
A battery management system (BMS) is an electronic system that manages a rechargeable battery, such as by protecting the battery from operating outside its safe operating area, monitoring its state, calculating secondary data, reporting that data, controlling its environment, authenticating it and/or balancing it.
Functions of BMS:
1-Monitor:
A BMS may monitor the state of the battery as represented by various items, such as:
- Voltage: total voltage, voltages of individual cells, or voltage of periodic taps
- Temperature: average temperature, coolant intake temperature, coolant output temperature, or temperatures of individual cells
- Coolant flow: for air or fluid cooled batteries
- Current: current in or out of the battery
2- Fuel Gauge / Current Measurements
The fuel gauge functional block keeps track of the charge entering and exiting the battery pack. A charge is the product of current and time. There are several different techniques that can be used when designing a fuel gauge. A current sense amplifier and an MCU with an integrated low-resolution ADC is one method of measuring the current. The current sense amplifier operates in high common-mode environments and amplifies the signal, enabling higher resolution measurements. This design technique sacrifices dynamic range. Other techniques are to use a high-resolution ADC or to purchase a costly fuel gauge IC. Understanding the behaviour of the load in terms of current consumption versus time determines the best
type of fuel gauge design.
3- Cell Voltage and Maximizing Battery Lifetime
Monitoring the cell voltage of each cell within a battery pack is essential in determining its overall health. All cells have an operating voltage window that charging and discharging should occur to ensure proper operation and battery life. If an application is using a battery with lithium chemistry, the operating voltage typically ranges between 2.5V and 4.2V. The voltage range is chemistry dependent. Operating the battery outside the voltage range significantly reduces the lifetime of the cell and can render the cell useless.
4- Temperature Monitoring
Temperature sensors monitor each cell for energy storage system (ESS) applications or a grouping of cells for smaller and more portable applications. Thermistors powered by an internal ADC voltage reference are commonly used to monitor each circuit’s temperature. The internal voltage reference is used to reduce inaccuracies of the temperature reading versus environmental temperature changes.
5- State Machines or Algorithms
Most battery management systems require an MCU or an FPGA to manage information from the sensing circuitry and to make decisions with the received information. In a select few offerings, such as Intersil’s ISL94203, the algorithm is encoded, with some programmability, digitally enabling a standalone solution with one chip. Standalone solutions are also valuable when mated to an MCU because the state machine within the standalone can be used to free up MCU clock cycles and memory space.
6- Other BMS functions
Other BMS functional blocks include battery authentication, a real-time clock, memory and daisy chain. The real-time clock and memory are used for black-box applications where the RTC is used for a timestamp and memory are used for storing data, allowing the user to know the battery pack’s behaviour prior to a catastrophic event.The battery authentication block prevents the BMS electronics from being connected to a third-party battery pack. The voltage reference/regulator is used to power peripheral circuitry around the BMS system. Finally, daisy chain circuitry is used to simplify the connection between stacked devices. The daisy chain block replaces the need for optical couplers or other level shifting circuitry.
BMS block diagram:
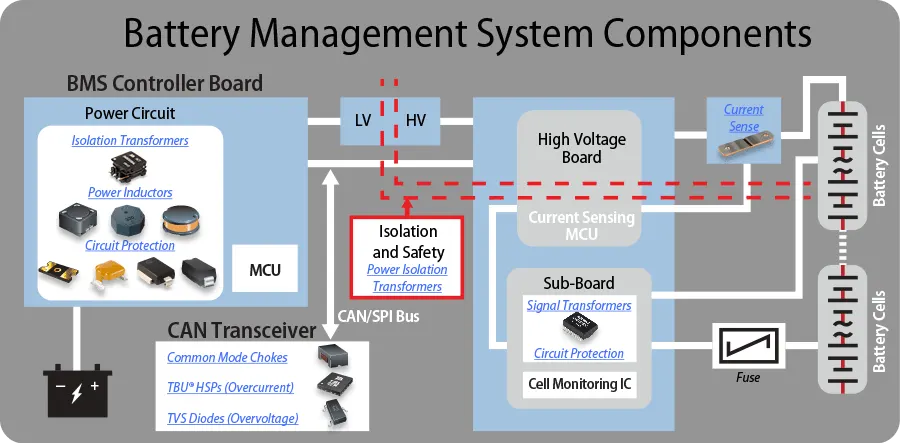
BMS components:
Matlab model of BMS:
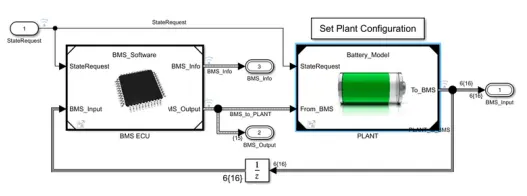
- This model has two main blocks BMS ECU and PLANT block.
- The plant represents a battery and ECU represents software in Matlab and Simulink environment.
Plant subsystem:
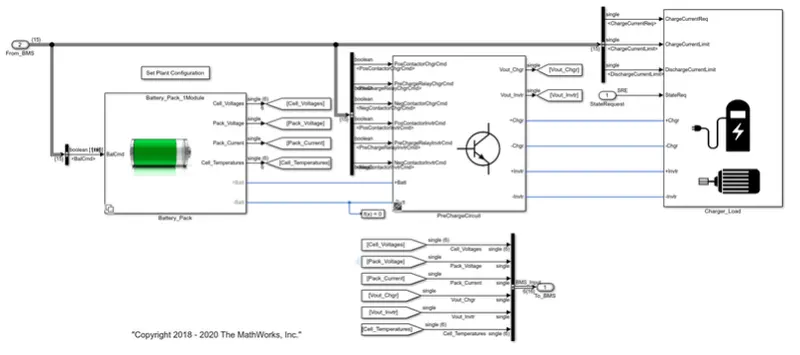
- This plant subsystem consists of 3 blocks battery pack, pre charger circuit and charger block.
- The Pre charger circuit is connected to the charger and load as the motor which is connected through the inverter and charger wires to the precharge block.
- Charger and load subsystem consists of charger and motor block which are connected in a parallel configuration.
Charge and load subsystem:
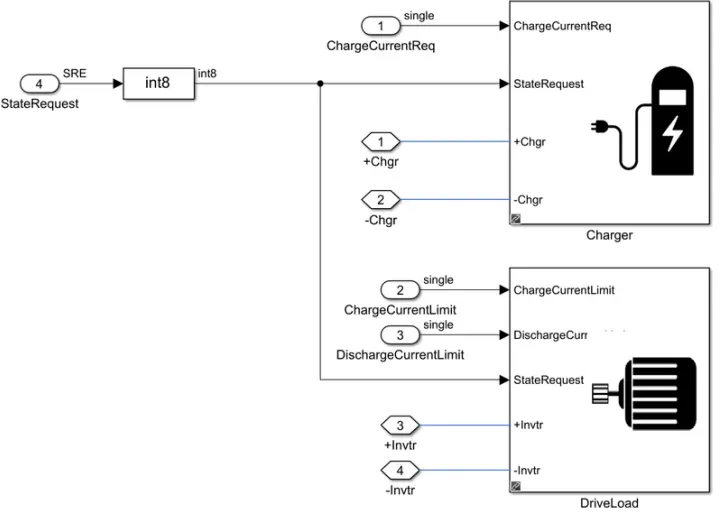
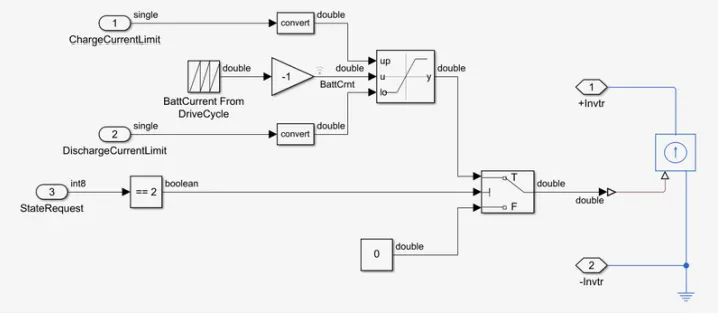
- This subsystem represents DC driver load.
- This will implement the battery current from the drive cycle this is virtually creating the current draw.
- The current source depends on the battery current drive cycle block.
- This will charge and discharge the battery block.
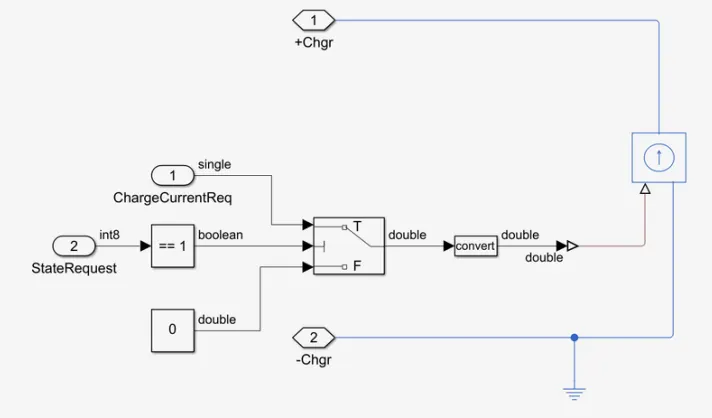
- This will charge the battery in the reverse direction.
- Here the equations represent the charging of the battery in a continuous state.
- This is a continuous charging source.
Battery pack subsystem:
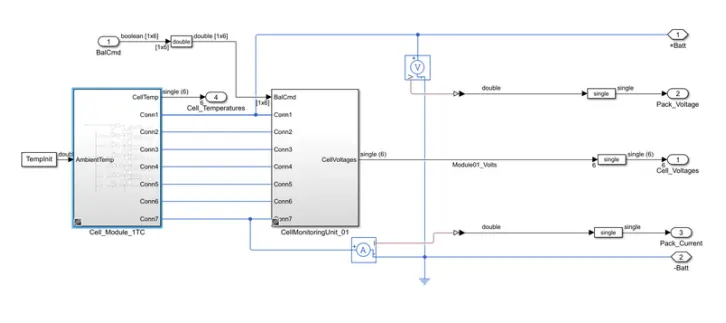
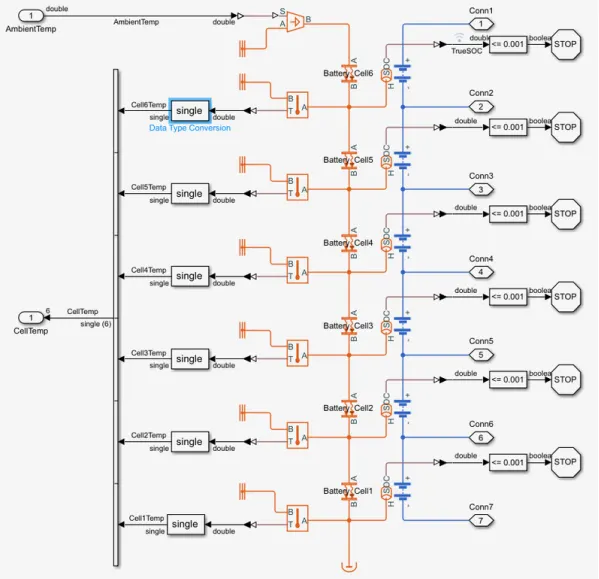
- This represents a cell module block in which we have two sets one is 6 cell and another is 16 cell modules.
- From 1 cell module block, we get 6 cells connected in series with the temperature port is enabled to calculate the temperature of each cell and gives to the multiplexer through which it will be given to the BMS circuit.
- Connection 1 port gives us the battery positive and 7 connection port gives us the battery pack negative.
- We can observe here that the current sensor block is been connected in series to the negative port which will give output as pack current value
Precharge circuit subsystem:
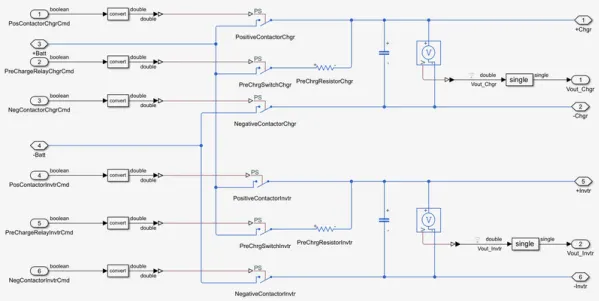
- Basically, the precharge circuit connects and disconnects the pre-charge resistor for the inverter of charger.
- Here two resistors are used as the current direction is reversed in the circuit.
- precharge relay commands are the input signals which are used to control the contactor in the circuit which will on and off the circuit.
Testing harness dashboard model:
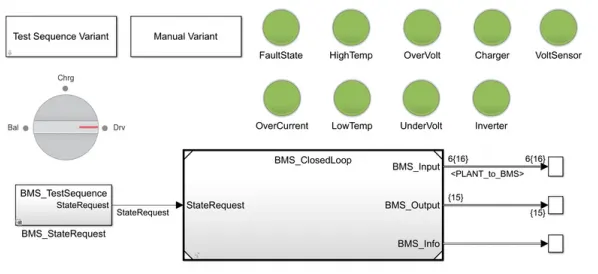
- This dashboard will show us the current situations of the BMS and the faults in the system.
- If there is green light glowing then there are no faults or if a red bulb glows then there is some fault in the system.
- We also can observe BMS status on the left-hand side knob like a block in which it will show whether the BMS is charging or driving or in a balanced state.
BMS ECU subsystems:
Charging and discharging block:
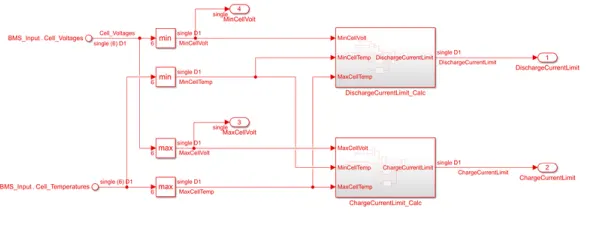
- In this block current and power, limit is controlled by two block one is for the charge current limit and another is the discharge current limit.
- Based on 6numberof cells connected in series and minimum or maximum cell voltage current or temperature the limits are calculated for discharge and charge.
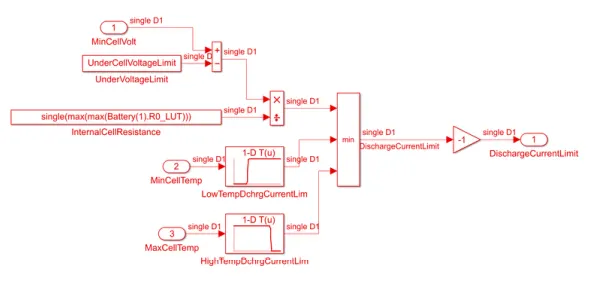
- Below are the equation representation in blocks format for discharge and charging calculations.
Discharge current calculation subsystem:
Charge current calculation subsystem:
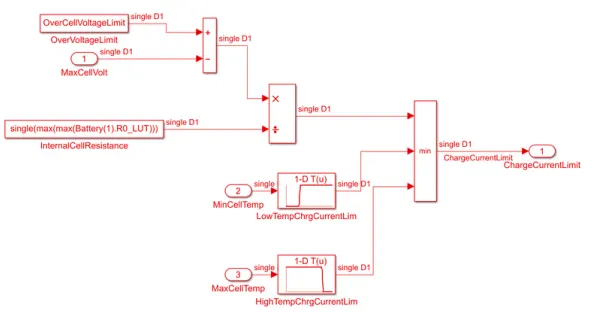
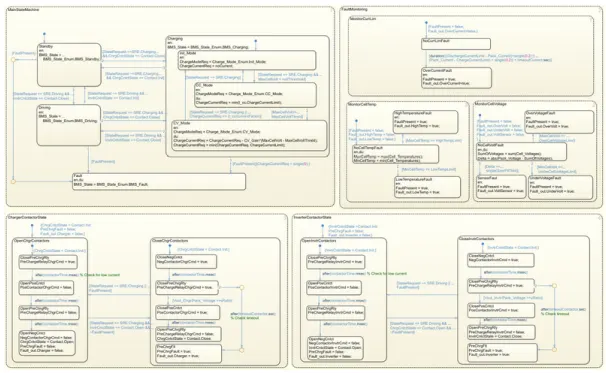
- These all are the algorithms that are going to run inside the state machine block.
- There will be a blue indication while which block or which algorithms are running.
- All cell voltage cell current and also temperature-related calculation algorithms are going to run inside the state machine block.
- The output of the state machine is given to the BMS dashboard.
- There are 3 states at which we have to run the Matlab BMS model.
Result:
Input test signal-1:
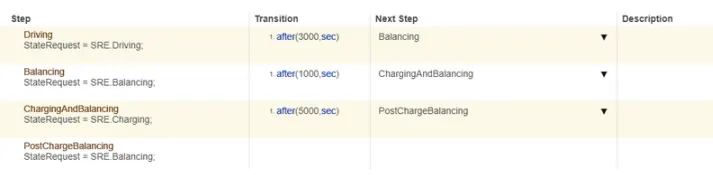
Here initially battery is 100% charged and the battery is in the driving condition for 3000 sec and then it goes under standby condition for balancing the circuits it is for 1000 sec and then after standby, there is a charging period where SOC of the battery is raised to 100% this process takes 5000sec and the ageing same procedure continues.
Output:
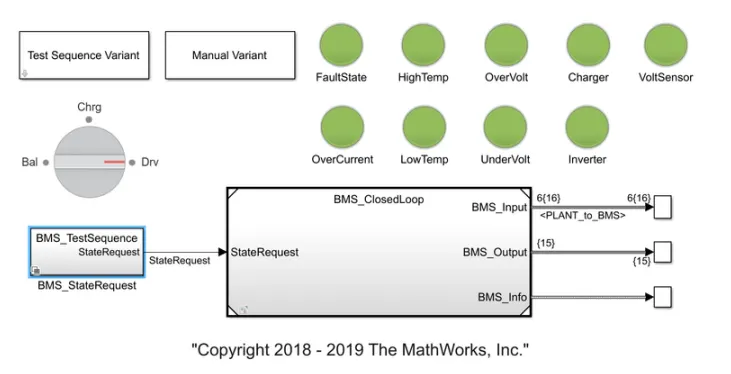
Here in the dashboard, we can observe that all green LED's are glowing which means there is no fault in the system.
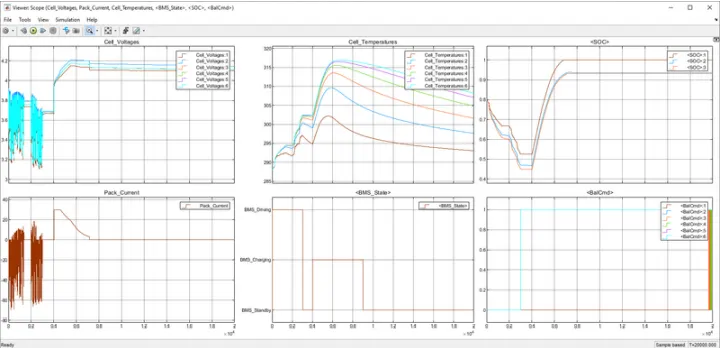
We have a total of 6 plots in the output scope.
- The first plot shows us the cell voltage where it is in driving condition and the maximum voltage attend by the cell is 4.2V. While in driving state we can observe the fluctuations in the voltage which shows the drive cycle and when the battery is in balancing mode there is stand voltage there is no voltage drawn from the circuit.
- Pack current plot shows the combination of the drive cycle and as we know the load current is implemented by repeating cycle block which will discharge in form of a signal with different certain magnitudes. Negative current represents the discharging state and positive represents the charging state.
- While BMS is rising cell temperature are increasing. We have different temperatures of each cell this is due to the placement of each cell are different as we go to the centre of the battery pack the cell temperature will be more as compared to the outside cell.
- We have to control the difference between this temperature this should be not maximum as this would change the capacity of that particular cell with a higher temperature.
- As the Initial state of SOC was 75% then while in driving condition SOC reduces to 60% and there is a standby period where the SOC is constant and after the charging period the SOC level rises to 100% again.
- The sixth plot shows the cell balancing command for all six cells. The 1st cell is having the lowest voltage does not need balancing thus we can see that all the other cells signal to have a
the magnitude of 1 whereas the 1st cell signal is at zero magnitudes
Input test signal-2:

Output:
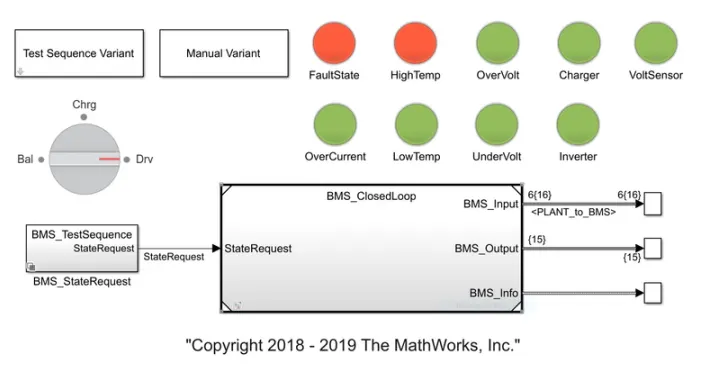
Here we can observe on the dashboard that 2 led are growing as red because there are some faults in the battery pack system.
Result:
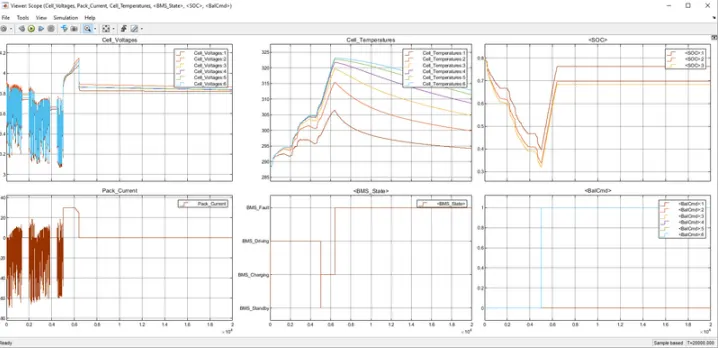
- First plots show the voltage of the cell. when the cell is in a discharged state there s some fluctuations on the negative side and when it's on standby the signals are at rest and while in charging signal level rises.
- The second plots show the pack current till 5000sec the current is getting discharged and after that, there is a charging state where some error occurs.
- In third plot temperature of cells are shown in which we can observe there is some fault as the cell6 voltage has reached its maximum level of about 323.5k and the battery is sent to fault state and further process is at standby.
- The fourth plot is showing the input state has found some error at 6000secs.
- The fifth plot shows us the SOC of the 6 cells which are decreasing when the battery is discharged and while it is charged the curve gain rises and it goes up to 100%.
- The sixth plot shows the cell balancing command for all six cells. The 1st cell is having the lowest voltage does not need balancing thus we can see that all the other cells signal have a magnitude of 1 whereas the 1st cell signal is at zero magnitudes. The cell balancing starts when the battery starts to charge and at the onset of the fault the battery charging is stopped but the balancing happens.
Input test signal-3:

Output:
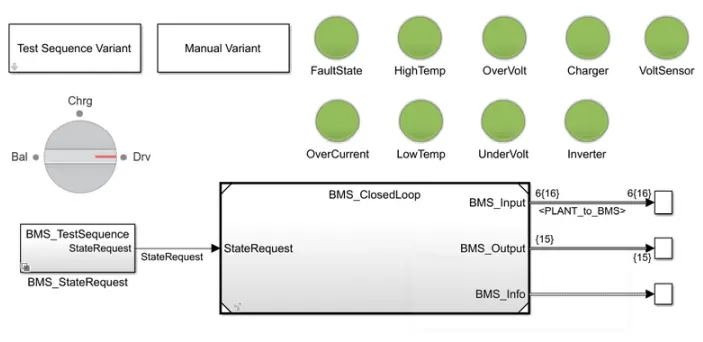
Here in the dashboard, we can observe that all green LED's are glowing which means there is no fault in the system.
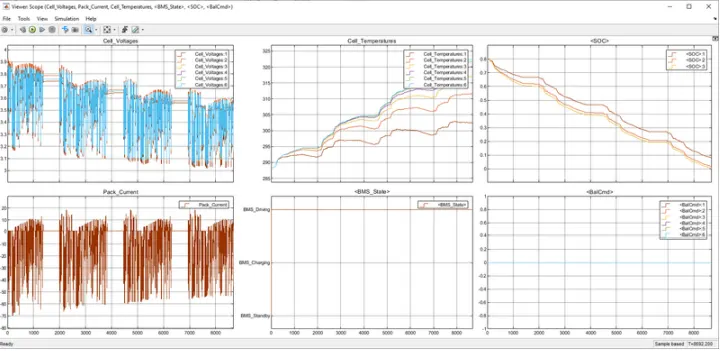
Result:
- The first plot with Cell Voltages displays the voltages of all 6 cells connected in series. The cell voltage keeps on dropping as the battery keeps on discharging up to zero states of charge and
the simulation is stopped. - The second plot with Pack_Current represents the current drawn and given to the battery while charging and discharging. Here we can see that battery repeats charging and discharging
pattern as explained above in the charging and discharging load. - The third plots the cell temperature of all individual cells and we can see then while charging and discharging the cell temperature increases.
- The fourth plot shows the input state as per the given state input, the simulation only runs in discharging mode and when the SOC reaches zero the simulation is stopped at about 8692
seconds. - The fifth plot shows the state of charge of the entire pack by 3 different methods of calculation. The soc curve decreases as we discharge the battery and increases while charging. Here the battery keeps on discharging as the regenerative charging is very less.
- The sixth plot shows the cell balancing command for all six cells. The cell balancing does not take place as the simulation runs only in driving state
============================================================================
Objective-2:
What is coulomb counting? Refer to the above model and explain how BMS implements coulomb counting for SOC estimation?
Ans:
Coulomb counting is a technique used to track the State of Charge of a battery pack. It works by integrating the active flowing current (measured in amps) over time to derive the total sum of energy entering or leaving the battery pack. This produces a capacity that is typically measured in Amp-hours.
As we observe the SOC of the cells were different this is due to the different calculation which is done in SOC simulation and balancing block.
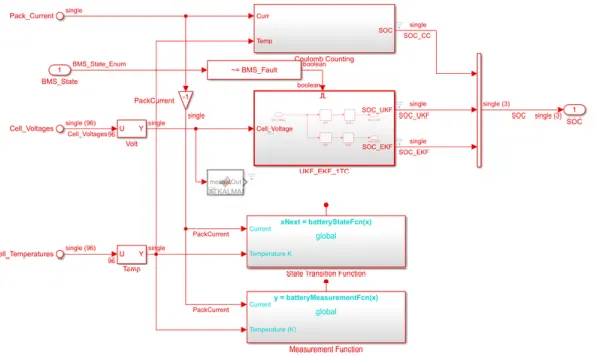
Coulomb counting equation subsystem:

- SOC estimations work in 3 different formats. The first block represents the coulomb counting block and the second block represents UKF and EKF block.
- In UKF and EKF there are a set of algorithms that will calculate the SOC values using the Kalman filtering process.
- The coulomb counting is the integration of the current over the period of time in the discrete-time integrator.
- Here the current is been integrated by taking temperature into consideration.
- Discrete-time integrator blocks work in Z-domain.
- Temperature values taken into consideration are fed in lookup table form.
- Here the SOC idea is get simply by Discrete-time integrator block.