Week 7 State of charge estimation
Battery management system:
Battery management system (BMS) is technology dedicated to the oversight of a battery pack, which is an assembly of battery cells, electrically organized in a row x column matrix configuration to enable the delivery of a targeted range of voltage and current for a duration of time against expected load scenarios.
The oversight that a BMS provides usually includes:
- Monitoring the battery
- Providing battery protection
- Estimating the battery’s operational state
- Continually optimizing battery performance
- Reporting operational status to external devices
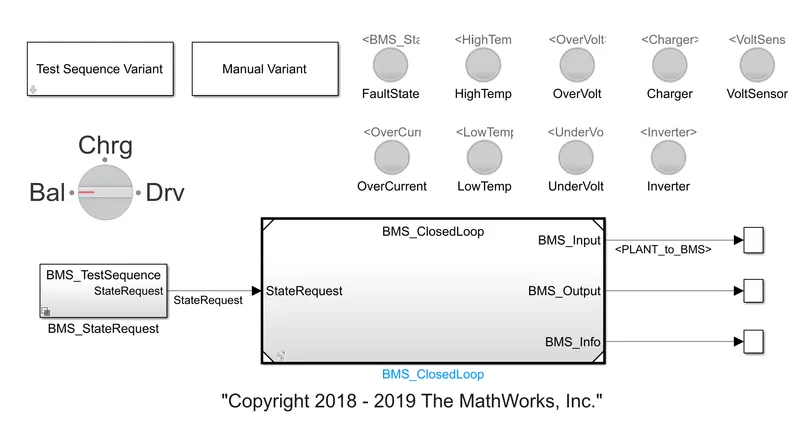
BMS_ClosedLoop_Harness_Dashboard.slx :
TEST CASE 1 :
Test sequence 1 was selected from the Test Sequence Variant block.
Now, inside the BMS_StateRequest > BMS_TestSequence > TestSequence1, we can see:

This shows when the simulation starts, the model will be driving and the SOC starts decreasing. After 3000 seconds the system will be in standby mode and after 1000 seconds it will be in balancing mode and the vehicle is in standby condition. After another 1000 seconds, the vehicle will be in the charging phase, and the battery's SOC is expected to increase by approximately 100%. The next phase is the post-charging phase in which the vehicle will again go into standby mode.
Simulation results:
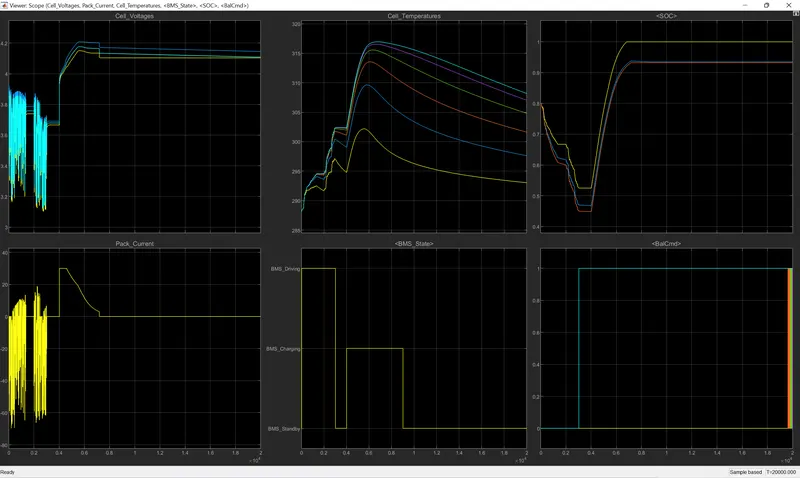
Simulation run time =20,000 sec
Observations:
- It can be observed in the BMS_State plot in which the vehicle initially undergoes driving, then charging till the SOC reaches 100% according to the coulomb counting block, and then later in the standby state.
- During Charging the Battery pack voltage reaches 4.2V.
- The cell temperature increases during the driving and charging cycle and starts decreasing in the standby mode. The cells in the middle of the pack experience a much more rise in temperature than the others which results in the rise of internal resistance.
- The Current supplied to the EV during the driving phase due to regenerative braking can be seen in the current plot.
- It is also observed that the constant current charging is faster than the constant current charging.
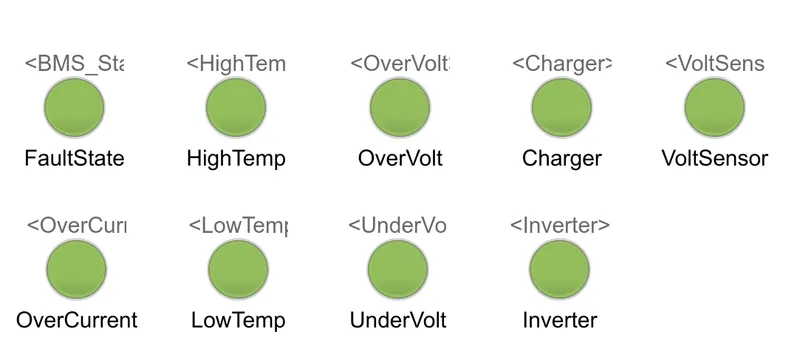
- All the indicators are green which means no error
TEST CASE 2 :
Now, inside the BMS_StateRequest > BMS_TestSequence > TestSequence2, we can see:
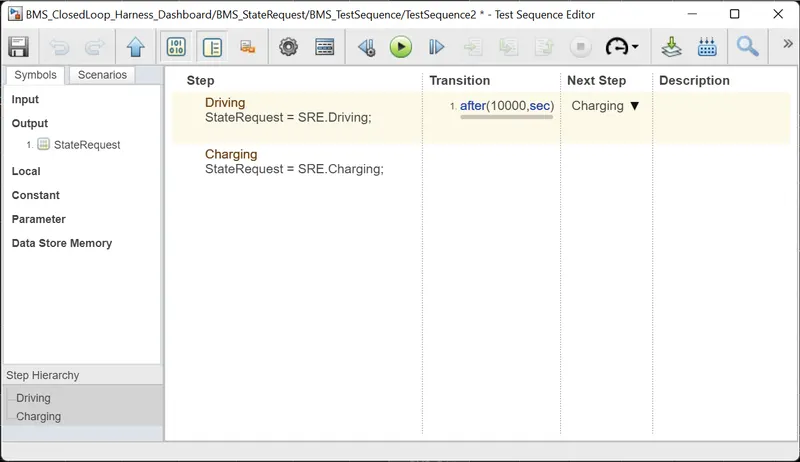
The driving state is from 0 to 10000 sec
Results:
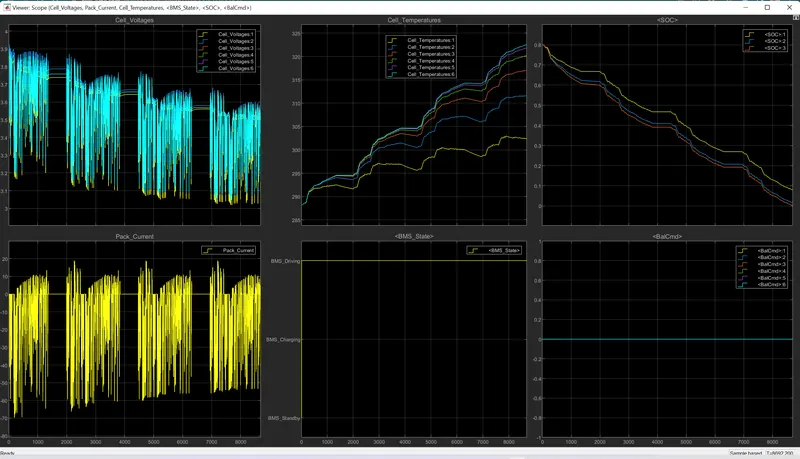
Observations:
- It is seen that the SOC comes down to 0 and no BMS charging was observed here.
- All the indicators are green which means no error
TEST CASE 3 :
Results:
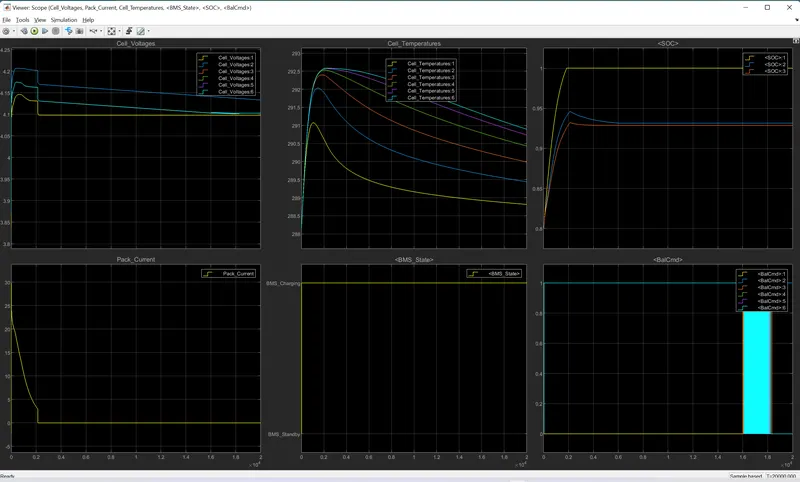
Observations:
- Constant voltage charging is observed.
- During charging the current falls to zero.
- Cell temperatures also start falling.
- The SOC reaches 100%.
- All the indicators are green which means no error
Coulomb counting:
SoC Estimation by Coulomb Counting is based on the measurement of the current and integration of that current over time.
where:
- SoC(t) = estimated State of Charge at time, t
- SoC(t-1) = previous State of Charge at time t-1
- I(t) = charging or discharging current at time, t
- Qn = battery cell capacity
- Δt = time step between t-1 and t
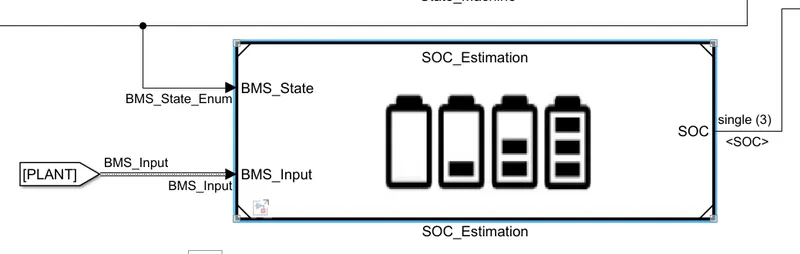
Inside the SOC estimation subsystem, we will see,
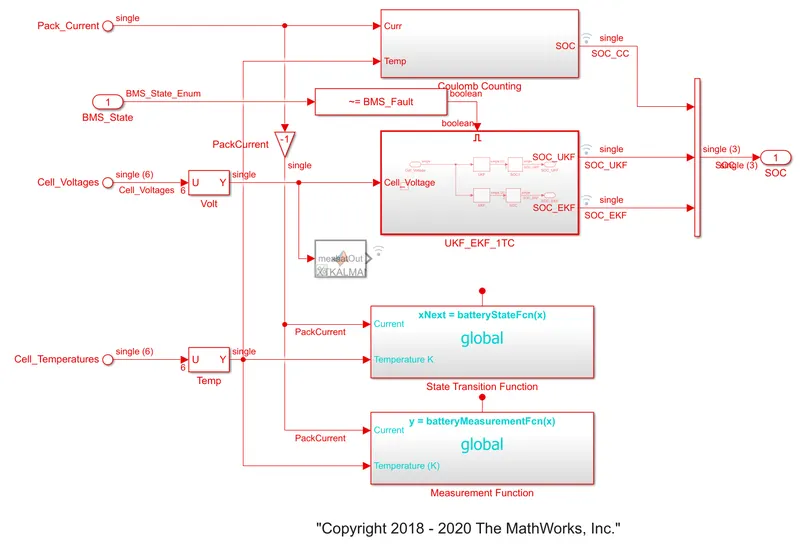
Here the topmost subsystem implements the coulomb counting algorithm. Whereas the bottom one implements two algorithms which are the Extended Kalman Filter (EKF) and Unscented Kalman Filter (UKF)
In the coulomb counting subsystem:
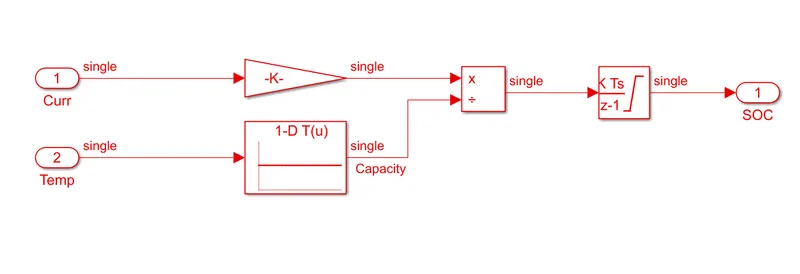
- Here, the battery temperature and current are the inputs.
- The current is passed through a gain block ( gain =single(1/3600) and this way the current is divided by 3600 to get Amp-hr.
- The temperature passed through a 1-D lookup table and the output is capacity(there is an empirical relationship between temperature and capacity)
- Now the current in Amp-hr is divided by the capacity and then integrated to get the SOC.