Week 7 State of charge estimation
QUESTION:
1.Simulate the 3 test cases from harness dashboard and write a detailed report on the results.
We are given a project model. The model is nothing but a lithium-ion battery pack & it's battery management system. Let us learn what a battery management system is and why it is required.
Battery management systems are used to maintain safe operating conditions of the battery pack. They are also responsible for the battery's performance, battery life etc,. Some specific operations done by the battery management system is maintaining battery's cell voltage & current, SOC, State of health, operating parameters such as temperature & other environmental factors.
Now we will look at our BMS system through this MATLAB project.
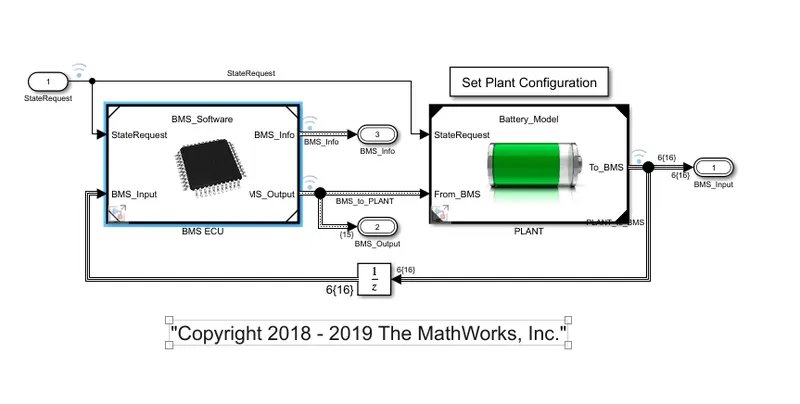
This is the block diagram of the BMS system. It contains two subsystems one is the electronic control unit of the BMS & the electric plant also called the battery pack. Now we will look into this in detail.
The BMS ECU is the one responsible for maintaing safe operating parameters through various power controllers. The BMS also estimates the state of charge (SOC) of the lithium-ion battery. The EV ECU controls a power supply amount (discharged amount from the power supply) and a regeneration amount (charging amount to the power supply) to/from the motor based on the estimated value and battery temperature information. Moreover, the charging control ECU controls a charging amount. Those collaborative controls can prevent overcharge of the lithium-ion battery so that the battery can be charged and discharged safely.
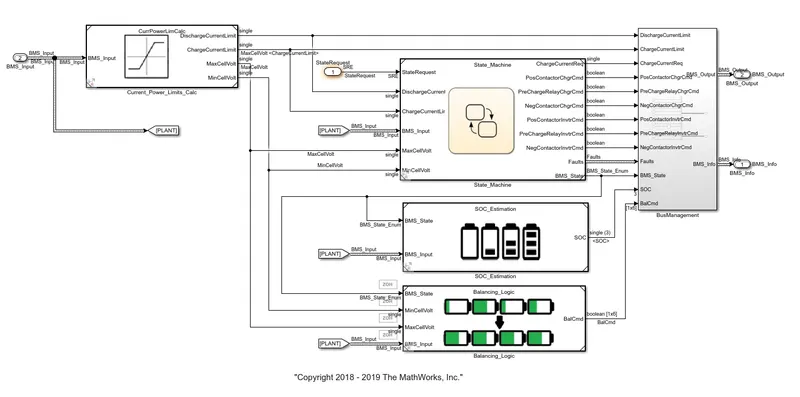
Inside the BMS is a state machine. It is the operating state of the BMS and it is divided into four parallel states. The first one represents the variable BMS states. There are three different states a BMS operates with an EV. They are driving, charging & standby states(Driving when the vehicle is moving, charging when pack is currently in charge & the standby where the vehicle goes post charging) . The state machine denotes the current state at which it is operating based on the conditions.
The second state is the fault state. These states are denoted when the battery pack's operating parameters such as voltage, current & temperature are violated.
The third & fourth state defines the ON & OFF state of the contactor circuits. The contactors are nothing but pre-charge circuits which limits the input current. The input current or in-rush current can cause damage to battery cells & we must have these circuits compulsorily. This is used in this sub-system in the form of a current power limits subsystem.
The cell balancing subsystem balances the voltages of the battery pack & also the voltage of the individual cell. It contains the state machine algorithm within it.
The SOC estimation sub-system is responsible for the determination of SOC. The system uses the couloumb counting method to determine the SOC & also other methods as EKF method. This will be discussed in detail later.
The plant sub-system is nothing but the battery pack. It has two variants of battery pack, one is a single module with six cells connected in series. The other one consists of 16 modules with each module containing 6 cells. The architecture is 6s-1p & 96s-1p.
We have selected the single module battery pack (6s-1p) for the simulation. This can be selected by going into the SET PLANT CONFIGURATION block.
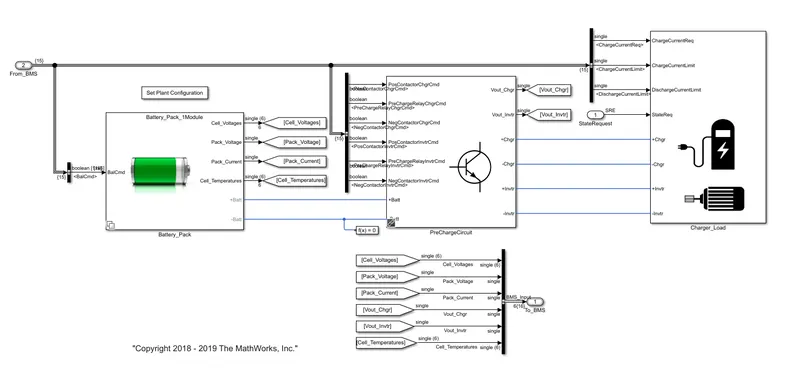
We can see the pre-charger circuit sub-system which was already discussed above. The charger load sub-system consists of 2 sets of circuits, one for charger & one for load(motor). When charger load is activated, the charge circuit is activated, which provides charge to the battery pack. When the load circuit is activated, the current is discharged from the battery to the load.
Now that we have seen the BMS system, we will now look at it's harness-dashboard.
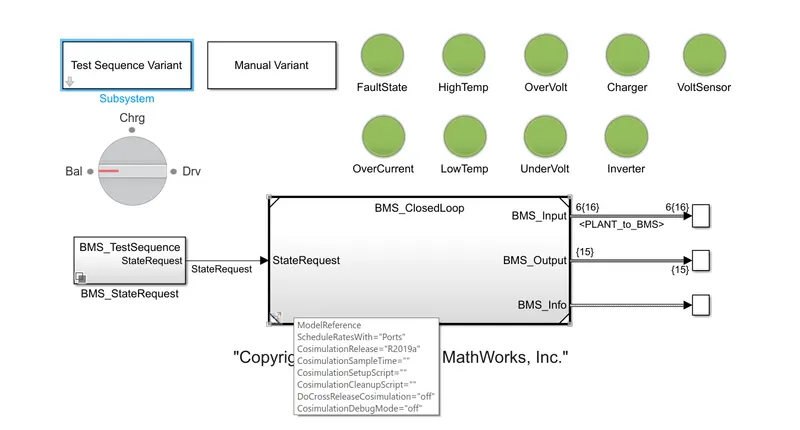
The harness dashboard is used to denote the user the faults happening in the BMS, the sequence in which the model is running & the cell temperatures, voltages, battery pack current for the simulation time period etc,. There are also lamps connected to the dashboard to denote the faults happening in the BMS system. Now we are asked to run the harness dashboard for the results in 3-different test case scenarios. These test cases differ accordingly based on charging time, driving time & standby time.
We will first run the first case. To run the first case click on the test-sequence variant block. Select case 1.
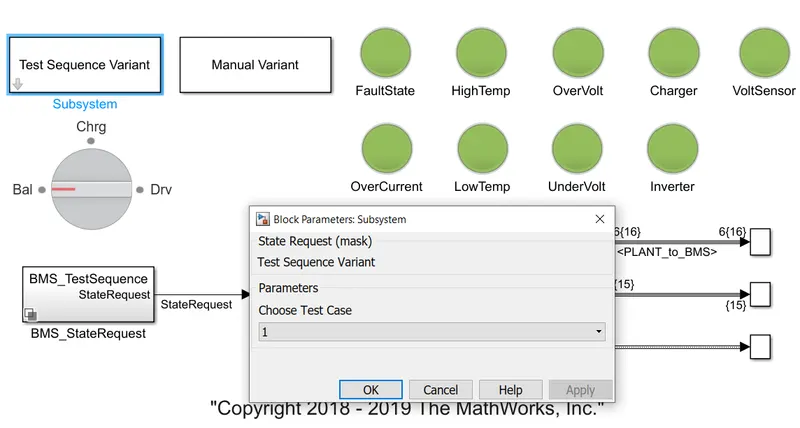
Now go to the MATLAB documentation of this project & select the RUN simulation option. This is done to avoid any simulation errors. Now we will look at the SCOPE results for the test case 1.
The simulation run time is set for 20000 secs.
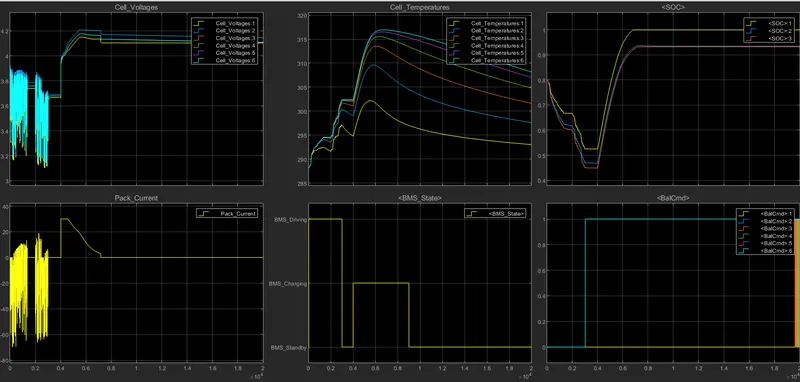
In total there are six different plots.
The first plot shows us the individual cell voltages for 6 cells. The driving state period (between 0 to 3000 secs) provides fluctuated voltage between 3.2 to 3.7, meaning that the nominal voltage was 3.7 and it decreases to 3.2 per cell. Then it increases to 4.2V during charging period (between 4000 to 9000 secs). This 4.2 is the fully charged voltage of the cell. Then it does not decrease as the BMS was in standby mode.
The second plot shows us the total battery pack current. Since the pack discharges current during driving, it is shown in negative direction (till -60A). Then during charging the current increases to 30A and it stays zero during standby period.
The third plot shows us the cell temperatures of the battery pack, ranging from 290k to 315k. The cell temperatures increase due to battery discharge, and slowly decreases during charging & standby mode. From the graph we can see that the sixth cell has the highest temperature meaning that the sixth cell is discharged the most.
The fourth plot shows us the states of the BMS. As discussed above the driving period was 0 to 3000secs, the charging period was from 4000 to 9000secs & the standby mode was from 9000 to 20000secs.
The fifth plot shows us the SOC in three different graphs, where the SOC rapidly decreases to 0.4 during driving, and charges back fully to 100% during driving. There will be no change in SOC at standby mode.
The sixth block shows us the cell balancing signals. The balancing of cells is shown to be in descending order, starting from the sixth cell of the battery pack to the first cell. This is also found out from the cell temperature block.
Now let us run the 2nd test case scenario similarly. The scope results are shown below.
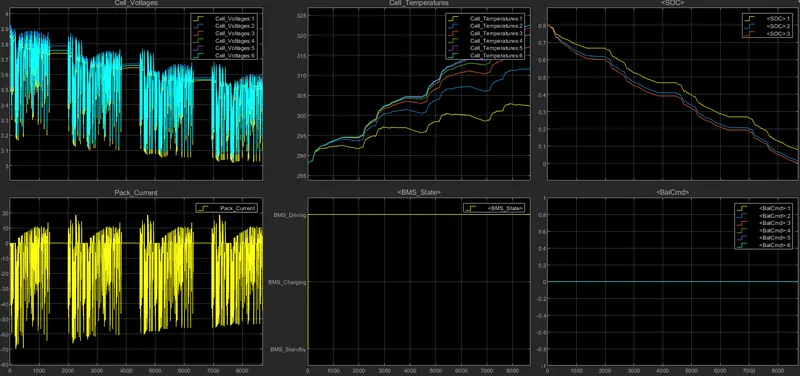
In this 2nd scenario, the BMS undergoes the driving mode till the battery pack's SOC is exhausted. From the plot it is evident that the battery pack discharges current till 8692 secs. From this we are able to conclude that for a single charge, the battery pack lasts for 8692 secs. There is no charging & standby state here. The EV runs till the battery pack is exhausted completely.
The voltages fluctuate from 3.7V to 3V. This 3V is the cut off voltage of the individual cell. The battery pack discharges current till 60A which is it's capacity. The temperatures of the cells keeps increasing, as they have been discharging current non stop. The SOC keeps decreasing till it reaches 0%. The cell balancing is also not done during charging as the battery pack has not undergone charging or standby. The cells have been equally discharged till cut off so the cell balancing signal is not given.
Implementing this type of case scenario will help us understand the longevity & life span of the battery.
Now let us look at the 3rd scenario. Below are the scope results.
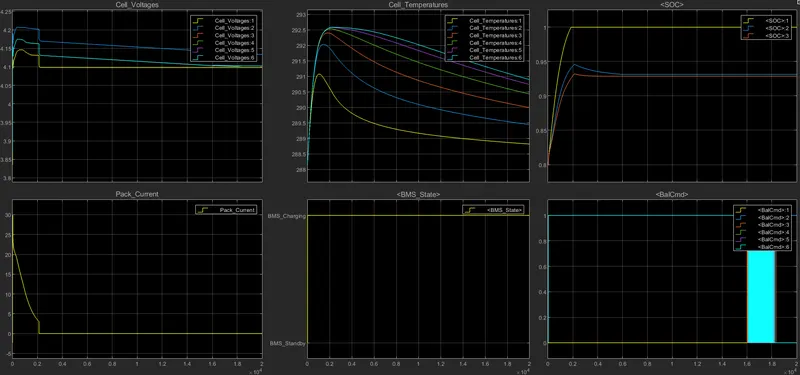
This third scenario is entirely the charging period. There is no driving state or the standby state. Initially the SOC was at 80% and then the pack was charged completely. The pack current initially went up to 30A and then goes back to zero after being completely charged. This is because the contactor circuits limit the in-rush current. The battery cannot take current anymore after being fully charged. The cell voltage range from 4 to 4.2V which is the fully charged voltage range. The cell temperatures were also initially slightly higher due to initial charging current but it stabilises afterwards due to contactors. The balancing commands were followed from the sixth cell to first cell as per the plot.
Thus the BMS system was studied in detail & the three different test case scenarios were explained in detail.
2.What is coulomb counting? Refer to the above model and explain how BMS implements coulomb counting for SOC estimation ?
The couloumb counting method, also known as "integration counting method", calculates the SoC by measuring the battery current and integrating it in time.
To determine available capacity, coulomb counting relies on the integration of the current drawn from and supplied to a battery over time, as given by
where SOCo is the initial state of charge (mostly 100%), I is the current and η is the efficiency during charge and discharge operations & Cr is the rated battery capacity. Coulomb counting is advantageous in terms of a simple structure and its ease of implementation. However, some problems make it difficult to accurately estimate battery SOC by coulomb counting. Because battery capacity and efficiency are significantly influenced by operating temperature and current direction, these factors should be considered to correct for battery SOC. Sensor accuracy is also important because accumulated errors can lead to a drift in the estimated battery SOC. Furthermore, one of the main problems in coulomb counting is that it is necessary to calibrate the initial battery SOC.
In this model, we can see the couloumb counting method in the BMS system, under SOC estimation block of the ECU subsystem. The contents of the block are as follows.
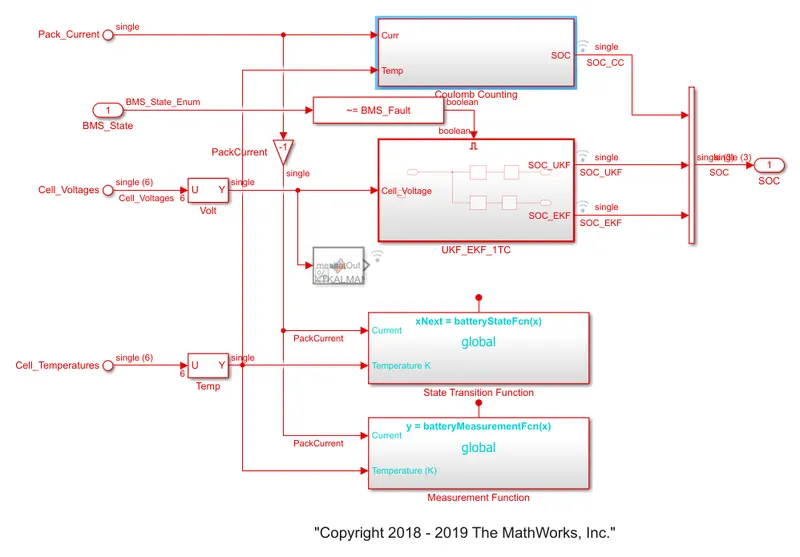
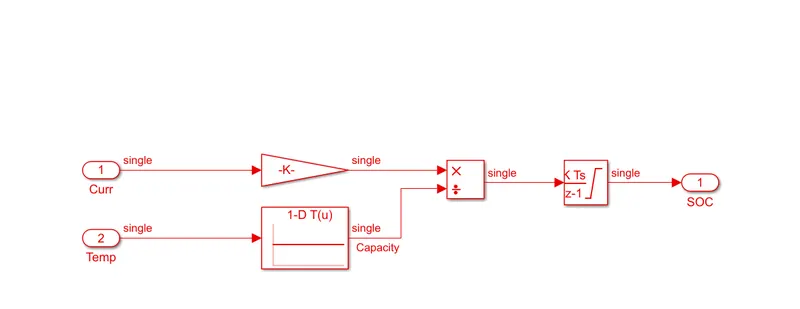
This is the block diagram of the couloumb counting sub-system. In this BMS model, they are considering the battery pack capacity & the battery capacity with respect to the cells temperatures for the SOC calculation.
The current capacity from the battery pack is given to a GAIN block, which converts the battery's capacity of Ah into A by multiplying it with 1/3600. Then the cell temperatures are then passed into a 1D look-up table. They show a complete data of battery capacity that changes with respect to the cell temperatures. The battery current capacity is then divided with the output of the 1-D lookup table which has capacity values w.r.t temperature. They are then passed on to the discrete time integrator, which integrates current values with time ranges. This gives us the battery's SOC.
This is how the couloumb counting method is implemented in the BMS model.