Week 7 State of charge estimation
Ans 1.) Matlab model to simulate the 3 test conditions from harness dashboard. The model Can be used to simulate various usage patterns and environmental circumstances to assess a system's response to a potentially hazardous situation. For instance, exceeding the acceptable limits for voltage, current, or temperature.
BMS ECU: Depicts the model's software and controls, demonstrating how cell balancing is carried out, how SOC is calculated, and how it responds to various situations (using stateflow).
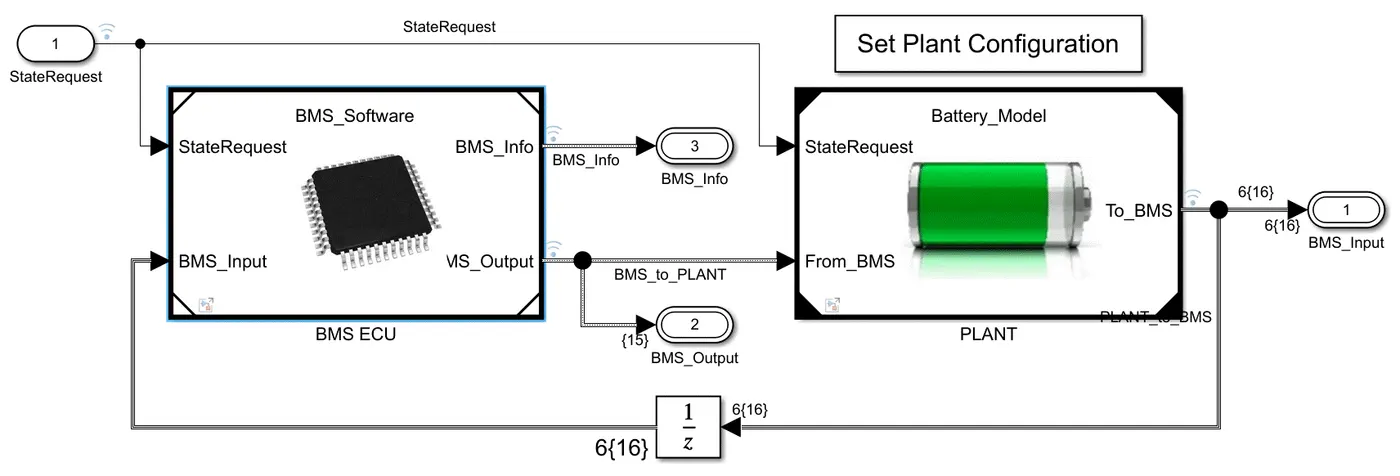
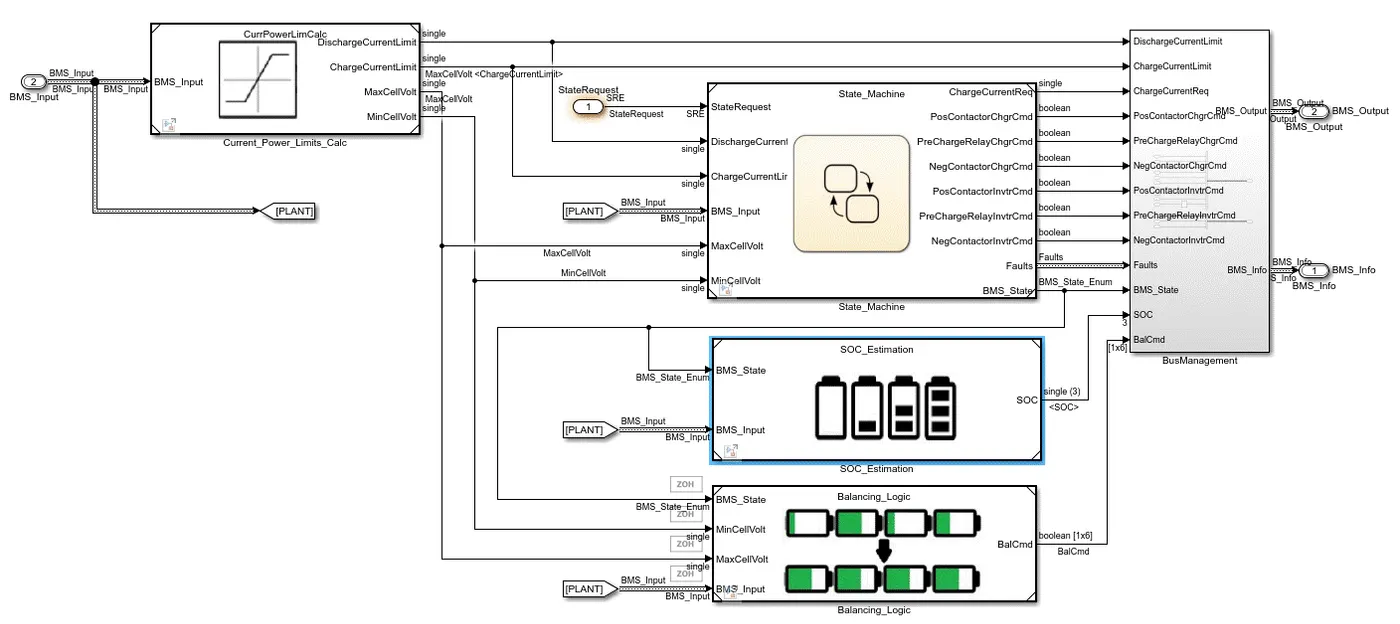
Fig. BMS electroni circuite unit(ECU)
PLANT: Comprised of the battery pack, precharge circuit, and charger, this represents the model's hardware.
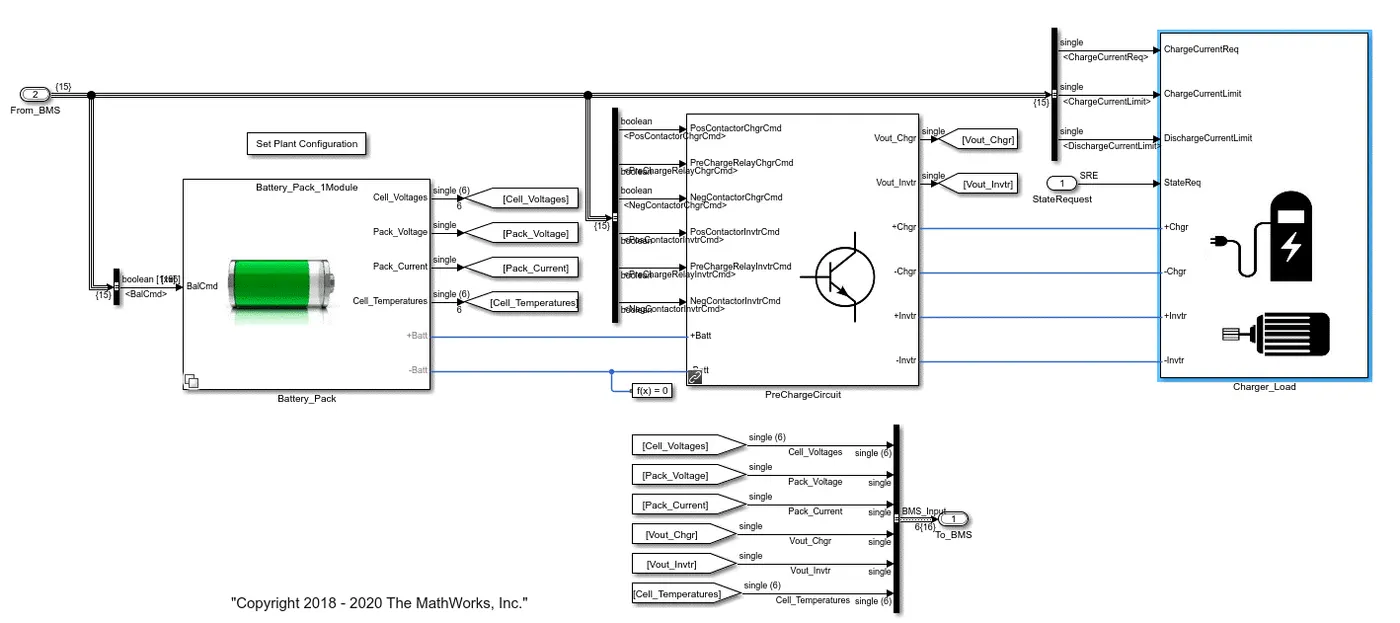
Fig. : Plant model
TEST HARNESS DASHBOARD:
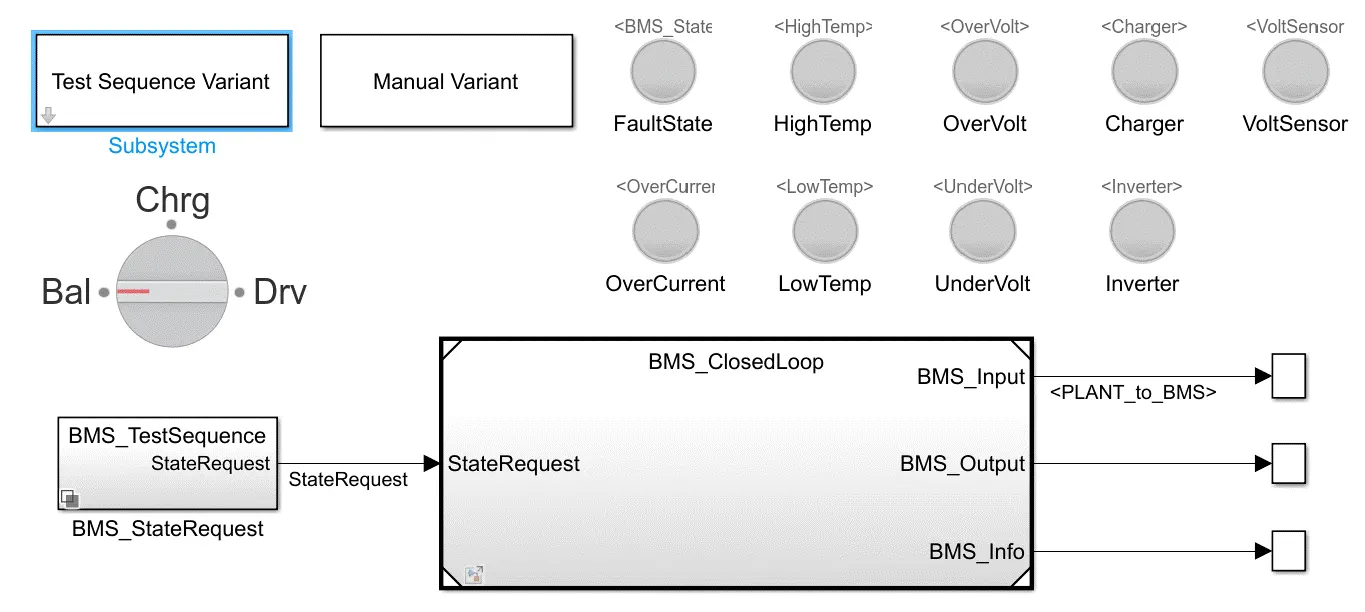
Test case 1: No fault condition on vehicle
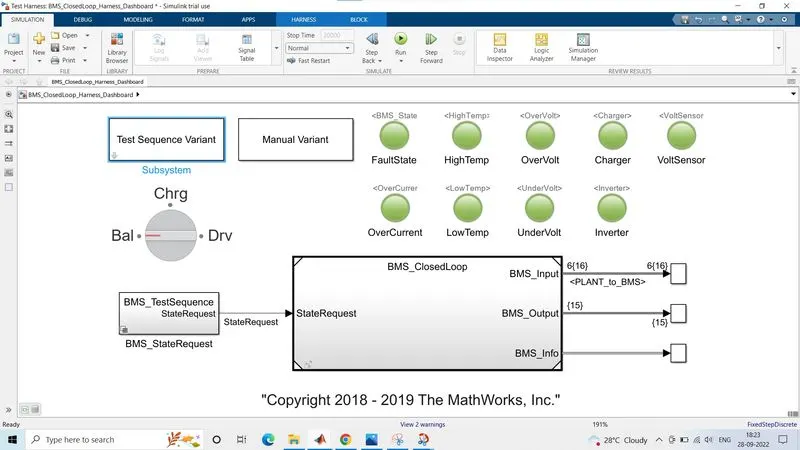
Now by clicking on the BMS Sequence block we get the chart

For the first 3000 seconds, the battery is in driving mode.Due to the BMS being in standby, cell balancing will take place during the next 1000 seconds. Usually, this won't occur until the car has been stopped for a while.The following 5000 seconds are spent charging, while the last 11,000 seconds are spent on standby.
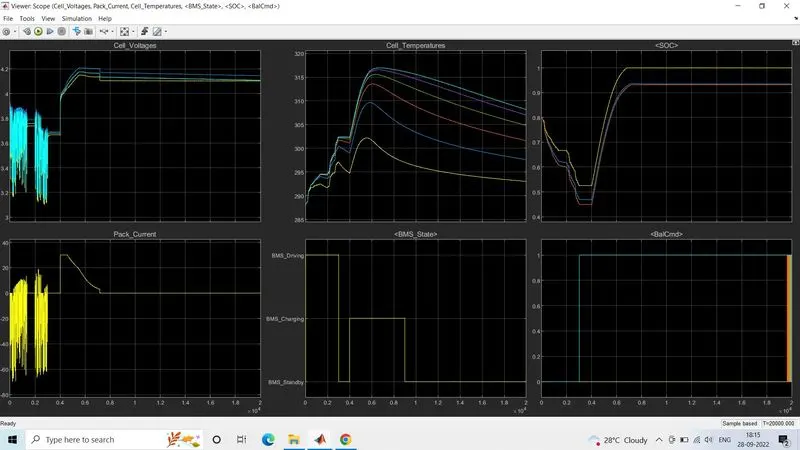
Observations from 1st test:
- Different cell voltages at startup indicate that SOC imbalancing existed from the start. After 3000 seconds, however, when cell balancing starts, they do begin to converge, and by the end of 20,000 seconds, all cells have stabilised at 4.1 volts.
- Up to 3000 seconds, there were fluctuations in the pack current and cell voltage, which means the vehicle was in driving mode.
- Between 4000sec and 9000sec there is constant current (CC) and constant voltage (CV). Charging happening from 4000 -4600sec it is in CC and then the remaining is CV. During CC the SOC increases much more quickly, and then slows down during CV as a precaution mechanism to avoid charging past the voltage limit.
- The SOC graph depicts the estimation of SOC using several techniques, with yellow representing coulomb counting, blue representing the Unscented Kalman Filter (UKF), and orange representing the Extended Kalman Filter (EKF). Due to their capacity to take voltage information into account, both Kalman filter techniques are more accurate than coulomb counting.
Test case 2:
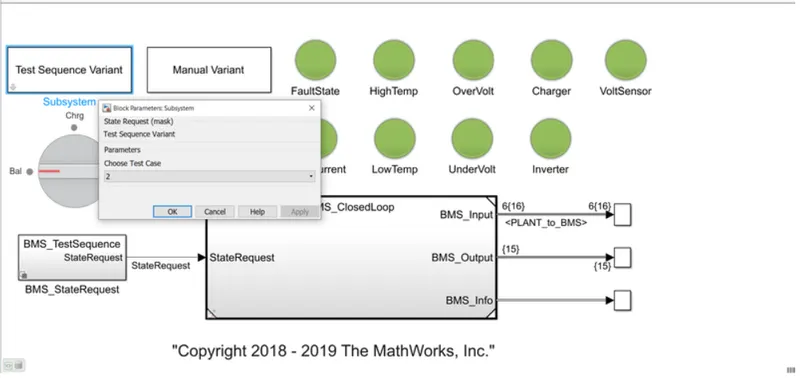
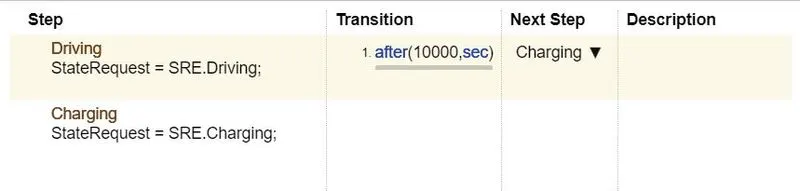
- The driving stage is for 0-10000sec then charging stage occure.
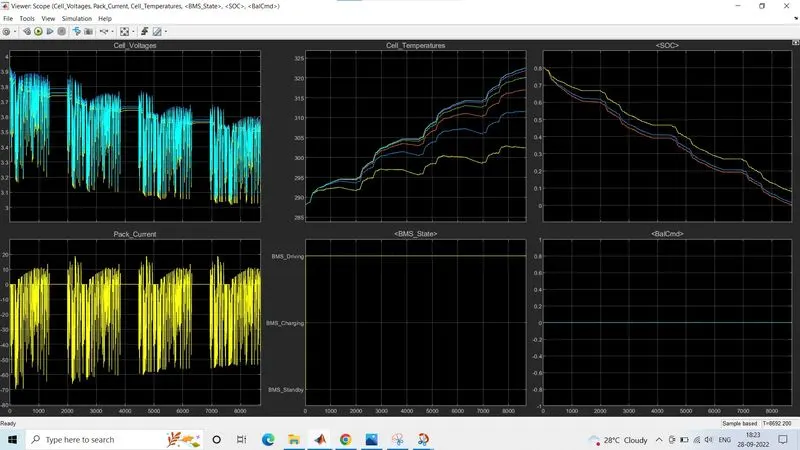
Obsevations: fault condition occured in second case. So even after charging was started, the soc didnt increase. Its continue to decrease.
Test case 3:
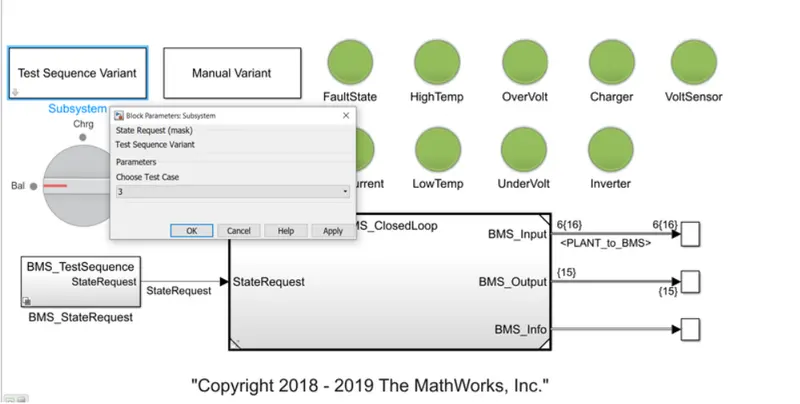

- This condition has only one phase which is charging mode.Thus 0 to 20000 seconds simulation runs.
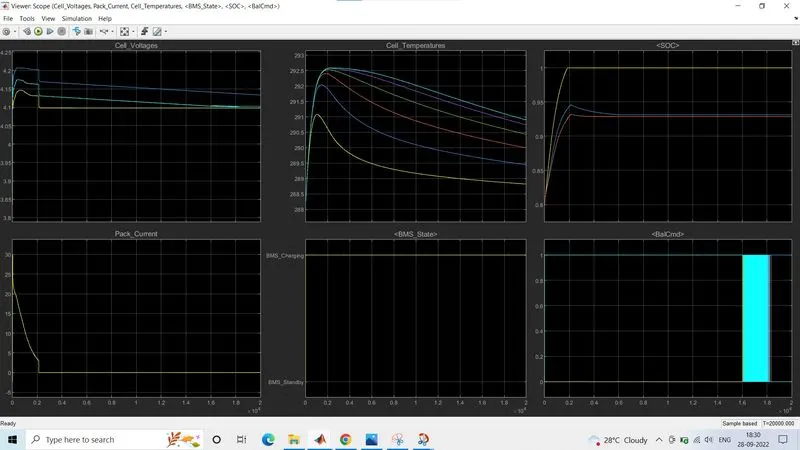
- From above groph we see that the State of Charge(SOC) reached 100% in charging and remained in stand by mode. Cell temperature also decrased when standby mode was acheived.
Conclusion: From the above 3 cases we observer that only charging takes place thus SOC was 80% at first , then SOC increases to 100% in 2000 seconds then SOC remains constant at 100%.
Ans 2.)
Coulomb counting: This method calculates SOC by measuring the battery's discharge current and integrating it over time. The discharging current, I(t), and previously estimated SOC values, SOC, are used to estimate the SOC(t), which is then calculated using the Coulomb counting method (t-1). The following equation is used to determine SOC:
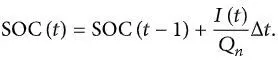
However, their are variety of factors including temperature, battery history, discharge current, and cycle life, affect the accuracy of the Coulomb counting approach.
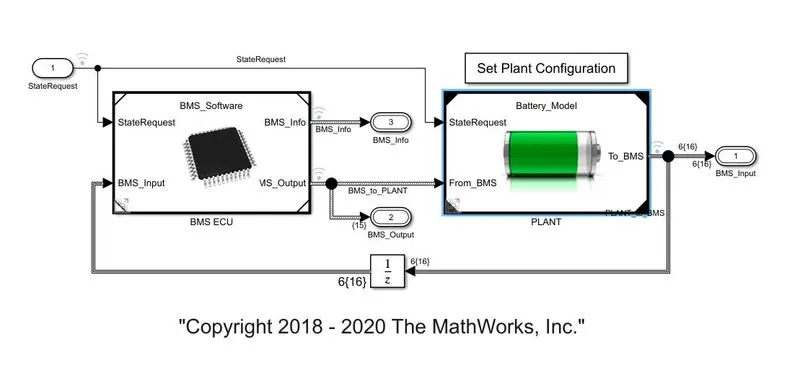
From the given model by Mathworks as shown below of BMS Closed Loop model, when seen inside the BMS ECU,
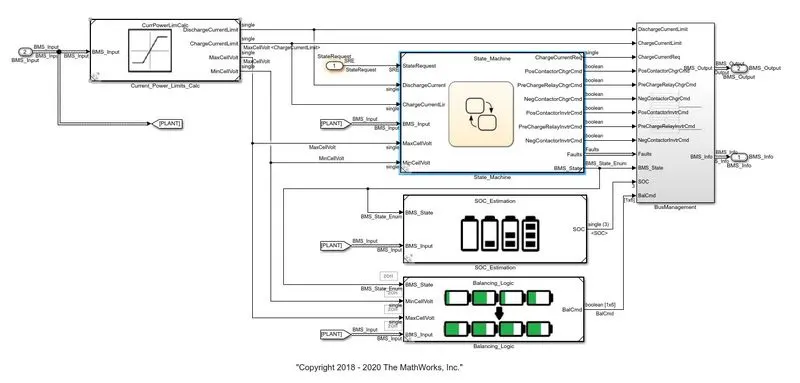
And then inside the SOC estimation block
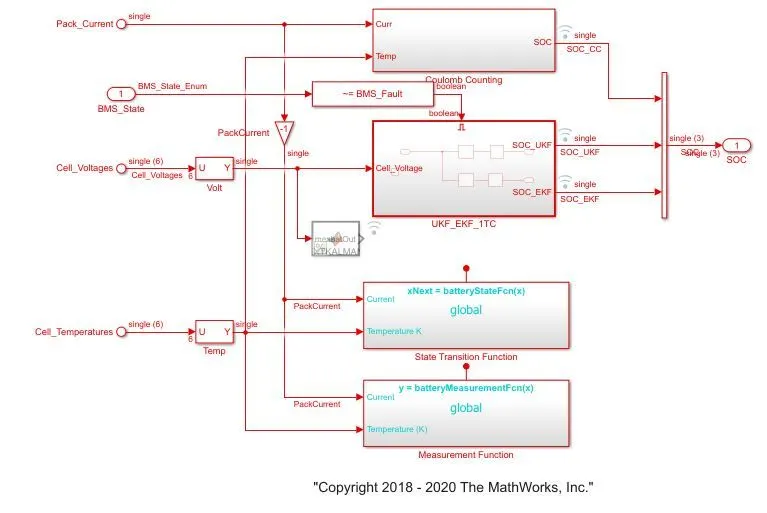
The top of the model has the Coulomb counting block, which is where the Coulomb counting was done. The corresponding model is shown below.
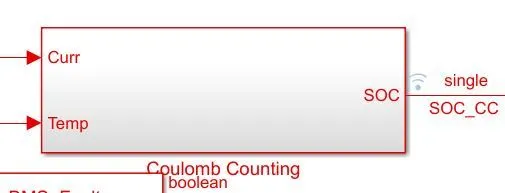
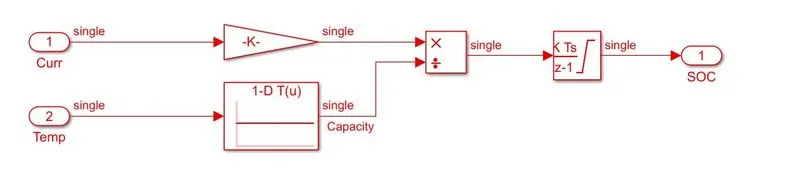
- The estimation by coulomb counting equation is carried out by this system.
- The simplicity and low computing cost of the coulomb counting approach are advantages.
- As inputs, the temperature and battery current are provided.
- Current signal is given to a gain block and temperature is given to capacity since it varies according to temperature.
- These inputs are provided for the integration process, which involves integrating current with regard to time.
- Another block receives this output and divides it up according to capacity.
- The SOC is therefore estimated.
References: