Week 7 State of charge estimation
1.Simulate the 3 test cases from harness dashboard and write a detailed report on the results
2.What is coulomb counting? Refer to the above model and explain how BMS implements coulomb
counting for SOC estimation ?
Hint :(Download the file from the link and go to SOC estimation model-ECU block)
Aim: To study the State of Charge Estimation
Objective:
1. To simulate the Simulink model of a lithium ion battery management system for 3 test cases and
to explain the results obtained.
2. To explain coulomb counting and and it's use in estimating the state of charge of a battery pack.
Answer 1:
What is BMS (Battery Management System):
Electric vehicles run on rechargeable battery packs that are made of multiple cell modules arranged in
a series and parallel. These battery packs produce several hundred volts of electricity. Various
functions inside the car are dependent on them. That is why it becomes a critical component of the
vehicle that requires constant monitoring and control.
Battery Management System (BMS) is an embedded system, which monitors the components closer to
the battery cell, as each cell needs to be closely monitored so that there are no voltage fluctuations or
imbalance in voltage conditions. The BMS consists of different components that ensure that the battery
runs efficiently without chances of possible failures.
Need of BMS:
The main function of BMS is to ensure that the battery is protected and any operation out of its
safety limit is prevented. It monitors the battery pack’s state of charge (SOC) along with the state of
health. BMS also manages the battery optimization via cell balancing that improves the life of the
battery in the long run. The BMS will also monitor voltage, different temperature parameters, and
coolant flow.
Lithium-ion batteries that possess high charge density, power most electric cars. These battery
packs even though are not very big; can be highly unstable. Therefore, these batteries should never
be overcharged or be allowed to reach a state of deep discharge at any point. Thermal Runaway is a
condition where the current flowing through the battery on charging or overcharging causes the
cell temperature to rise. Conditions like these can harm the lifespan or the capacity of the battery. To
ensure this does not happen, we require BMS to monitor its voltage and current.
This process is very challenging as many cells are put together to form a battery pack in an electric
vehicle and every cell needs to be individually monitored for its safety and efficient operation, which
requires a specially dedicated system called the Battery Management System (BMS).
The primary function of BMS:
1. Safety,
2. Performance optimization,
3. Health monitoring and diagnosis, and
4. Communication.
MATLAB Model of BMS:
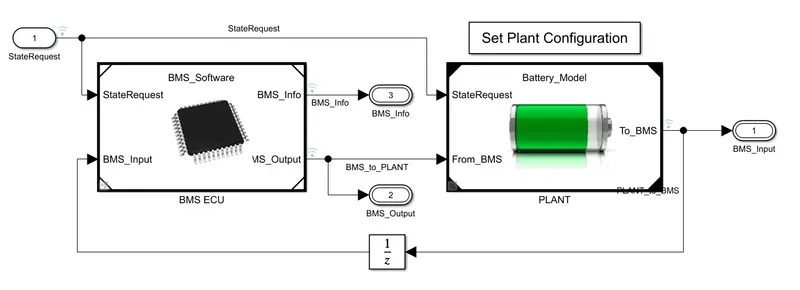
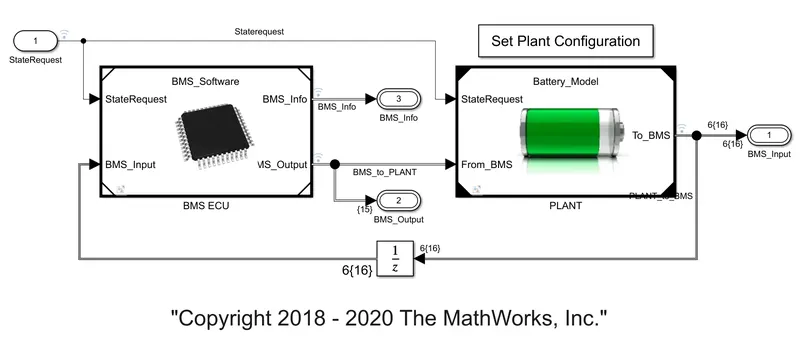
Fig. Simulink configuration of BMS
1] BMS ECU:
The above model consists of the following BMS Algorithms:-
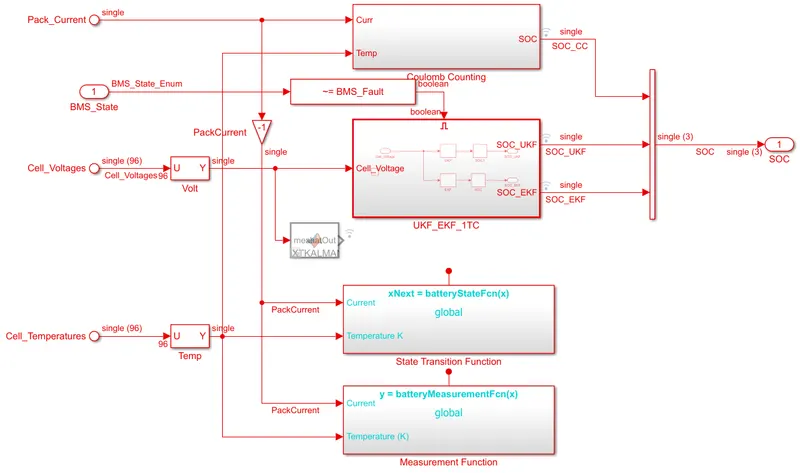
i. State of Charge estimation using Extended Kalman Filter, Unscented Kalman Filter:
In the BMS model, the SOC is calculated by 3 different methods
i. Coulomb counting
ii. Extended Kalman filter
iii. Unscented Kalman filter
Kalman filtering:
It is also known as linear quadratic estimation (LQE), is an algorithm that uses a series of
measurements observed over time, containing statistical noise and other inaccuracies, and produces
estimates of unknown variables that tend to be more accurate than those based on a single
measurement alone, by estimating a joint probability distribution over the variables for each
timeframe.
Fig. Kalman filtering
ii. Passive Battery Cell Balancing:
a. A passive system potentially burns off excess energy from the high cells through a resistive
element until the charge matches the lower energy cells in the pack.
b. If we have cells packed in series and we notice that some of the cells have higher energy than
the other lower energy cells, we can balance the cells in burning energy of the top cells simply by
attaching a resistor to the cells which release the energy into heat thereby equalizing the cell energy
of the battery pack.
Fig. Cell Balancing
Cell Balancing System:
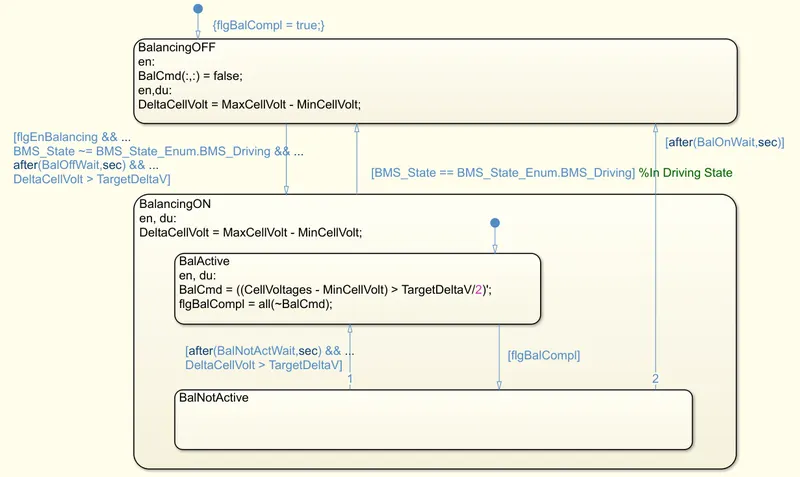
Fig. State-flow of the cell balancing
iii. Pre-charging and Contactor Management:
1. Pre-charge of the powerline voltages in a high voltage DC application is a preliminary mode that
limits the inrush current during the power-up procedure.
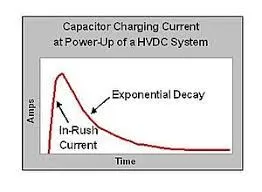
Fig. DC pre-charge circuit flow
2. A high-voltage system with a large capacitive load can be exposed to the high electric current
during the initial turn-on. This current, if not limited, can cause considerable stress or damage to the
system components. In other systems such as vehicle applications, pre-charge will occur with each
use of the system, multiple times per day. Precharging is implemented to increase the lifespan of
electronic components and increase the reliability of the high voltage system.
3. The below state system represents the pre-charging check included in the fault monitoring
system. The check is performed before charging when the charger is connected and when it is
removed and in the same way for the power converter circuit when the load is connected and
disconnected.
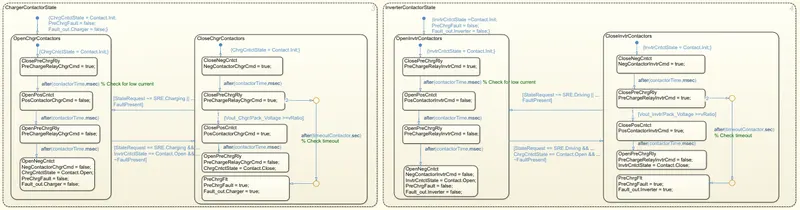
Fig. State-flow of the pre-charging and contactor management chart
iv. Fault Management - Over/Under Voltage, Over Current, Over Temperature:
a. Battery Management System is to provide the necessary monitoring and control to protect the
cells from out-of-tolerance ambient or operating conditions. This is of particular importance in
automotive applications because of the harsh working environment. As well as individual cell
protection the automotive system must be designed to respond to external fault conditions by
isolating the battery as well as addressing the cause of the fault. For example, cooling fans can be
turned on if the battery overheats. If the overheating becomes excessive then the battery can be
disconnected.
b. The Fault Monitoring system continuously monitors the parameters such as temperature, voltage,
and current.
c. The current monitoring system checks the current being drawn and put inside the battery
whenever the time duration of the peak current increases or the time duration of peak requirement
is more than fault is generated and the battery is sent into a fault state.
d. Similarly, cell voltage and temperature are continuously compared to the maximum and the
minimum limits, and a fault is generated whenever the limits are crossed.
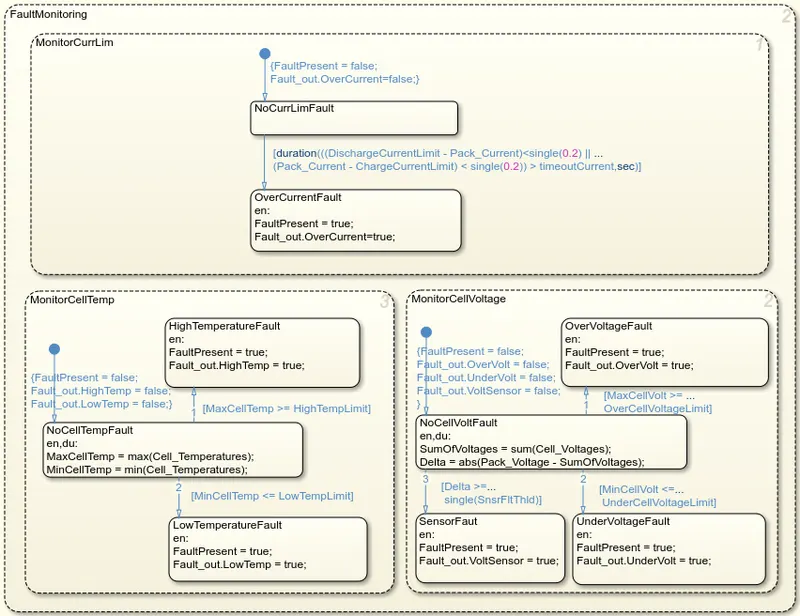
Fig. State-flow chart of the fault Management
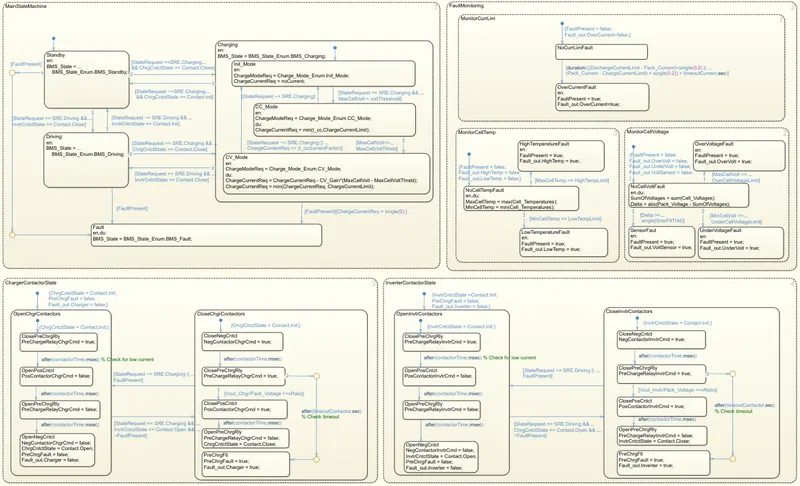
The complete state monitoring system also includes a pre-charging check for load and the charger.
v. Charge and Discharge Current Limit Calculations:
1. The charge and discharge calculation is also a part of the fault management and protection
function performed by the Battery Management System to restrict the operation in safe working
points within limits.
2. The voltage level of 6 cells is given as input from which the minimum voltage is used to find the
max discharge current of the battery and similarly, the maximum voltage of the cell is used to find
the max charging current for the battery.
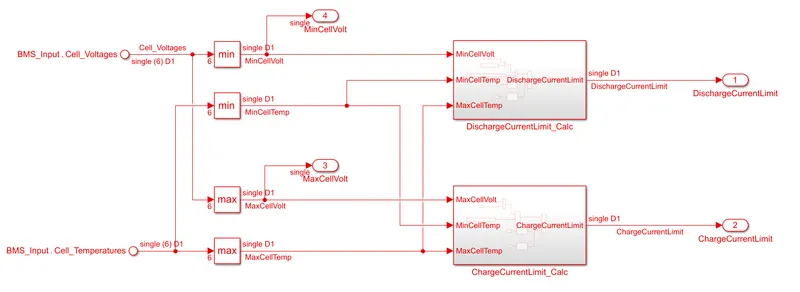
Charging/Discharge Current Limit Subsystem:
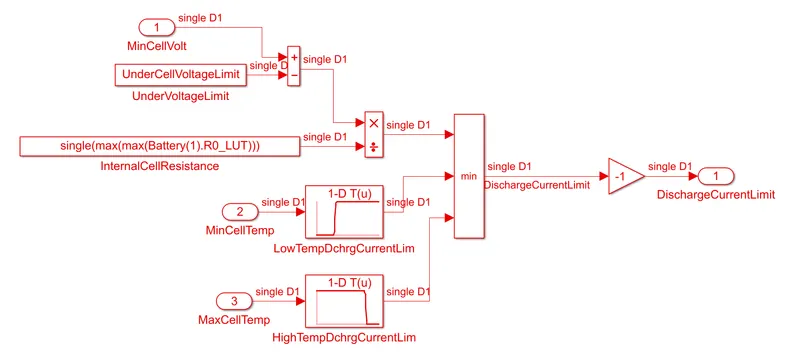
1. The minimum voltage is then fed to the discharge current subsystem where minimum the
difference between cutoff voltage and cell minimum voltage is used to find the maximum
instantaneous discharge current using the resistance of the cell. The minimum discharge current is
then chosen by considering the cell instantaneous temperature, resistance, and voltage of the cell.
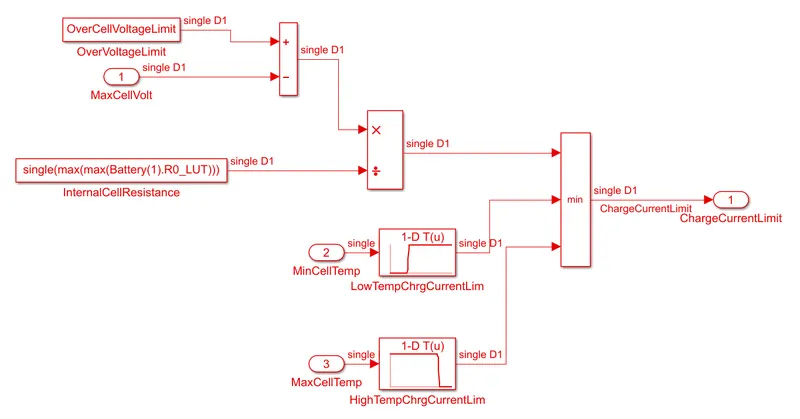
2. Similarly, the maximum charging current is found based on the maximum instantaneous voltage
which is then compared to the max safe voltage of the cell. Also, the cell's instantaneous
temperature, resistance, and voltage are taken into consideration.
Discharge Current Limit Subsystem:
Charge Current Limit Subsystem:
2] Plant:
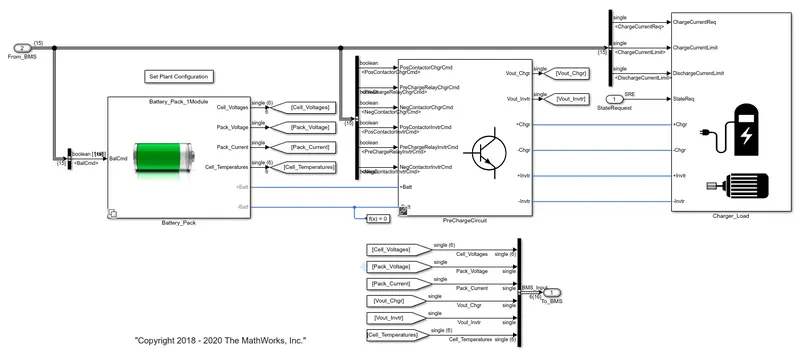
Fig. Simulink model of sub-system of the plant
The Plant model consists of 3 main subsystems consisting of the following:-
A] Battery Pack:-
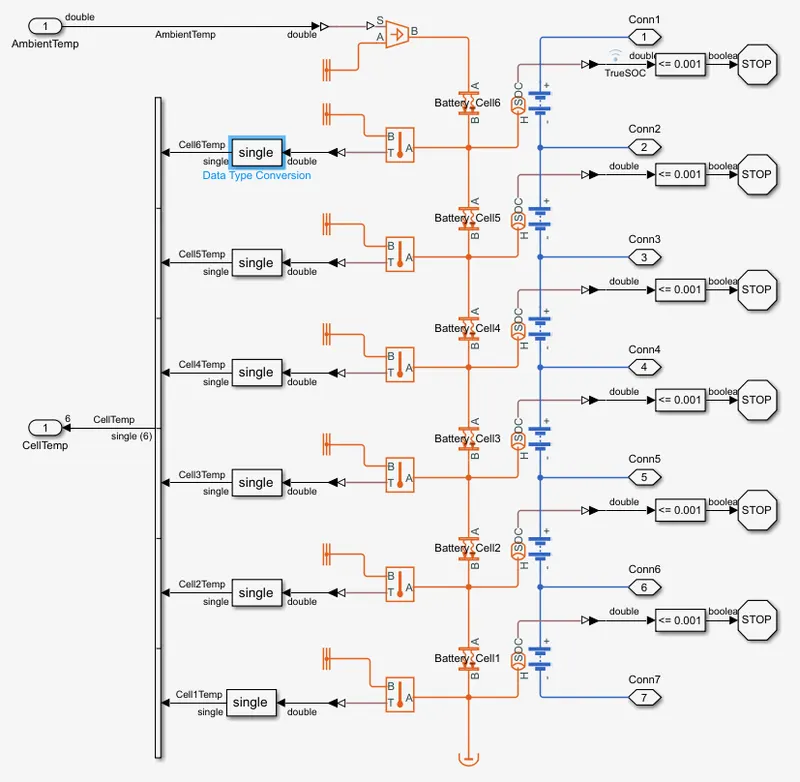
1. The battery pack consists of a module with 6 cells connected in series along with the cell balancing
circuit.
2. The voltmeter is connected in parallel to the battery pack and an ammeter is connected in series
to the negative terminal of the battery.
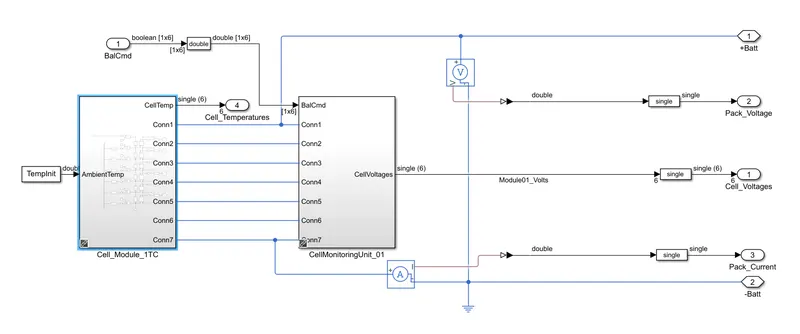
Cell Module:
It shows 6 cells connected in series along with the temperature sensor. The simulation is stopped
when the SOC of the cell drops below 0.00.
Cell-Balancing Circuit:
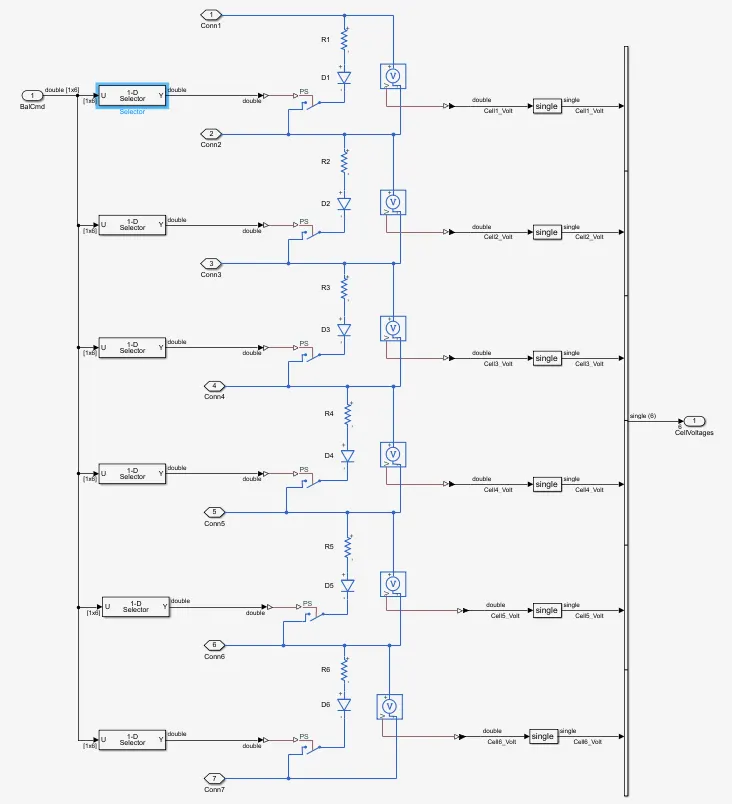
1. Here we only passive cell balancing technique as it is comparatively cheaper and less complex
than the active cell balancing technique.
2. In the cell balancing circuit, we use only a resistor in parallel to dissipate the charge stored in the
form of heat. This is controlled using a voltage sensor which checks when to stop balancing to stop
over-discharge.
B] Precharge Circuit:-
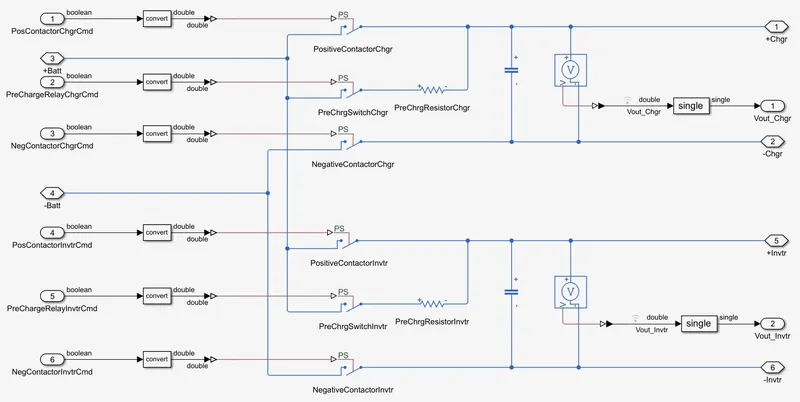
1. The precharge circuit is used in order to prevent the current rush while charging and discharging
the battery and to prevent the spark generation, the wiring, and the components from the sudden
flow of high current.
2. A resistor is connected in series to limit the current flow and a capacitor is connected to prevent
the voltage ripple. At first, the negative of the battery is connected and then the capacitor is charged
via a resistor, and at the end step positive terminal is connected.
C] Charging/Discharging Load:-
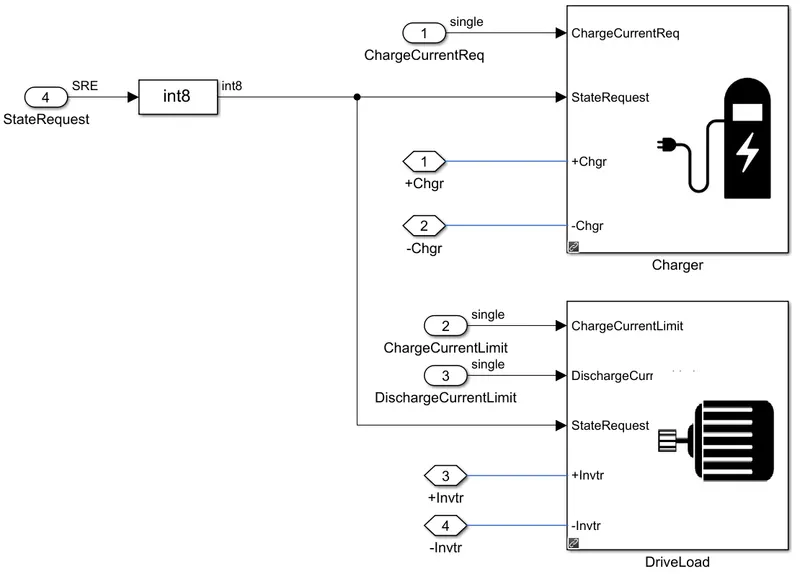
The charging or the load is applied using based on the user input given is state request given as
input in the subsystem.
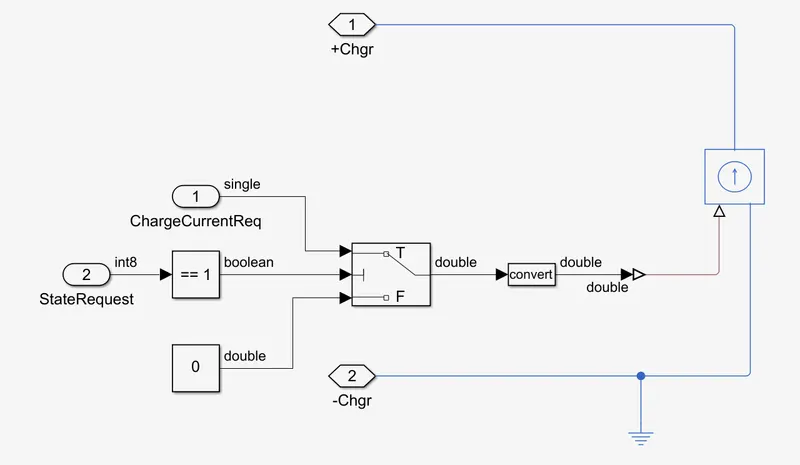
Charging:-
When the state input for charging is "1" then the battery is charged via a controlled current source
and the amount is charge is mapped to a data stored under the variable "ChargeCurrentReq".
Discharging:-
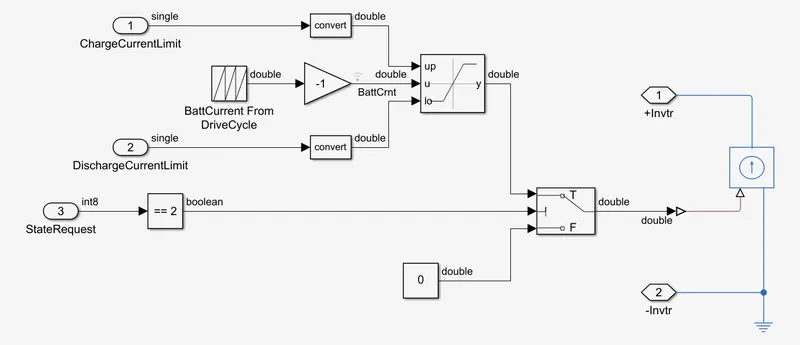
1. Here the charge given by the battery is considered as positive and the charge given to the battery
is considered as negative.
2. The state requirement is checked and the current profile for discharge is made as a repeating
sequence from a remapped data in the variable "BattCrnt'. The battery is discharged using a
controlled current source.
Simulation for the different test cases:-
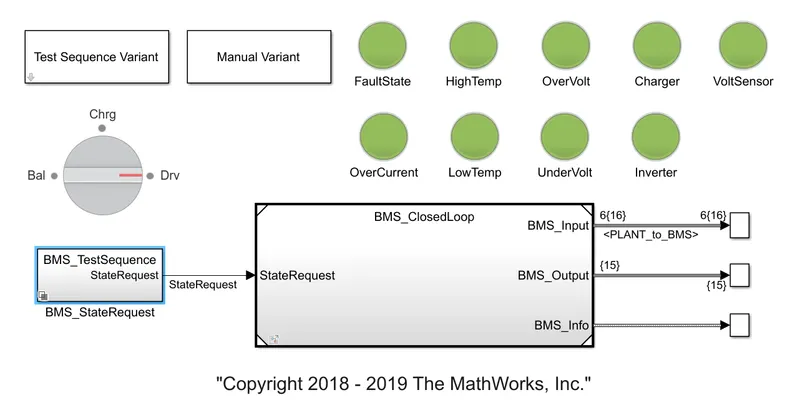
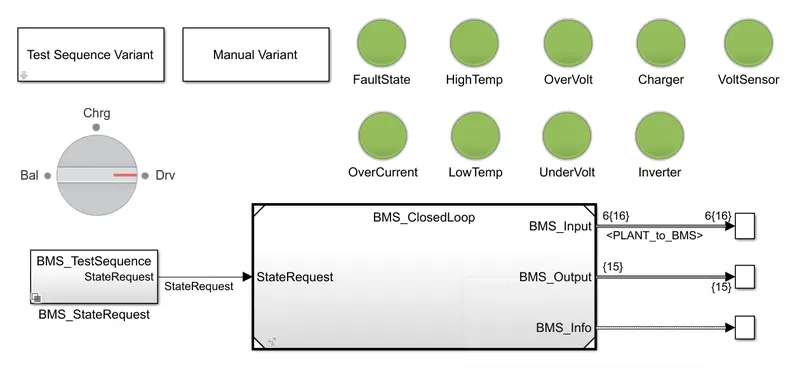
This the BMS close-loop harness dashboard to design and test this 3 algorithm and this project also
includes files for:
1. Li-ion Battery Cell Parameter Estimation
2. Battery Pack with 6 cells in series and 96 cells in series
3. Simulink Test files with test cases to test State Machine Logic
4. Linking requirements to Models
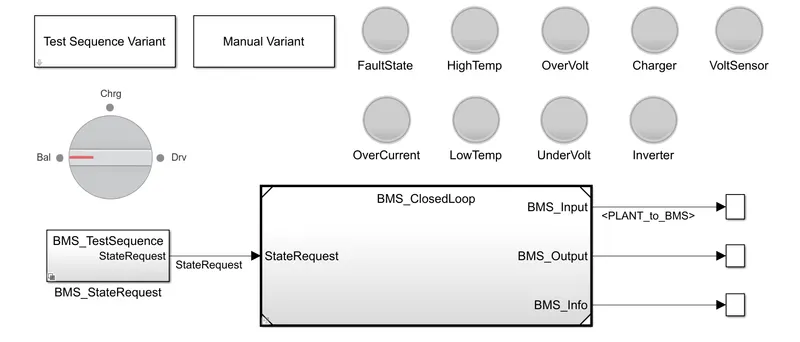
Fig. Simulink configuration of Harness Dashboard
Test Case 1:
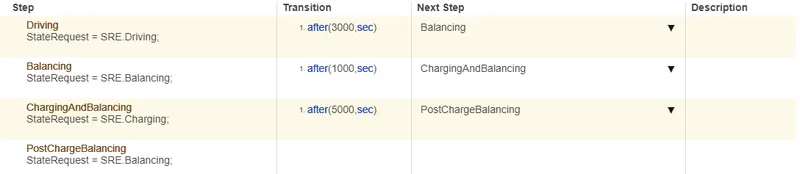
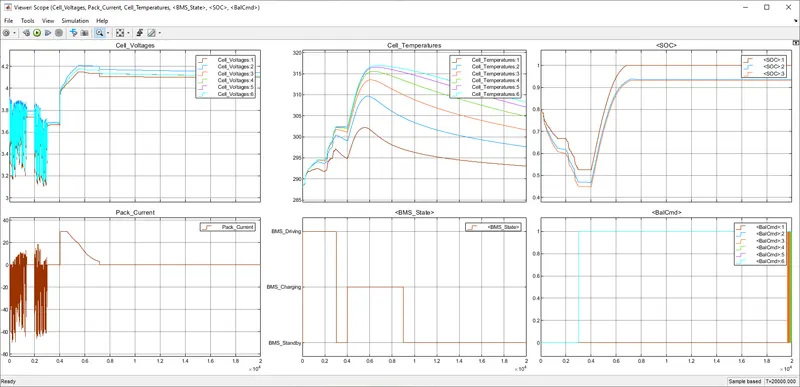
The simulation is run for 20000 seconds in which the first 3000 seconds is the discharge or the
driving mode then the next 1000 seconds are in balancing or standby mode then for 5000 seconds in
charging and balancing mode and afterwards the in standby or balancing mode.
Output:
Comments:
1. The first plot with Cell_Voltages displays the voltages of all 6 cells connected in the series. While
the first 3000 seconds the voltage of the cells drops as the battery is discharging and during the
standby period the voltage stabilizes as the cell balancing gets activated and even due to cell inherit
behaviour. Then while charging the cell voltage increases and while the cell balancing the voltage
stabilizes.
2. The second plot with Pack_Current represents the current drawn and given to the battery while
charging and discharging. It is also seen that while charging, first the current remains constant, and
then it drops its charges in constant voltage mode.
3. The third plots the cell temperature of all individual cells and we can see then while charging and
discharging the cell temperature increases.
4. The fourth plot shows the input state as per the given state input.
5. The fifth plot shows the state of charge of the entire pack by 3 different methods of calculation.
The soc curve decreases as we discharge the battery and increases while charging.
6. The sixth plot shows the cell balancing command for all six cells. The 1st cell is having the lowest
voltage does not need balancing thus we can see that all the other cell's signal have a magnitude of
1 whereas the 1st cell signal is at zero magnitudes.
Test Case 2:
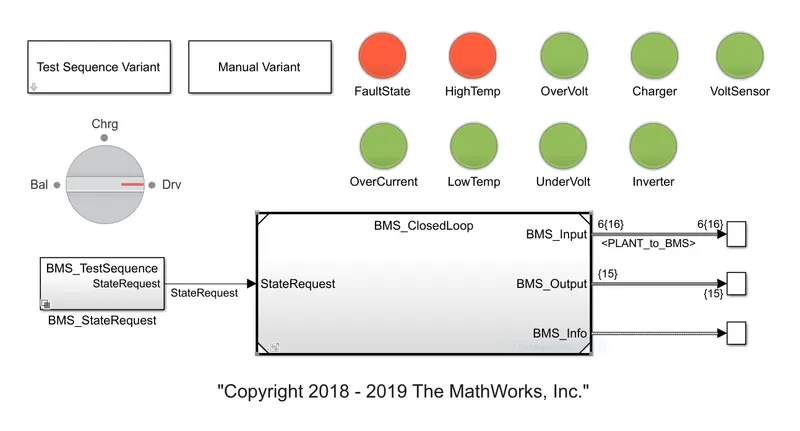
The simulation is to run for 20000 seconds in which the first 5000 seconds is the discharge or the
driving mode then the rest of the time is set to charge the battery.

Output:
Comments:
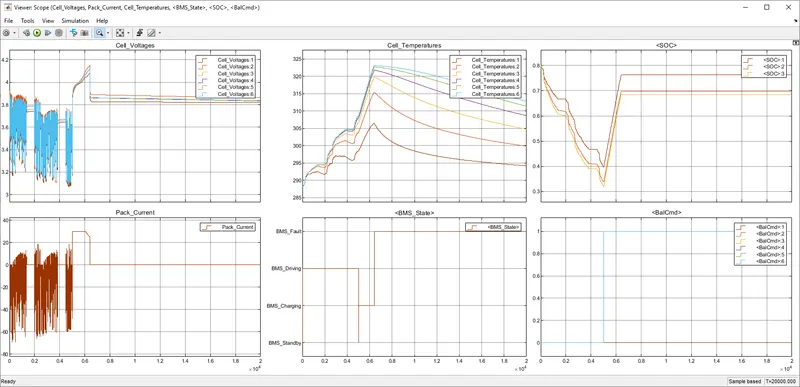
1. The first plot with Cell_Voltages displays the voltages of all 6 cells connected in the series. While
the first 5000 seconds the voltage of the cells drops as the battery is discharging and then while
charging the cell voltage increases and while the cell balancing the voltage stabilizes.
2. The second plot with Pack_Current represents the current drawn and given to the battery while
charging and discharging. It is also seen that while charging, first the current remains constant, and
then it drops its charges in constant voltage mode.
3. The third plots the cell temperature of all individual cells and we can see then while charging and
discharging the cell temperature increases, at about 6000 seconds the cell temperature of the 6th
cell increases to about 323.15 Kelvin, and the battery is sent to fault state.
4. The fourth plot shows the input state as per the given state input until the fault occurs at about
6000 seconds.
5. The fifth plot shows the state of charge of the entire pack by 3 different methods of calculation.
The soc curve decreases as we discharge the battery and increases while charging. The battery is
charged up to 70-75% and stops charging once the fault occurs.
5. The sixth plot shows the cell balancing command for all six cells. The 1st cell is having the lowest
voltage does not need balancing thus we can see that all the other cell's signal have a magnitude of
1 whereas the 1st cell signal is at zero magnitudes. The cell balancing starts when the battery starts
to charge and at the onset of the fault the battery charging is stopped but the balancing happens.
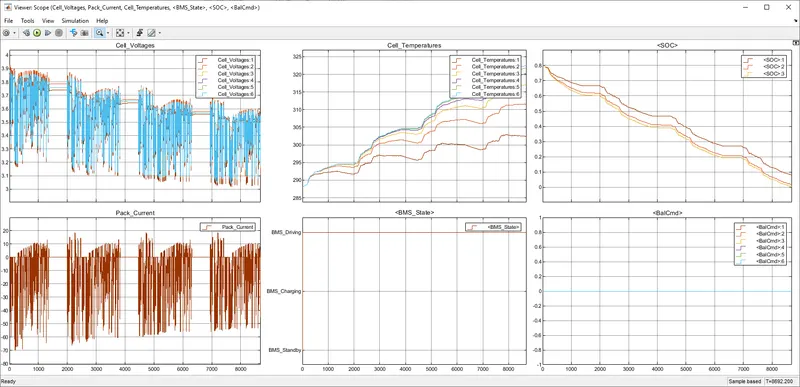
Test Case 3:
The simulation is run for 20000 seconds in which the first 10000 seconds is the discharge or the
driving mode then the rest of the time is set to charge the battery.

Output:
Comments:
The first plot with Cell_Voltages displays the voltages of all 6 cells connected in the series. The cell
voltage keeps on dropping as the battery keeps on discharging up to zero state of charge and the
simulation is stopped.
2. The second plot with Pack_Current represents the current drawn and given to the battery while
charging and discharging. Here we can see that battery repeats the charging and discharging pattern
as explained above in the charging and discharging load.
3. The third plots the cell temperature of all individual cells and we can see then while charging and
discharging the cell temperature increases.
4. The fourth plot shows the input state as per the given state input, the simulation only runs in
discharging mode and when the SOC reaches zero the simulation is stopped at about 8692 seconds.
5. The fifth plot shows the state of charge of the entire pack by 3 different methods of calculation.
The soc curve decreases as we discharge the battery and increases while charging. Here the battery
keeps on discharging as the regenerative charging is very less.
6. The sixth plot shows the cell balancing command for all six cells. The cell balancing does not take
place as the simulation runs only in a driving state.
Answer 2:Coulomg Counting:
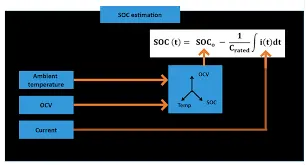
Coulomb counting is a technique used to track the state of charge of a battery pack. It works by
integrating the active flowing current (measured in amps) over time to derive the total sum of
energy entering or leaving the battery pack. This produces a capacity that is typically measured in
Amp-hours.
The Coulomb counting method measures the discharging current of a battery and integrates the
discharging current over time in order to estimate SOC. It is done to estimate the SOC(t), which is
estimated from the discharging current, I(t), and previously estimated SOC values, SOC(t-1). SOC
is calculated by the following equation:
SOC = SOC(t-1) + I(t)/Q(N) .Δt
Where,
SOC(t) = State of charge at estimated time
I(t) = Discharging current
Q(N) = Nominal battery capacity.
But there are several factors that affect the accuracy of Coulomb counting method including
temperature, battery history, discharge current and cycle life
Refer above 'BMS Closed Loop' model and explain how BMS implements coulomb counting for SOC
estimation:
Following are the steps going to follows for implementing coulomb counting for SOC estimation in
BMS,
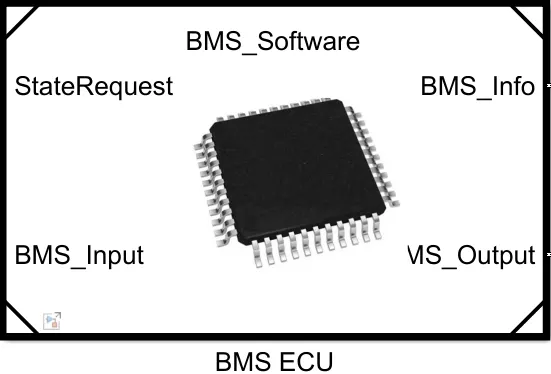
Step 1 - First, open the 'BMS ECU' subsystem
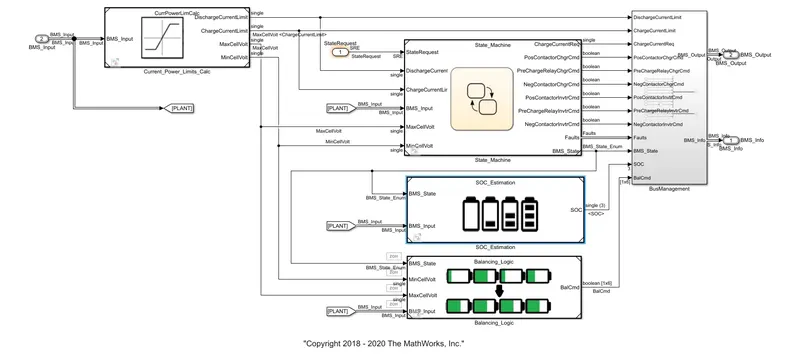
Step 2 - Followed by selecting the 'SOC Estimation' subsystem
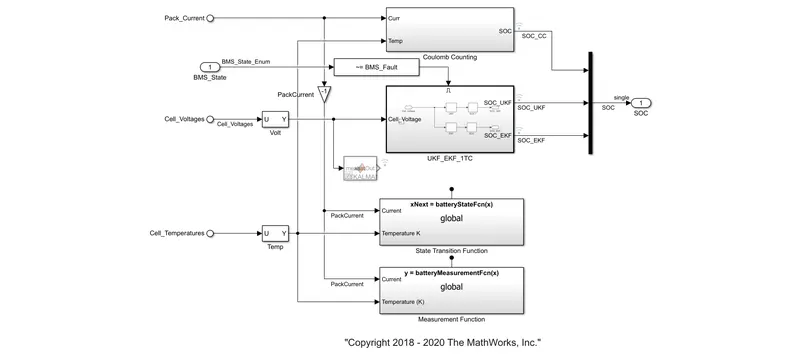
So as per SOC Estimation subsystem opens, we get
EXPLANATION:
1. Coulomb Counting:
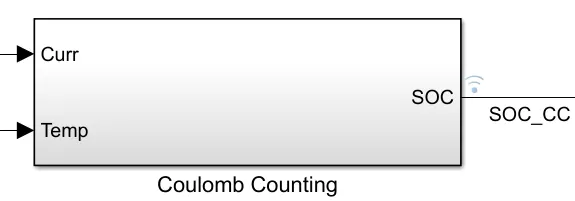
- In simulink, the CC has received the two inputs of current and temperature for the SOC estimation
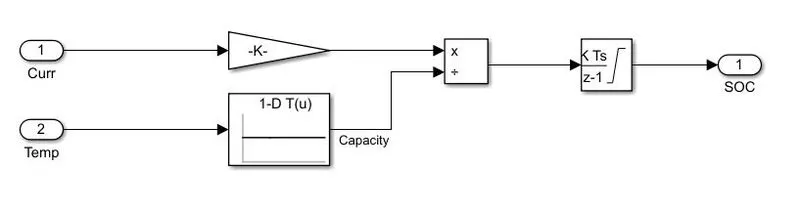
Fig. Coulombs Counting Method
1. The discharge current signal is converted from the physical system using a gain block.
2. The gain block is integrated by { 1 / 30.3600 } is applied to the integrated signal which
gives us the discrete data.
3. The temperature data is divide by using a lookup table with the discharge current rate.
4. The output is then integrated with a discrete-time integrator block with a sample time of 0.1 sec
to calculate the SOC of the battery pack.
In coulomb counting (CC) subsystem,
1. The current input has calculated with the gain block to gets the output in a specified gain factor
2. The another input of temperature were passed to 1-D lookup table block to evaluate a sampled
representation of a function in N variables
3. Now both were calculated passed to the 'Discrete-Time Integrator' block which has placed in
the integrator block to create a purely discrete model. Here the integrator method of output was
'Forward Euler'(y(n) = y(n-1) + K .[t (n) - t( n - 1)]. u( n - 1)) and the initial condition were
set
2. Kalman Filter:
1. Kalman filtering is an algorithm that provides estimates of some unknown variables given the
measurements observed over time
2. It have been demonstrating its usefulness in various applications. Kalman filters have relatively
simple form and require small computational power
3. However, it is still not easy for people who are not familiar with estimation theory to understand
and implement the Kalman filters
3. Kalman filters are used to estimate states based on linear dynamical systems in state space
format
4. Using real-time measurement road data to estimate the SOC of battery would normally be
difficult or expensive to measure
5. An extended Kalman filter (EKF) is to estimate the concentrations of the main chemical species
which are averaged on the thickness of the active material in order to obtain the SOC of the battery,
by using the terminal current and voltage measurements
6. The UKF method is superior to extended Kalman filter method in SOC estimation for battery. An
adaptive UKF method to estimate SOC of a lithium-ion battery for battery electric vehicles
7. The adaptive adjustment of the noise covariance in the SOC estimation process is implemented
by an idea of covariance matching in the UKF context
In Kalman Filter (KF) Subsystem,
1. In UKF, a dynamics model describing object's motion and it is the optimal algorithm for its state
estimation if the model of the system is linear and when disturbances of the process and
measurements errors are additive and Gaussian
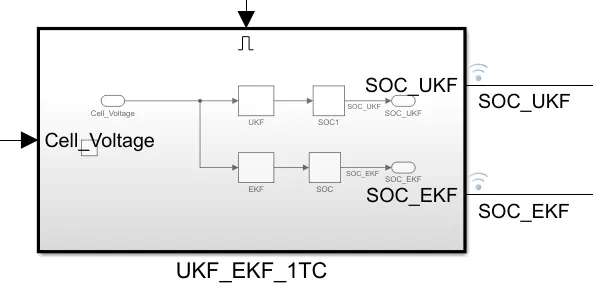
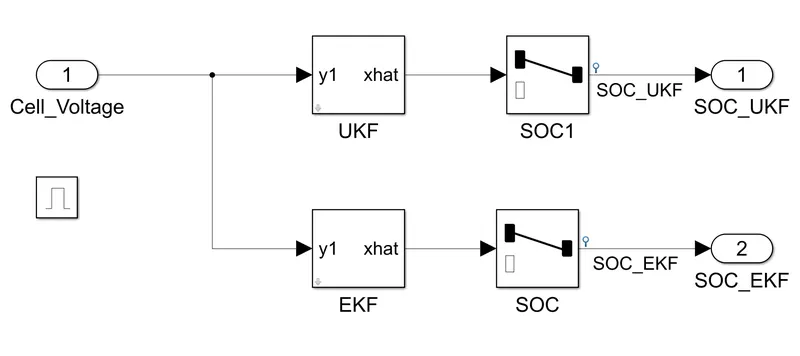
2. The cell voltage from the cell pack has passed to the 'unscented kalman filter' block to estimates
the states of a discrete-time nonlinear system using the discrete-time unscented Kalman filter
algorithm
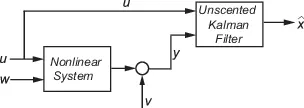
3. Consider a plant with states x, input u, output y, process noise w and measurement noise v.
Assume that we can represent the plant as a nonlinear system
4. The output for the current step has produced with the help of state transition and measurement
functions of the system and the unscented kalman filter algorithm
5. In EKF, most systems of interest the dynamics and observation equations are non-linear. When
at least one of the equations describing the system is non-linear, the Kalman Filter cannot be
applied. Therefore, suboptimal non-linear filtration algorithms such as an extended kalman filter
(EKF) have been developed
6. In EKF, the non-linear functions are locally approximated with linear equations obtained from
'Taylor expansion'
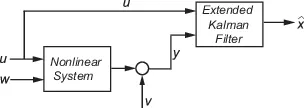
7. The extended kalman filter block has works similar like the unscented kalman filter block by the
same process with some changes
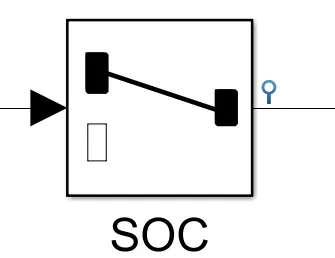
8. And the both UKF and EKF block has handled by using the 'selector' block to generates the output
by selected or reordered the elements of an input from those filters
9. Finally, both results of the coulomb counting and kalman filter were passed to the SOC estimation
to display the SOC status during the vehicle's three kind of states (driving, balancing and charging)
Coulomb Counting and Kalman Filter Combination:
1. A new SOC estimation method, denoted as "KalmanAh method", which uses the Kalman filter
method to correct for the initial value used in the Coulomb counting method
2. In KalmanAh method, the Kalman filter method is used to make the approximate initial value
converge to its real value
3. Then the Coulomb counting method is applied to estimate the SOC for the long working time
4. The SOC estimation error is 2.5% when compared with the real SOC obtained from a discharge
test. This compares favorably with an estimation error of 11.4% when using Coulomb counting
method
Conclusion :-
1. The Battery Management System Model by Simulink is simulated and the output is studied based
on the given test conditions.
2. Coulomb Counting method to estimate the state of charge is explained along with the simulink
model in the BMS system.