Week-4 Challenge WOT Condition Part-2
Aim: To study the Wide Open Throttle condition foe HEVs and EVs.
Objectives:
1. What is the difference between the mapped and dynamic model of engine, motor and
generator? How can you change the model type?
2. How does the model calculate miles per gallon? Which factors are considered to model
fuel flow?
3. Run the HEV Reference Applications with WOT drive cycle. Change the grade and wind
velocity in the environment block. Comment on the results.
4. Keeping all other parameters the same, compare the simulated results of hybrid and
pure electric powertrains.
Que.1) What is the difference between the mapped and dynamic model of engine, motor
and generator? How can you change the model type?
Solution-
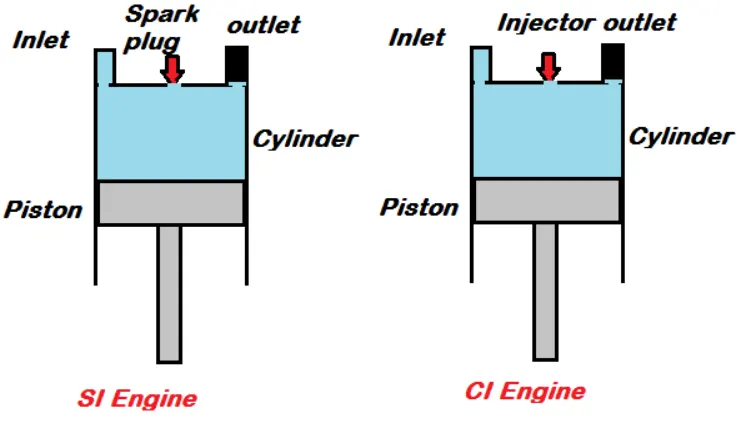
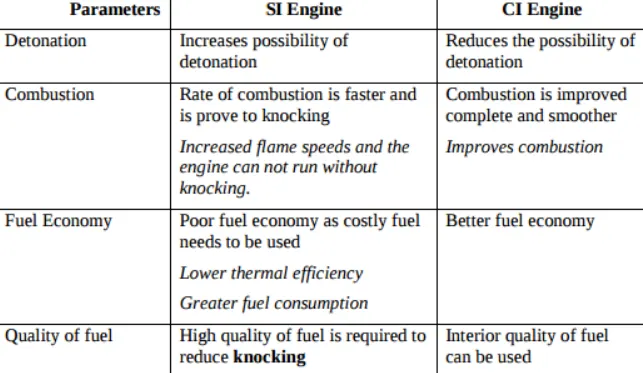
a) For engine:
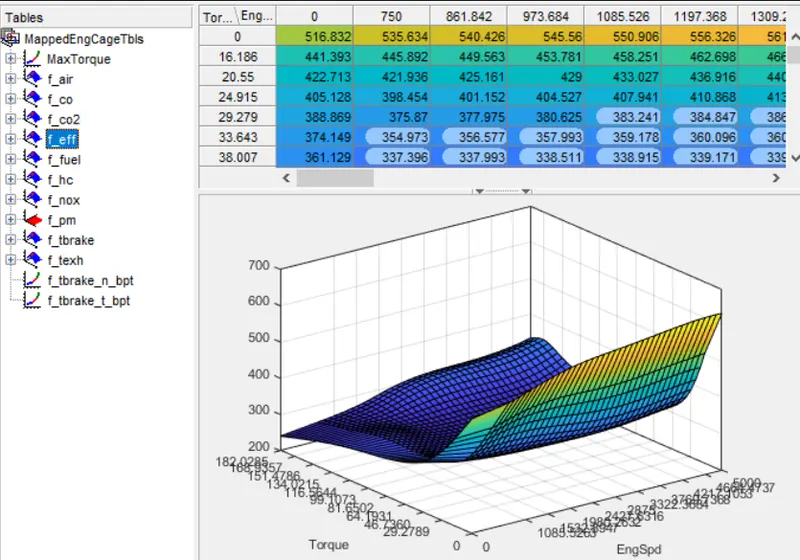
Type- mapped (Ci mapped engine / Si mapped engine)
Implementation- Model uses a set of steady-state lookup tables to charecterize engine performances.
The tables provides overall engine charecteristics, including actual torque, fuel flow rate, BSFC, and
engine - out exhaust emissions.
When to use - 1. If you have engine data from a dynamometer or a design tool like GT-POWER.
2. For quasi steady - state engine simulation.
Type- Dynamic(Ci engine / Si engine)
Implementation- Model decomposes the engine behaviour into engine charecteristics that are
separated into lower-level components. By combining components in this way, the models
capture the dynamic effects.
When to use- 1. If you need a more detailed dynamic model and have compnent level data.
2. To analyze the impact of individuals engine components on the overall performances.
b) For motor:
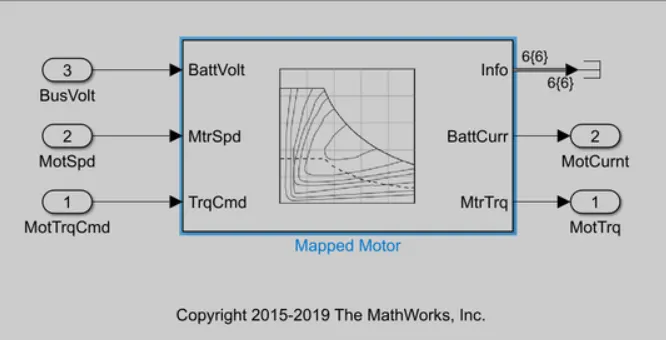
Type- 1.Mapped motor
Implementation-The mapped motor block implements a mapped motor and drive electronics
operating in torque control mode. The output torque tracks the torque reference demand and
includes a motor-response and drive response time constant. Use the block for fast
system-level simulation when you do not know detailed motor parameters, for eg. for
motor power and torque tradefall studies. The block assumes that the speed fluctuations
due to mechanical load do not affect the motor torque tracking.
Type- 2. Dynamic motor
Implementation- 1.The DC motor circuit diagram is represented.
2. The system equations are created.
3. The transfer function is calculated.
4. Then the model block diagram is prepared.
5. Then it is done to simulate model in programming MATLAB.
6. And finally the performance analysis is carried out.
c) For generator:
Types of modelling-
1. Mapped Generator
Implementation- This is also similar to mapped motor modelling where the input values for
generator blocks are predefined or taken from the lookup tables here also simulaton time is
very less.
2. Dynamic Generator
Implementations- This model also represents an actual generator working in real-time
environment. Where the output values calculated continuously according to change in
input values as the equation is implementing. Simulation time is more compared to the
mapped generator.
- To change model type from mapped to dynamic or dynamic to mapped
- After entering into passenger block > electric plant > motor will get this window where
MotGenMapped is by default selected as a model type for motor.
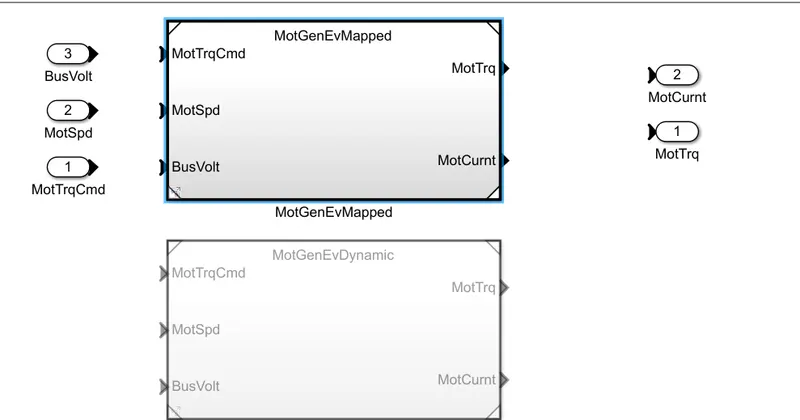
- To change from MotGenEvMapped to MotGenEvdynamic,
- first, we open our references model into MATLAB.
Here we are choosing EV as an example.
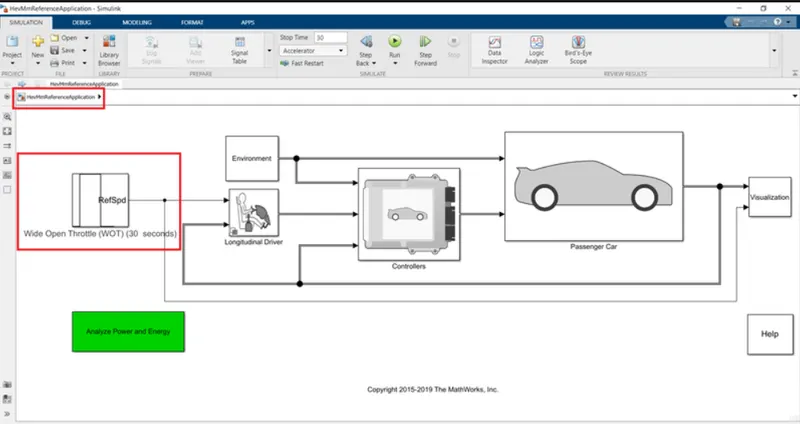
Then after clicking on the modelling section and after that in the design block, we will select the varient manager
option.
- after that variant manager window gets opened.
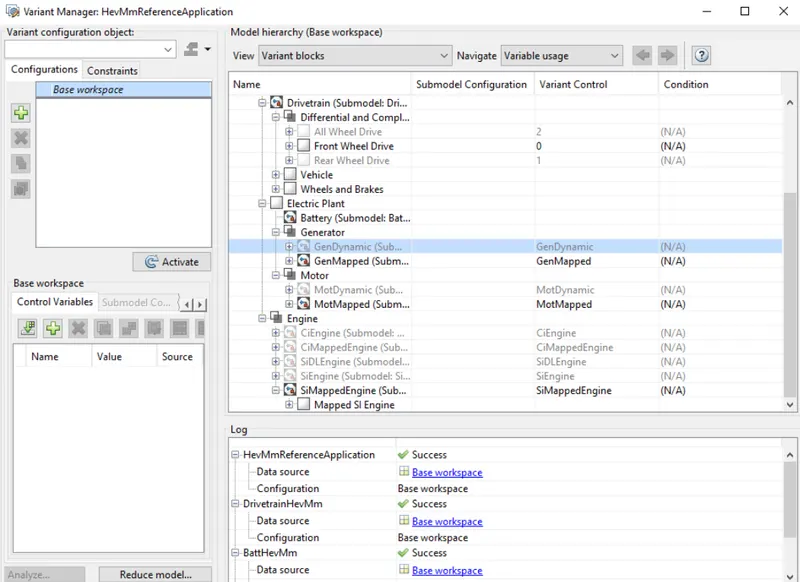
then by clicking on the passenger car expand option there will electric plant option will expand that too in that
will get both battery and motor.
- We are taking motor as an example so after expanding the motor option we will get,
1. MotEvGendynamic
2. MotGenEvmapped
so that default one is MotGenmapped to change into MotGenEvdynamic.
We need to right click on our preference and after that, a pop up will be shown in which we need
to select ' set as label mode active choice ' and after that our motor variant will be MotGenEvdynamic.
- Same we can do for the battery too .
- To verify whether its change or not will return to our model and open passenger block> electric
plant> motor and clicking on the motor block will get this window.
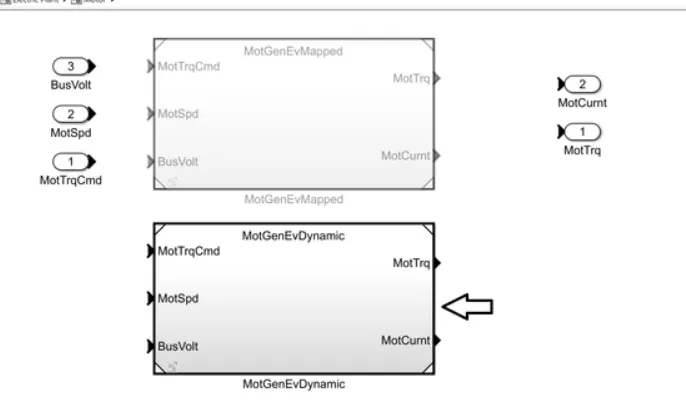
-As we can see we changed our variant from MotGenEvmapped to MotGendynamic.
- A same procedure we can do for changing variant from MotGendynamic to MotGenmapped
for both battery and motor.
Que.2) How does the model calculate miles per gallon? Which factor are considered to
model fuel flow?
Solutions:
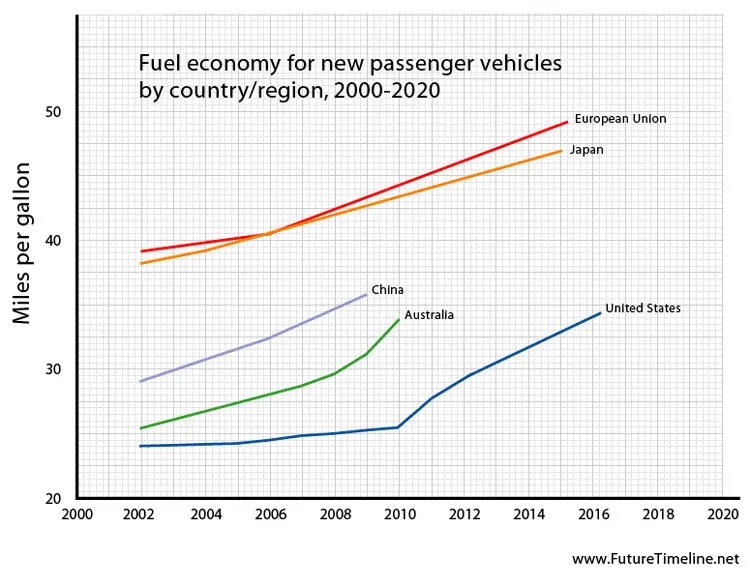
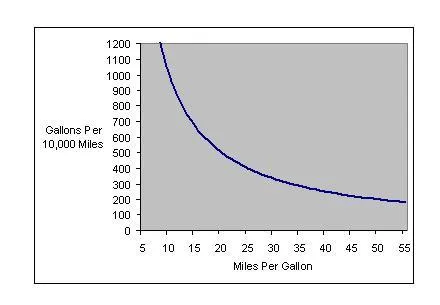
Theory- MPG or miles per gallon is the distance measured in miles, that a car can travel per
gallon of fuel. MPG is also the primary measurement of a car's fuel efficiency. The higher a
car's MPG , the more the fuel-efficient it is.
The U.S. Environment Protection Agency , or the EPA, is the government agency responsible
for certifying a vehicle's MPG figures, notes how stuff works.
A car's MPG can be inconsistent because it is affected by a number of a different factors, so
it is difficult to get an accurate measurements. For eg. factors like traffic and road condition
can affect MPG in any given context. That's why the EPA runs tests over a standard set of
courses, then averages the result to calculate a vehicle,s official MPG.
The EPA gives each vehicle three different MPG ratings, as all car leasing notes:
1. Highway MPG: The average a car will get while driving on an open stretch of road wi-
thout stopping or starting typically at a higher speed.
2. City MPG: The score a car will get on average in city conditions, with stopping and
starting at lower speed.
3. And combined MPG, a combined average of highway and a city MPG.
In recent years, the EPA has expanded its testing capabilities to include alternatively
fuelled vehicles including electric vehicles. These ratings calculate the equivalent amount
of energy that a vehicle uses to one gallon of traditional fuel. This allows consumers to
compare the fuel efficiency of electric vehicles with regular ones.
MPG is an important metric to know about any vehicle that you are considering
for purchasing. it tell us about the difference in cost between operating different
vehicles by giving us a sense of how much money we are likely to spend on fuel.
This becomes especially important when fuel prices are higher, since every bit of
saving count for our budget.
While MPG can help us compare different vehicles, it doesn't tell us anything about
real-world fuel prices. However, we can easily calculate approximately how much we
will spend on fuel at different price levels, depending on how much distance we drive
on a regular basis.
How does the model calculate miles per gallon?
- To calculate the fuel flow, vehicles speed and battery power are taken into considearation.
HEV model has separate block to calculate the MPG which are shown below.
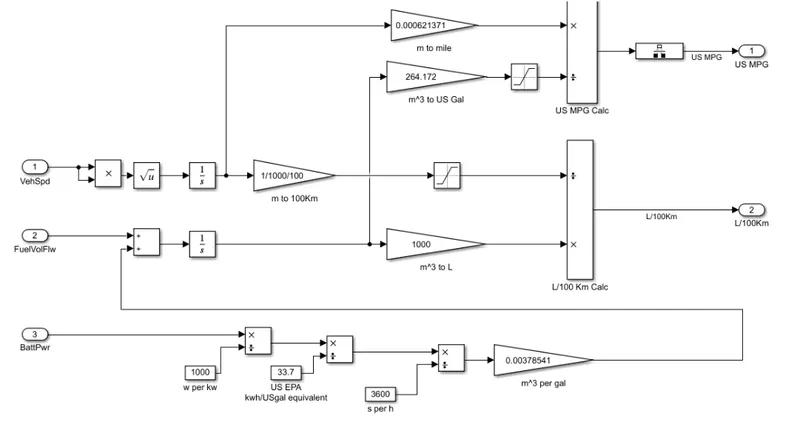
The above MPG calculation is for HEV which means it contains both fuel and battery energy.
- First we get battery power in watt which is converted into kwatt and further converted into
kw/h.
- Then it is converted into US gallon equivalent energy by dividing it by the standard value
33.7. Then converted into US gallon per second.
- It is multiplied by standard value 0.00378541 to get volume in meter cube per gallon
and it is added to the fuel flow for total value as it is an HEV.
- Further meter Cube is converted into US gallon.
On the other hand, the speed of the vehicle is integrated to get distance and the distance which
is in the meter is converted into mile by multiplying the standard value 0.000621371.
For EV's
In the case of pure electric vehicle (EV) the term miles per gallon equivalent to (MPGe).
While the use of MPGe helps compare fuel efficiencies between vehicles, it has some limitations.
The first limitations is that MPGe, like MPG, suffers from the "MPG illusions". So a better unit
might be GGE per 100 miles or gasoline literb equivalents per 100 kilometers. The second
limitations is that calculating the CO2 emmisions for an alternative fuel vehicle becomes diffi-
cult. The EPA only includes tailpipe emissions for vehicles. This is not much of a problem for
gasoline or diesel fuel because of their energy density compared to production, transportation
and storage emissions. However, CO2 emissions from the electricity needed to compress
natural gas, keep liquid natural gas cold or separate water to make hydrogen, or charge a
battery are significant and are not included depending on the location and type of fuel. It is
possible that using an alternative fuel vehicle will produce more CO2, emissions or use more
energy than a similarly sized gasoline or diesel-fueled vehicle.
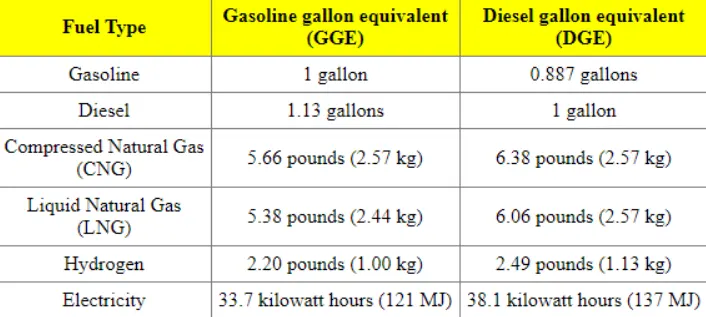
Here the value 33.7 kwh is the battery power required to get the energy equivalent to the energy which
is obtained by consuming the 1 gallon of gasoline. It is calculated by the United States Environment
Protecting Agency(EPA).
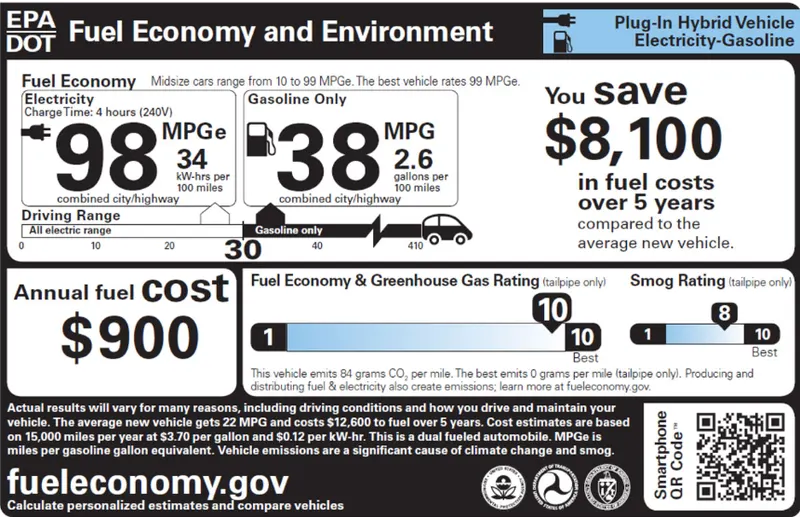
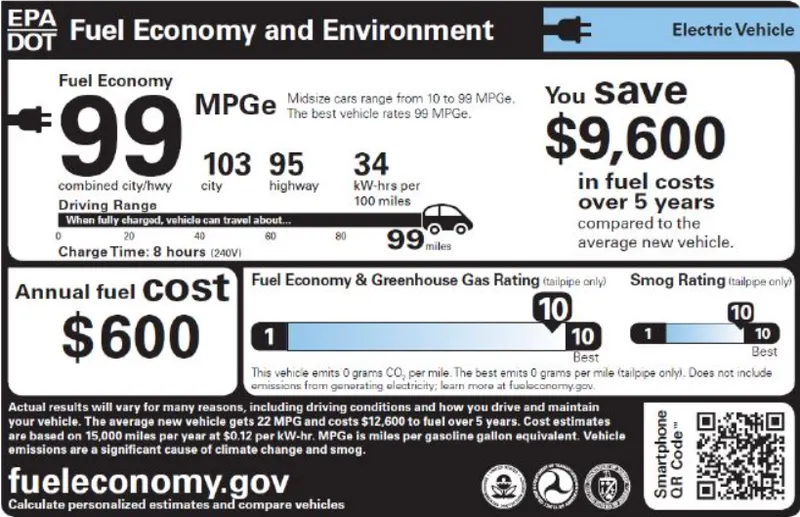
There are samples stickers of HEV and EV provided by EPA:
1. For HEV-
2. For EV-
Which factors are considered to model fuel flow?
Ans- 1. Vehicle speed.
2. Fuel flow.
3. Battery power.
Que.3) Run the HEV References Application with the WOT drive cycle. Change the grade and
velocity in the environment block. Comment on results.
Solution:
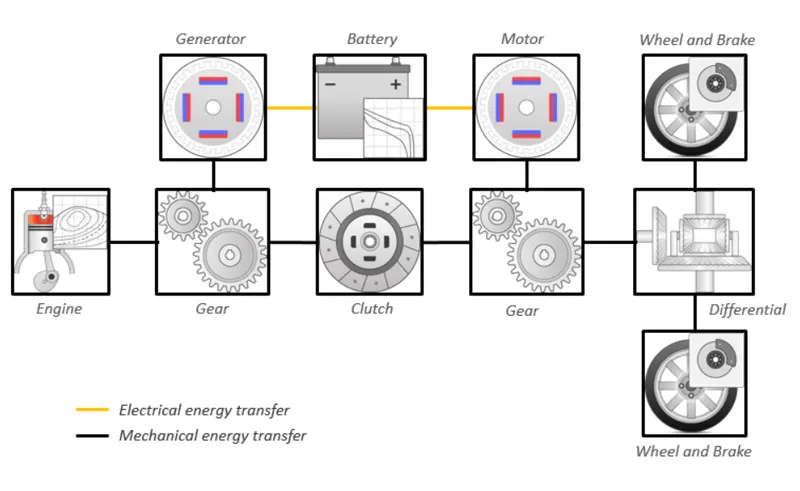
HEV Reference Application Model with WOT-
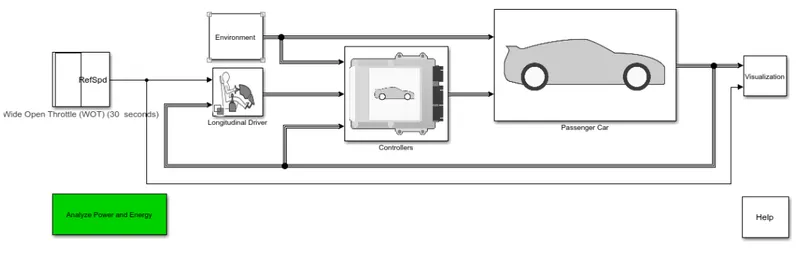
Simulink model for HEV-
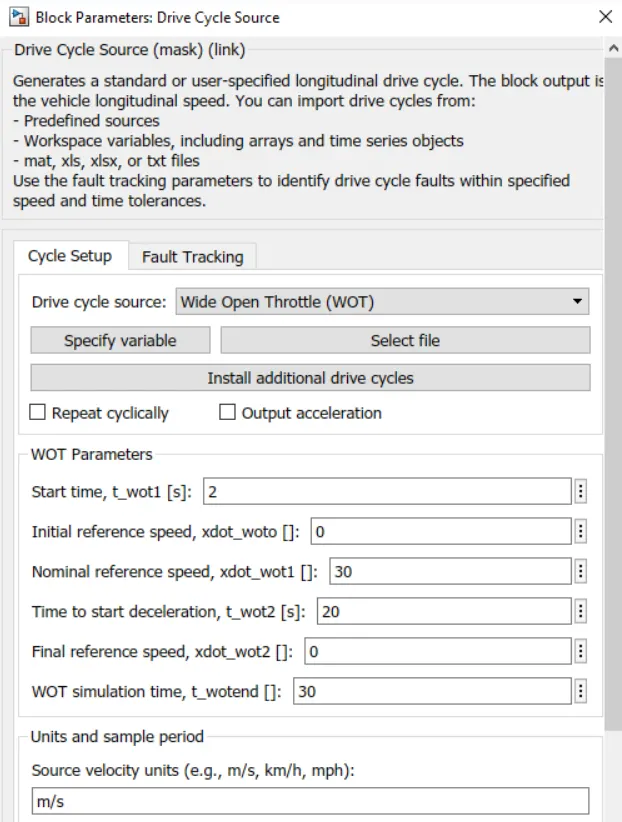
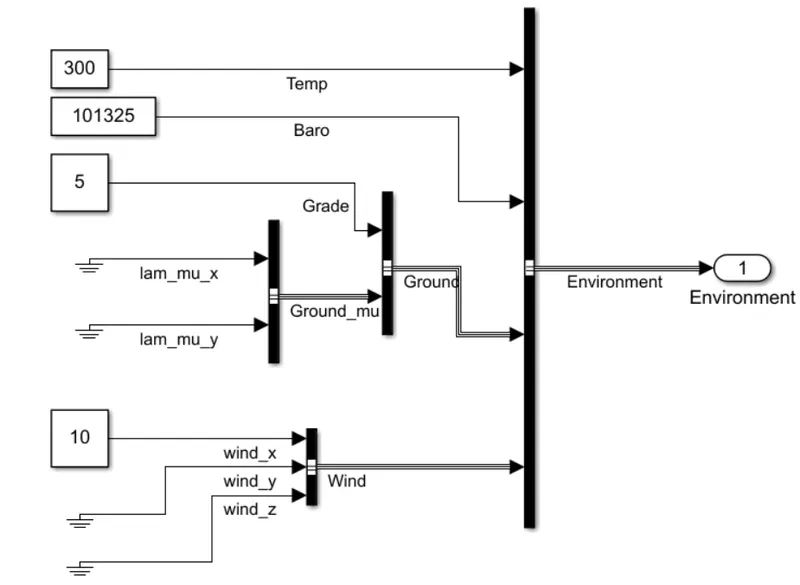
Environmental conditions: Grade=5; & Wind velocity=10m/s
Result: Below results can be seen through the scope in the visualization block.
1) HEV with WOT with default Environment conditions.
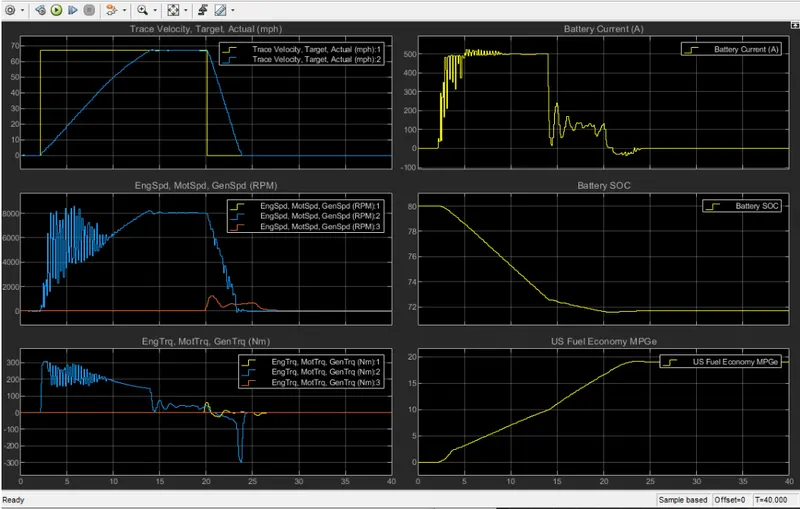
2) HEV with WOT with Environmental conditions.
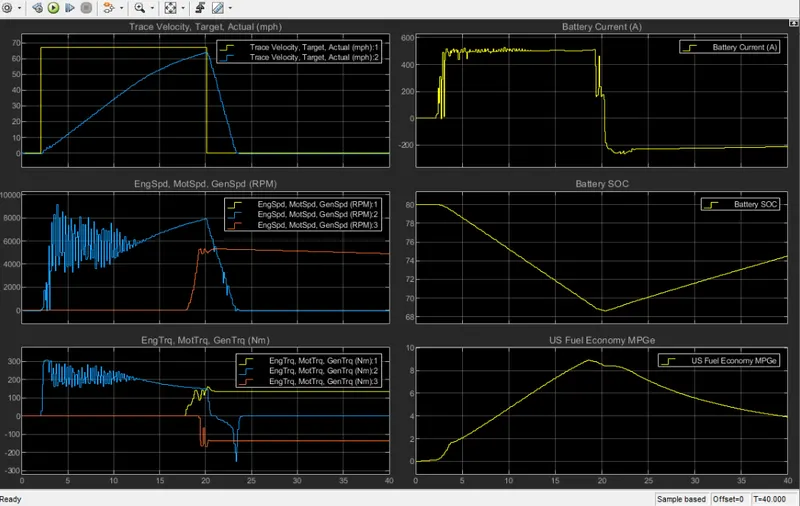
From the above results,
Graph 1- Trace velocity - Target vs Actual
The yellow indication is the target path and the blue indication is the actual vehicle speed. Here it is seen
That vehicles requited around 20 sec to attend maximum speed toward the target path by using battery power
own. After that vehicles starts to decelerates.
Graph 2- Engine , Motor and Generator speed.
As the battery is fully charged, an initial condition only motor speed (blue indication) is used
which high at starting because of resistance due to slope & wind velocity. The engine speed (yellow
indication) is overlapped with generator speed ( orange indication) indicating both running at on
same rpm. Initial there is no need for engine & generator speed as the motor is fulfilling the
requirements to achieve the maximum speed of the vehicle. Therefore, they are at 0 rpm. But
when the battery will discharging or when the state of charge(SOC) becomes below 70% then only
engine will start to rotate to provide and maintain the speed of the vehicle and so far generator will
also start to charge on battery at the same time. Hence their rpm are the same.
Graph 3- Engine Torque, Motor Torque and Generator Torque
As the battery is being used at the start , so torque will also maximum for the motor in this
case until the vehicle aquires its maximum speed. Once the vehicle reached at a constant speed ,
the torque requirement will reduce. Here also when there is deceleration, the torque value becomes
negative indicating no need of torque. Also it becomes constant once the battery goes into charging
state cause now here engine torque is being used due below 70% SOC. Also, generator torque will
be negative that Electric Motor is charging & in this period Engine has overcome the torque requi-
rements of the vehicle successfully.
Blue indication- Motor torque
Yellow indication- Engine torque
Orange indication- Generator torque
Graph 4- Battery current
Battery current is a sample term. when a vehicle uses electric motor then only it
is used to generate power for motor. When the vehicles decelerates, then no current is
extracted to produce poer for the motor. From the graph also you can see, the current
requirements becomes stable while charging the mode of the battery.
Graph 5- SOC
State of Charge(SOC) is important for battery - driven vehicles. From the graph, it
can be seen that when the battery is below 70% , it goes in charging mode and hence
SOC is also increased due to charging of the battery through the generator. Hence it can
be used further once it gets fully charged.
Graph 6- MPGe
The graph shows the miles per gallon equivalent require to run the vehicles.
Que.4) Keeping all other parameters the same, compare the simulated results
of hybrid and pure electric powertrain.
Solutions:
EV Reference Application Model with WOT-
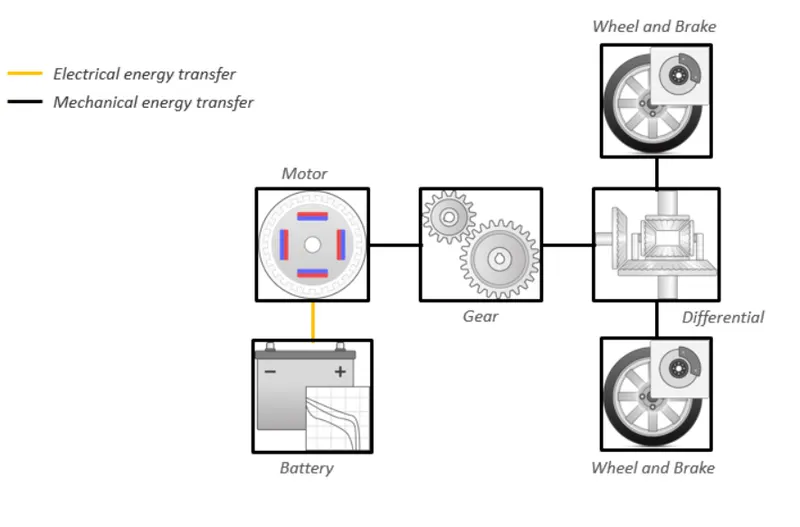
Simulink model for EV:
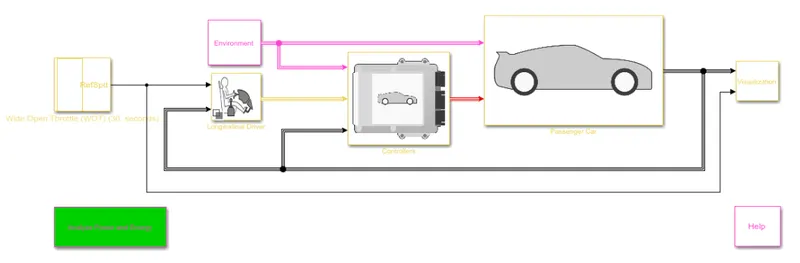
WOT condition:
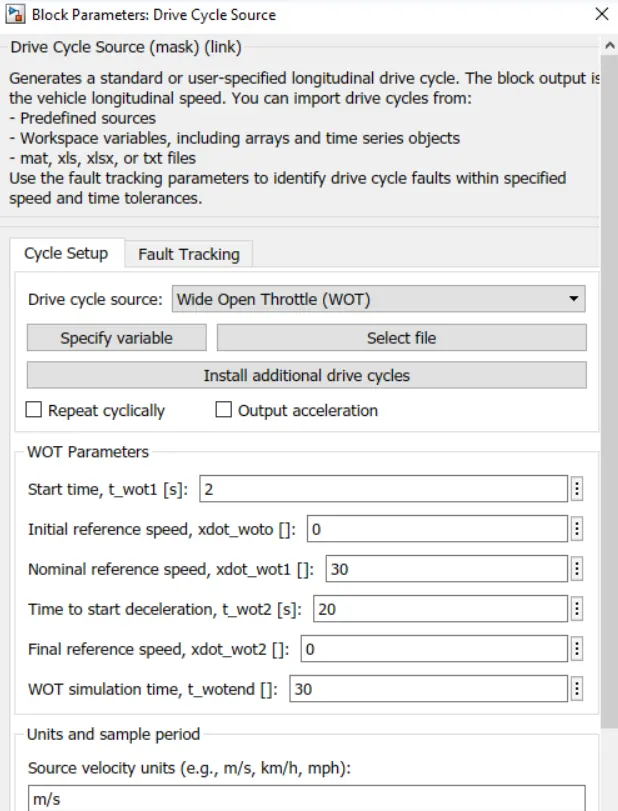
Environmental Conditions: Grade = 5 and Wind velocity= 10m/s
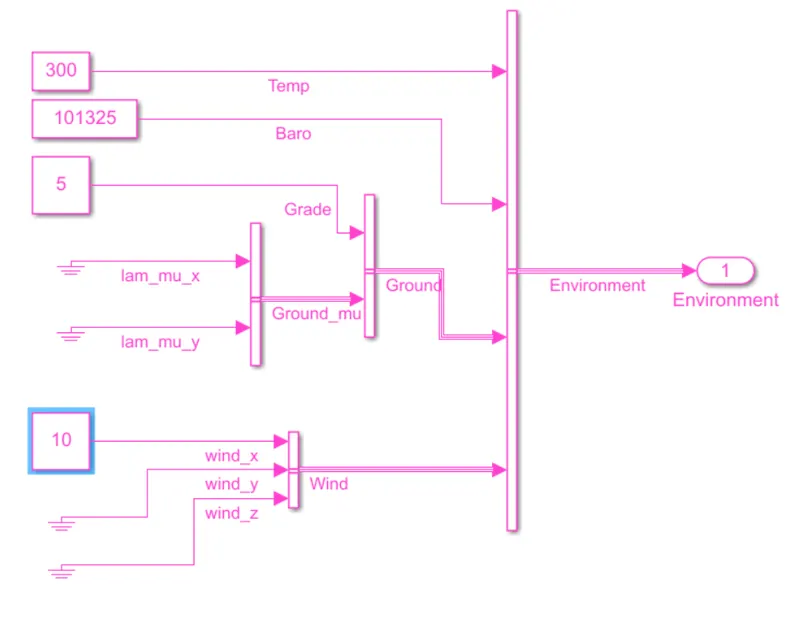
Result- Below results can be seen through the scope in the visualization block.
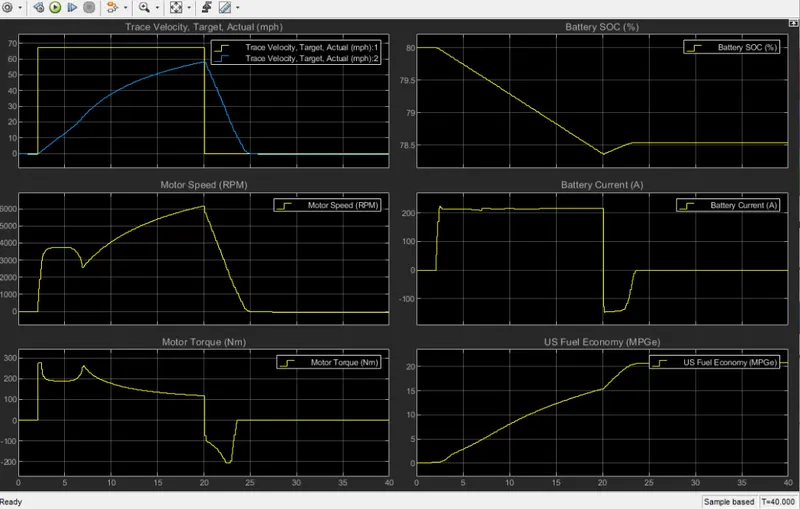
From the above graph;
Pure EV can achieve less velocity than that of HEV. HEV can attend velocity above 60 mph but in pure
EV velocity is less than 60mph.
Motor speed in rpm is also less than that of HEV. But the path tracing is the same as that of HEV.
But the motor torque of pure EV is almost the same as that of HEV.
Battery current uses is almost half in pure EV to produce power as that of HEV.
Also as battery use is less, battery draining is low and it can be seen from the soc graph . From
the soc graph, it can be seen that for the same parameters battery uses is 5 times more in the
case of HEV than that of pure EV, battery drains fast in the case of HEV.
Fuel economy is also almost double in the case of pure EV than that of HEV.
Conclusions:
In this report, we have successfully studied HEV and pure EV vehicles models along with a
change in output w.r.t. change in input conditions. And also benefits of EV at some extent
are known over the traditional gasoline engines.
References:
https://in.mathworks.com/help/autoblks/ug/explore-the-electric-vehicle-reference-application.html