Week 7 State of charge estimation
Question:1
Aim: To Simulate the 3 test cases from harness dashboard and write a detailed report on the results
Answer:
- Here first we need to simulate the 3 test cases from the harness of dashboard
- so we need to select the harness dashboard from the project file which we have downloaded with the reference link shown below
- After downloading the file from the above link we have to extract the zip file to a floder and then i choose again battery_system_R2020a to extract to a folder
- Then in the next step we need to get the acces to the closed loop BMS harness dashboard we have to check fro the below model
- Test<system<BMS_closedloop_harness_dashboard model file
- After opening this file matlab will ask following question
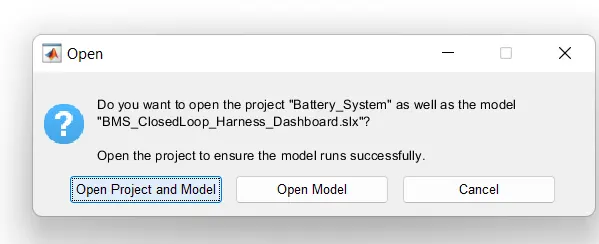
- So here i have selected to open project and model and after that the whole project will be loaded in the matlab in current folder and workspace
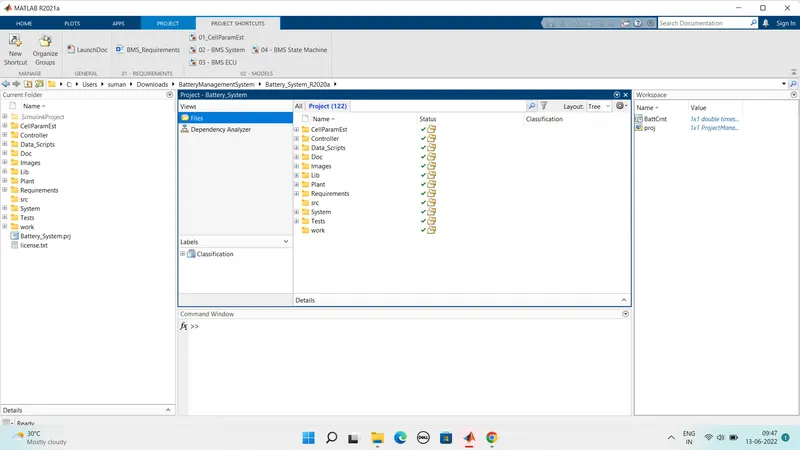
After this the BMS_closedloop_Harness_dashboard model file is opened as shown below:
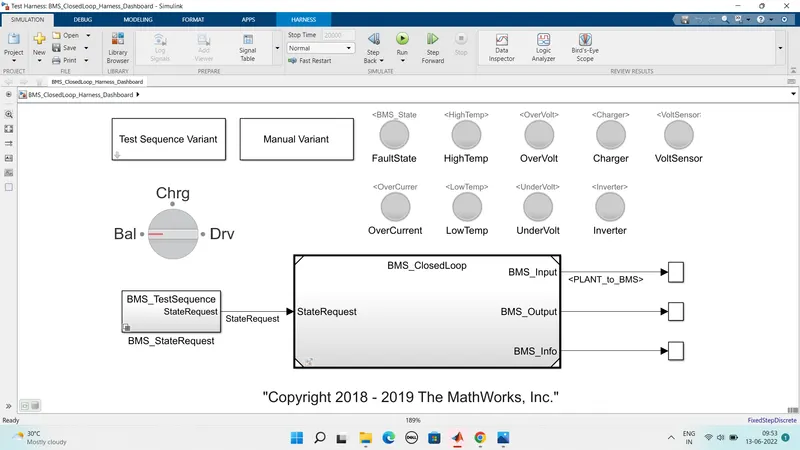
Test sequence Variant (it has 3 different test condition):
- THe Indictaing lamps are there to show any fault state High Temp Overvoltage Charger Voltage Sensor Overcurrent Low temp Under Voltage Inverter state of a battery.
- The Green light tell us that all states are Ok and battery is good to charge and discharge and red indication will indicate the fault state. •
- The Rotating switch for manual variant to change the position during simulation run time
1st test :
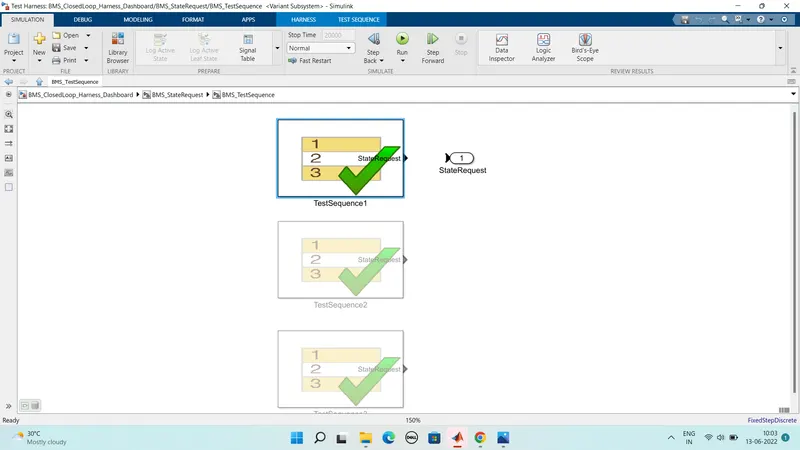
- Here the Test case 1 is selected as shown in the below figure
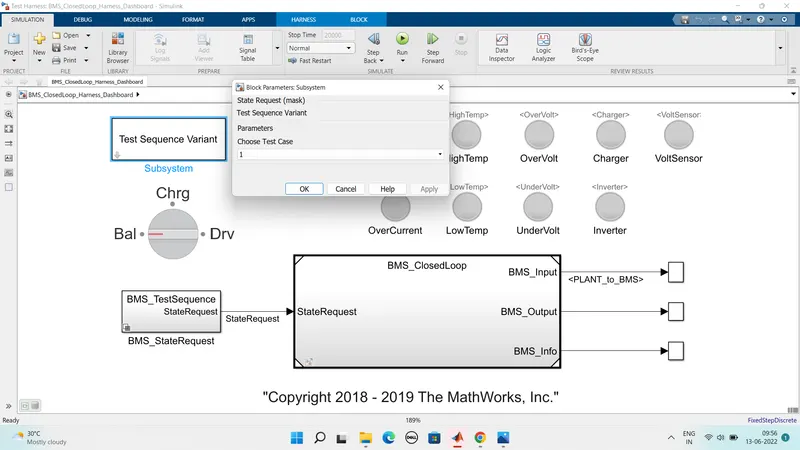
Here we can see that the testsequence in BMS_state sequence>BMS_test sequenc and there aslo we can see that test case we have selected shown below
Now here we can see that what are test condition we have double click on the test sequence and the test sequence will show below figure
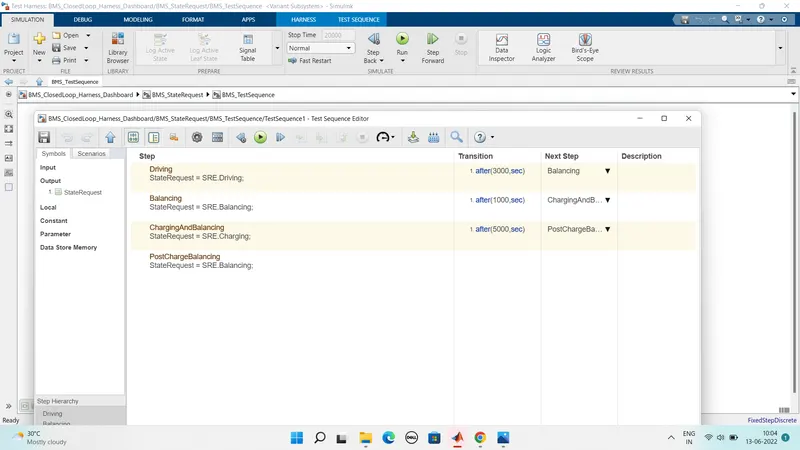
- Here from the above figure it tells about the test sequence
- For driving is done for first 3000sec
- Then after driving balancing of cell comes for the next 1000sec
- So after the balancing charging and balancing comes for next 5000sec
- But in post charging balancing it occuring after the 9000sec till the 20000sec
Results for test case 1:
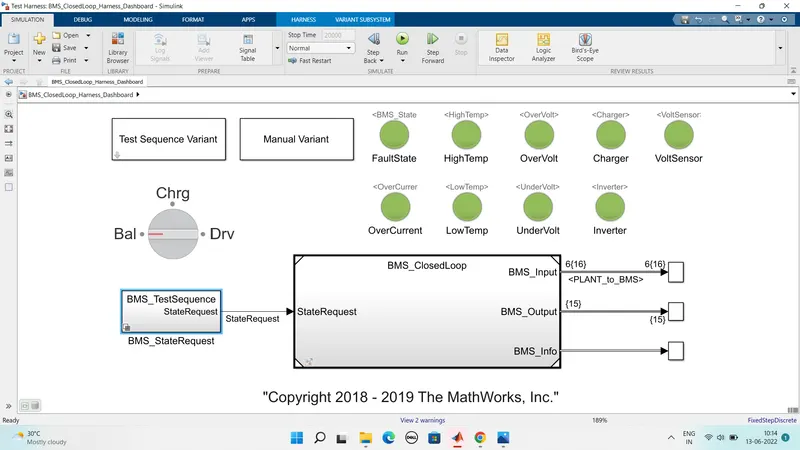
- Here we can see that all the indicators are green.
- So we can see no errors and we check the plot for this model and is shown below.
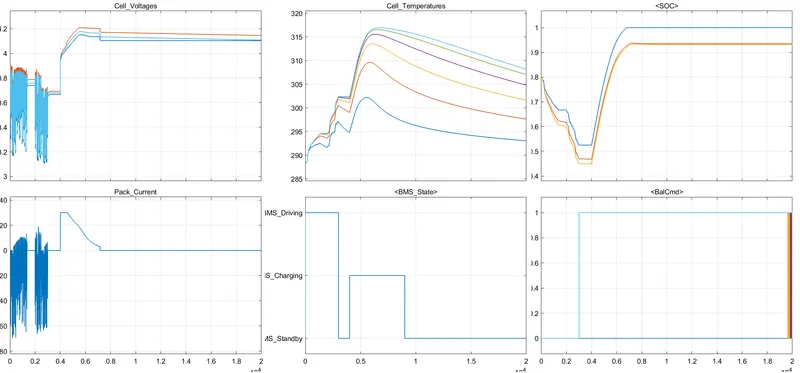
- From the above plot we can see the vehicle is initially in a driving state and charging was done to 90%.
- So After charging it reaches standby mode. It can be seen in the BMS state plot. Battery temperature increases in driving and charging.
- The Battery voltage was increased to 4.2V while charging.
- The current plot shows the value of current supplied to the vehicle while driving.
- Hence SOC decreased up to 50% in driving conditions and it was increased while charging
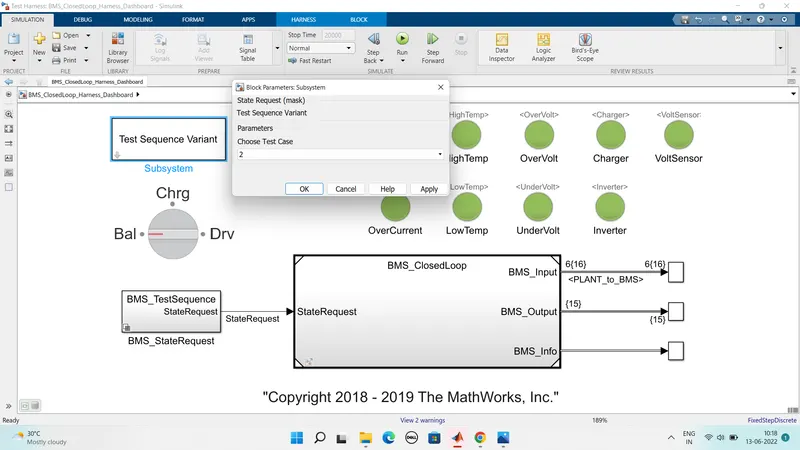
Here we changed test sequence number from the subsytem to 2
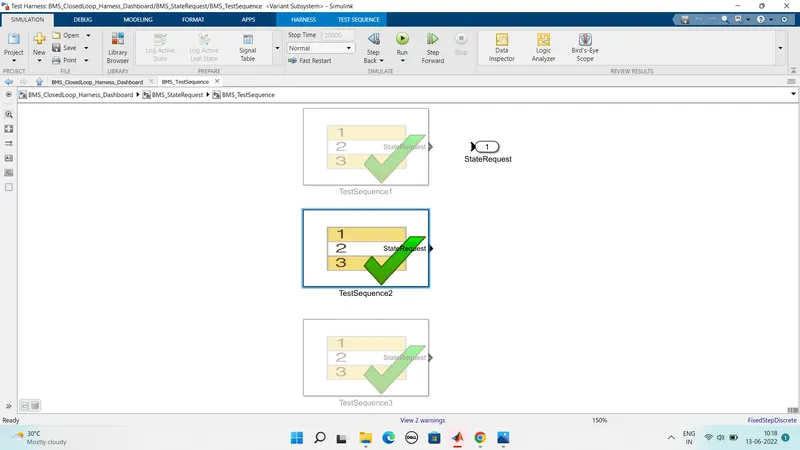
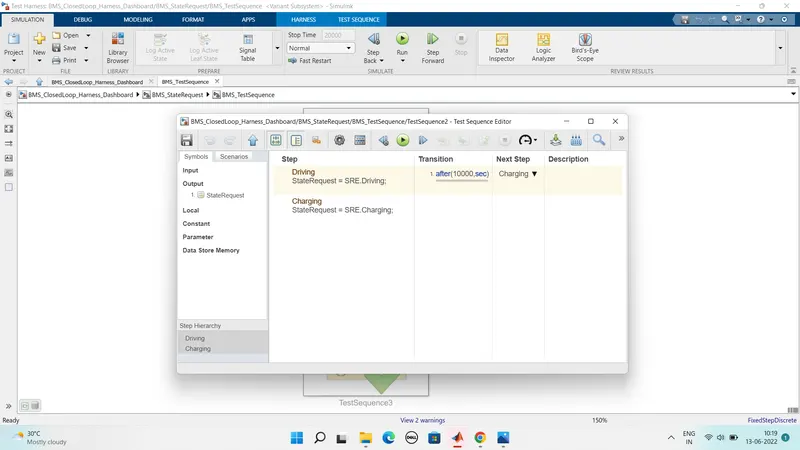
Here all the details of the test will be performed in the simulation
So the driving stage is from 0 to 5000sec and then charging
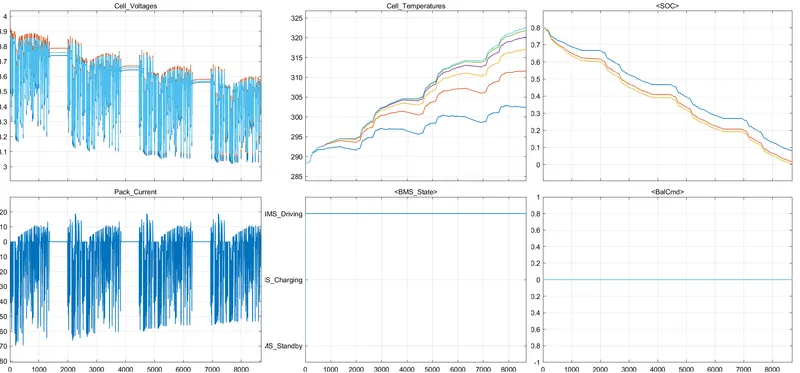
- Here in the driving cycle mode i.e 0-10000sec the cell voltage varies from 3.9 to 3.05v which is the cutoff voltage of a cell and the entire cell is drained upto 8692sec
- so the cell temperatire changes from 288k to 322k
- The SOC is decreased from 805 to 0%
- Same in the charging mode i.e 10000 to 20000sec the cell got drained eariler befre it reaching this mode
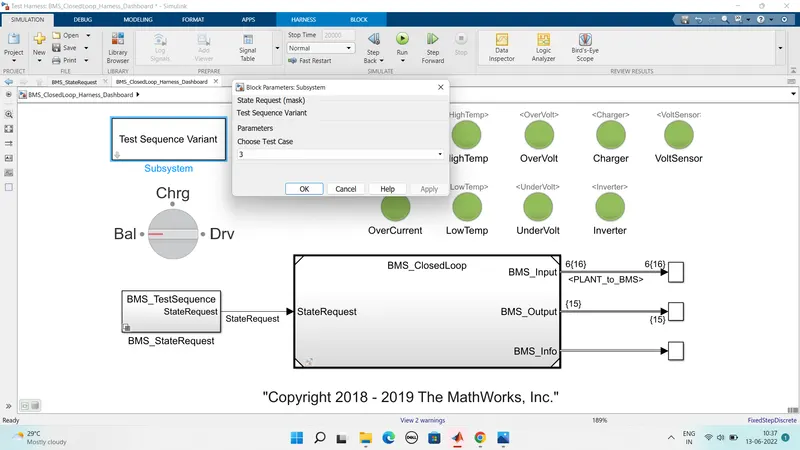
Here we changed test sequence number from the subsytem to 3
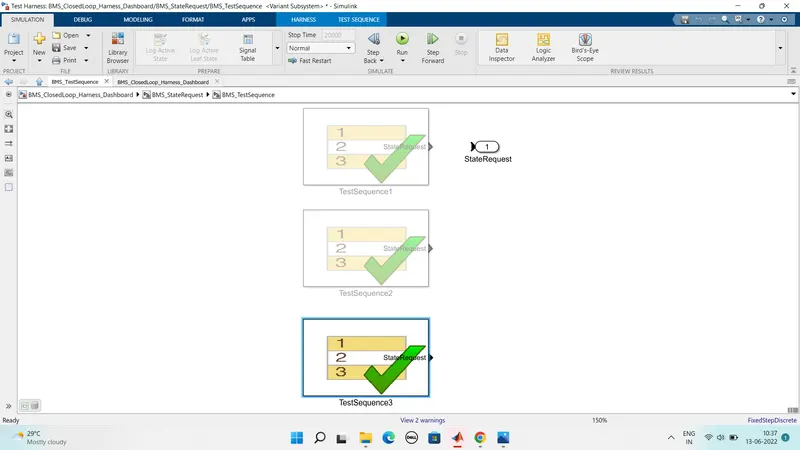
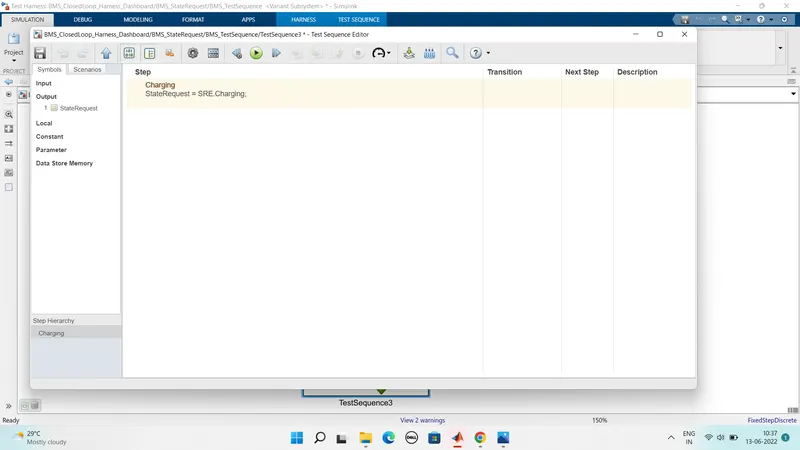
In this the test sequence had only one phase that is the charging phase fro complte 20000sec
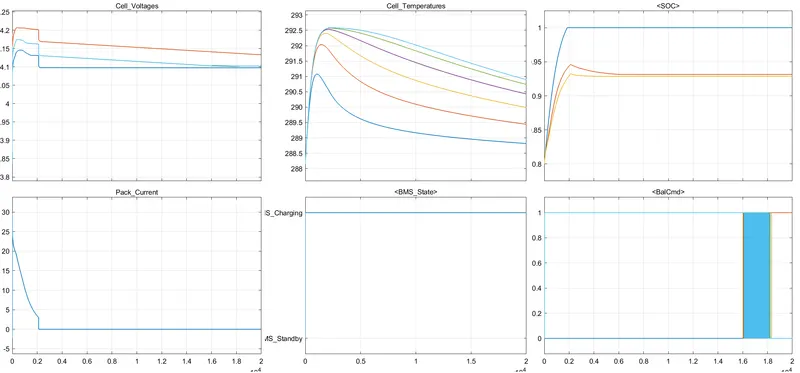
- here we can see that the SOC had reached 100% when in the charing state and reamin same state for rest of the other time
- So the temperature of the battery pack aslo reduced in the standing by mode
Question :2
Aim : What is coulomb counting? Refer to the above model and explain how BMS implements coulomb counting for SOC estimation ?
Answer:
What is coulomb counting:
- So To improve the Coulomb counting method a new technique called the modified Coulomb counting method is proposed.
- This modified Coulomb counting method uses the corrected current to improve the accuracy of estimation.
- The corrected current is the function of discharging current.
- There is a quadratic relationship between the corrected current and discharging current of the battery.
- So By the practice of experimental data the corrected current is calculated by the following form
- Ic(t) = k2I(t)2 + k1I(t)+ ko
- Here k1 k2 ko are constant values
Here the experimental results shows the that the accuracy of the modified coulomb counting method including temperature battery history and discharge current and life cycle
Now we can see that the project file donwloaded from the BMS system in the file shown below
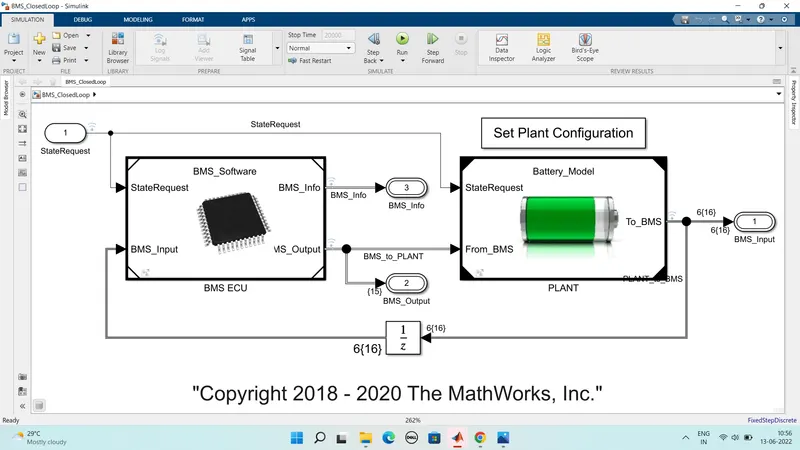
This block protects the reports the measurement from a battery pack
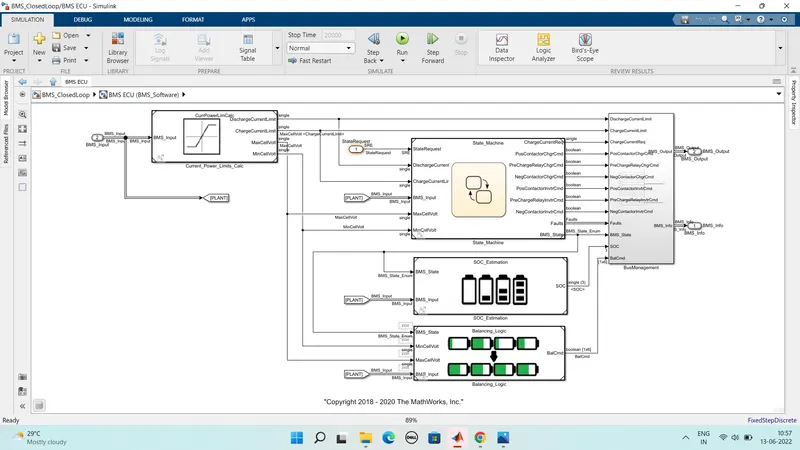
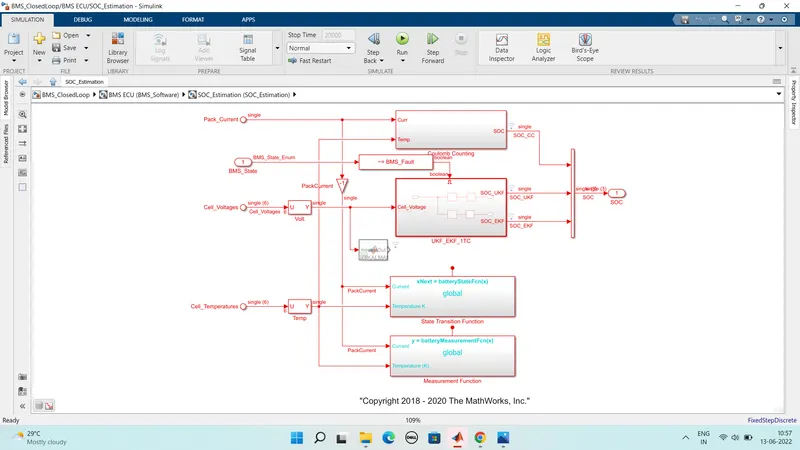
- So the advantgae of this culomb counting method is it is simple and low computational cost
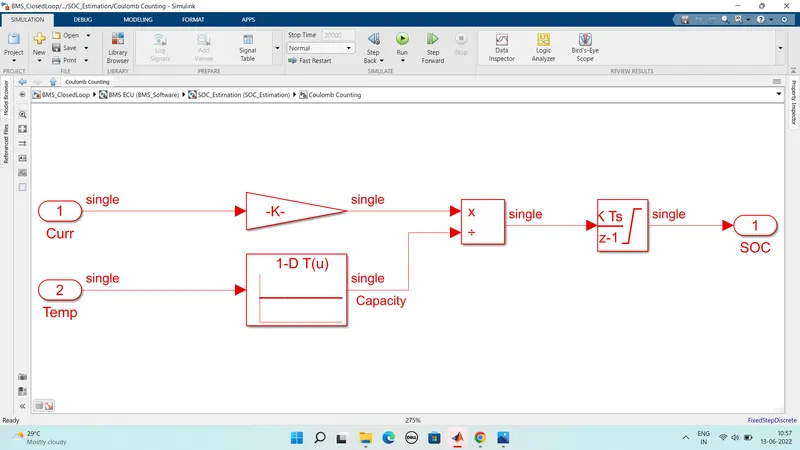
- The temperature and current from the battery are given as the inputs
- So the current siginal is then given to a gain block and temperature is given to capcity since it changes to temperature
- The inputs are given for integration where the current will be integrated with respect to the time
- SO by this output is given to another block where it is divided by the capacity
- SO hence the SOC is estimated like this
we Simulated the 3 test cases from harness dashboard and written a detailed report on the results
and aslo stated What is coulomb counting Referd to the above model and explained how BMS implements coulomb counting for SOC estimation ?