Week 7 State of charge estimation
1.Simulate the 3 test cases from harness dashboard and write a detailed report on the results
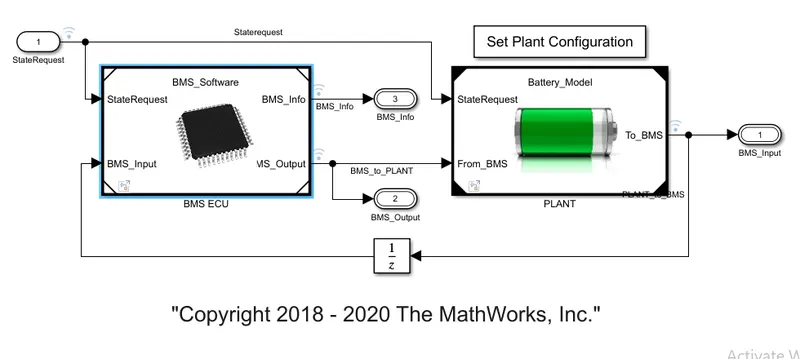
2.What is coulomb counting? Refer to the above model and explain how BMS implements coulomb counting for SOC estimation ?
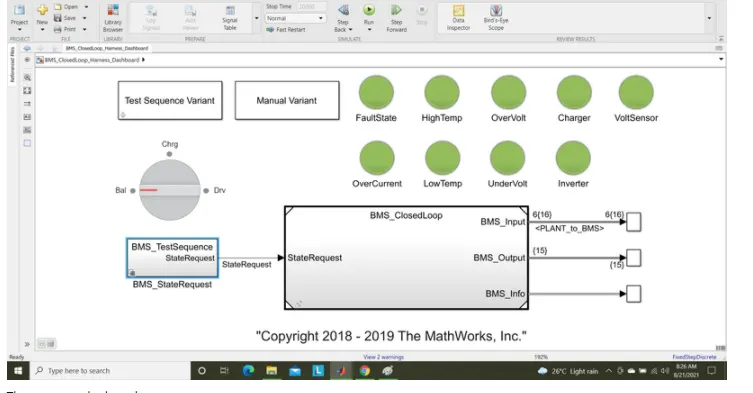
ans-we opem BMS harness dash board closed loop file from test.
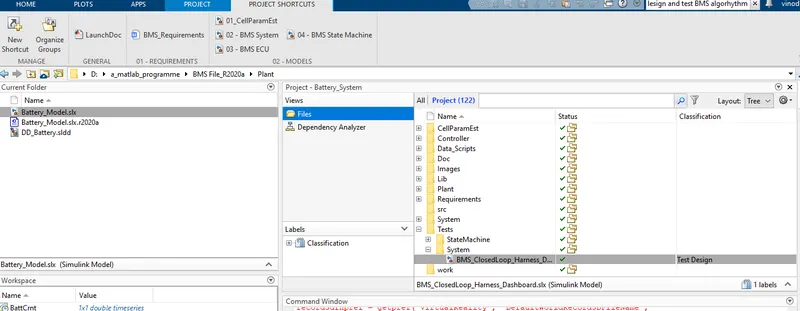
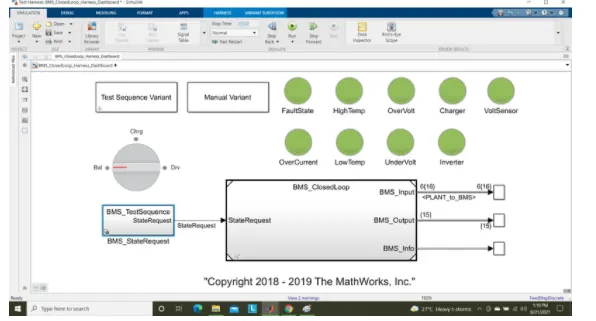
model file open as
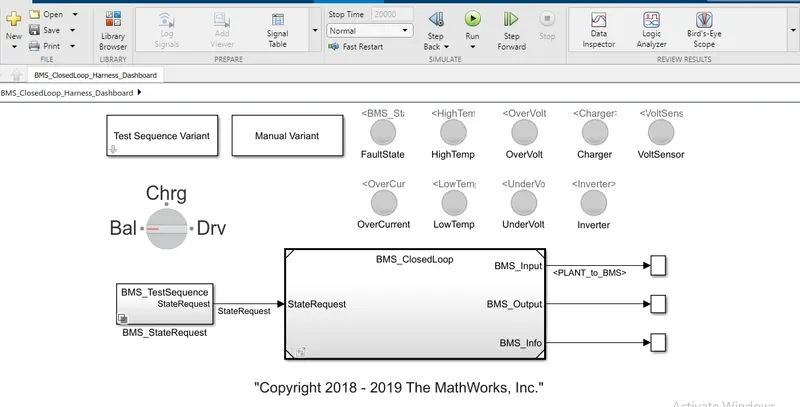
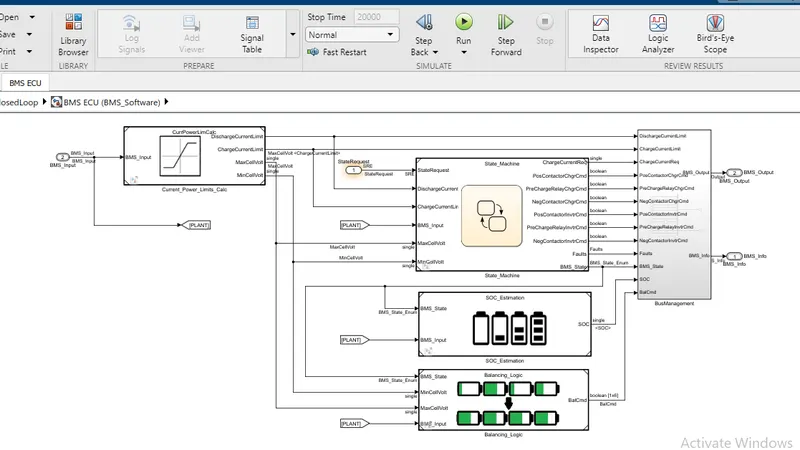
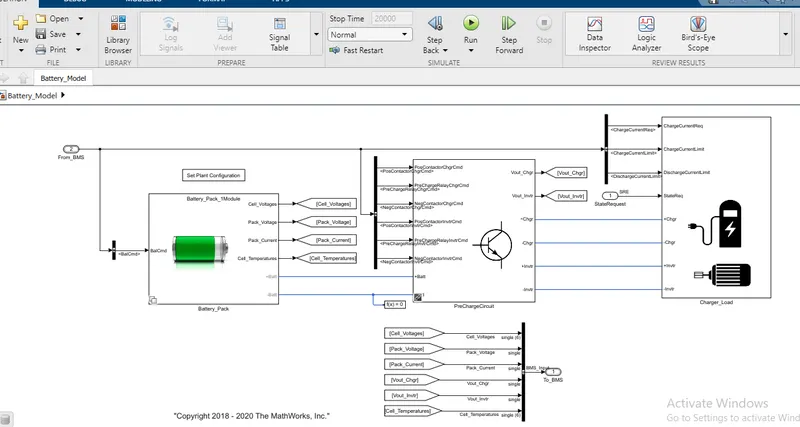
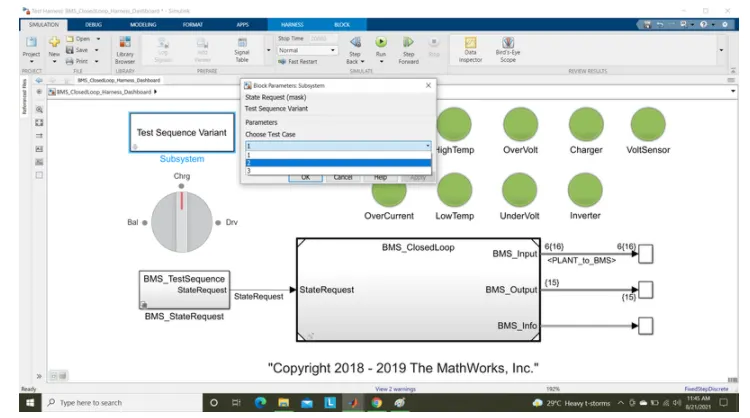
a. to run test case 1 select test case 1
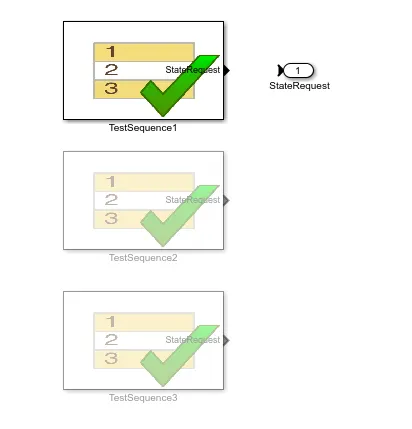
*drving for first 3000 sec.
*balancing for next 1000 sec
*balancing and charging for next 5000 secs.
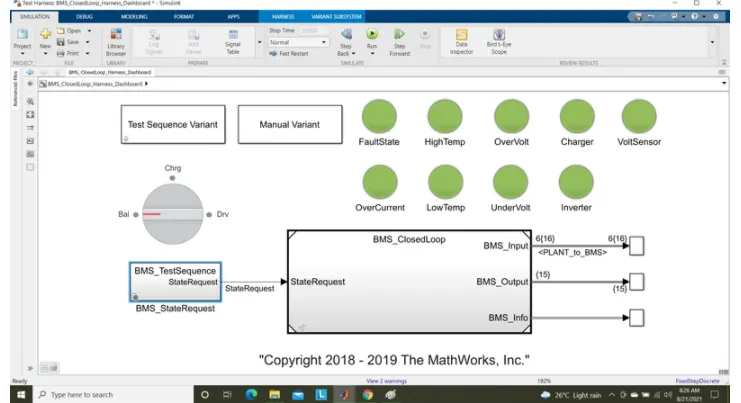
green lamps indicates there are no faults.
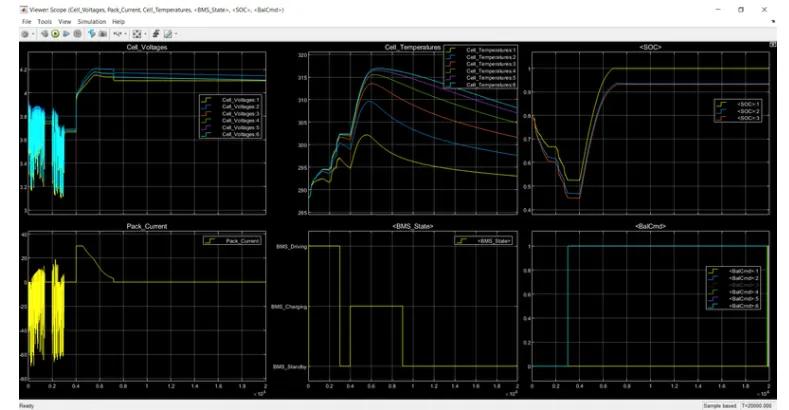
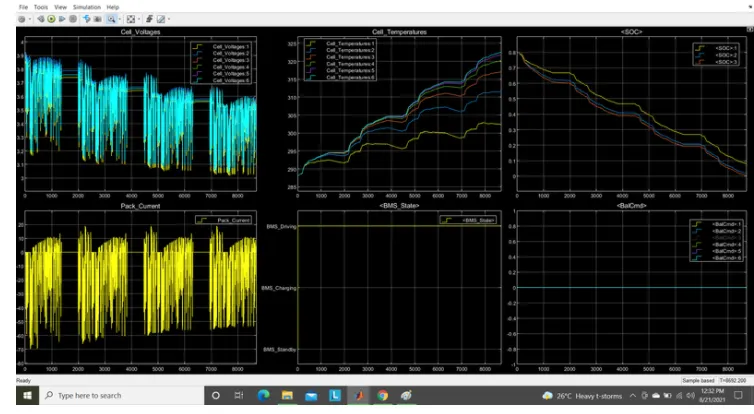
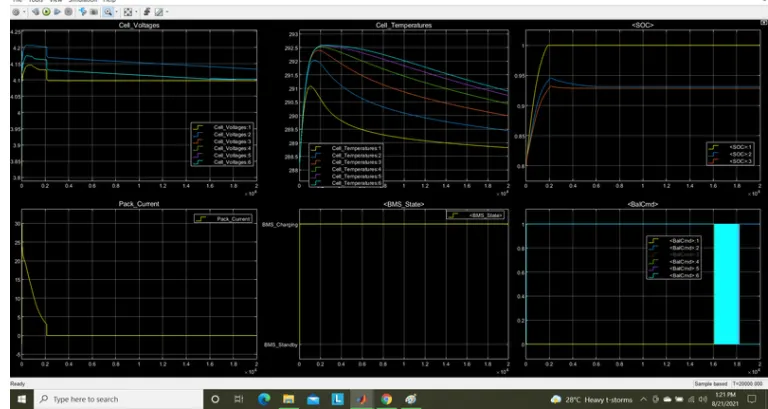
for first 3000secs all 6 cell are in drive mode where discharging occurs majorly and in stanby mode for lesser duration.
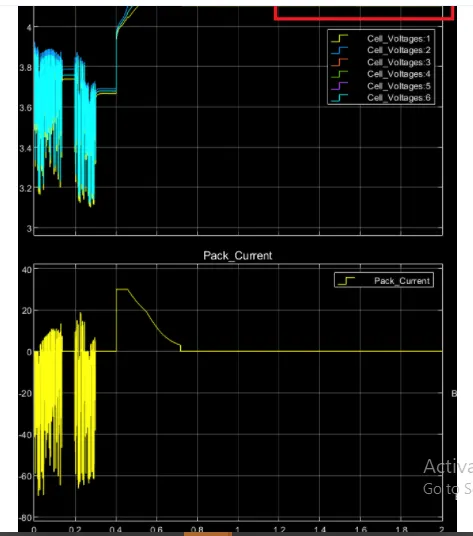
* voltage variation from 3.1 V TO 3.9 V IN THIS RANGE.
* from 3000 secs to 4000 secs cell balancing ossurs module is in stand by mode volatge is 3.7 v.
*after 4000secs charging occurs voltage raised from 3.7V to 4Vat 4 to 4.2 V as constant voltage current reduces from 30 A to 2.6 A
* at the end of charging and cell balancing occurs upto 9000 secs.
* after 9000 secs post charge cell balancing starts all cell voltages are balancing to a voltage wrt to 1 to 4.1 v
ca\ell temperature\initially tempr range increase from 288k to 302 k.
temp cell 1 is lesser and cell 6 has higher.
after 3000 msec to 400secs cell temp reduced slightly .
after 4000 secs tempr starts increases exponentially upto constan current region and start reduces
cell 1 max tempr raised upto 302 k and cell tempr raised upto 317 k
after 9000 sec tempr still reduces and remain stable at reaching.
BMS state
for 3000 secs the battery module in drive mode(discharge).
from 3000 secs to 4000 secs the battery module in balancing standby mode as shown from result plot.
after 4000 secs upto 9000secs the module in charging and balancing mode.
after 9000 secs only post charge balancing mode operates upto end of simulation.
SOC
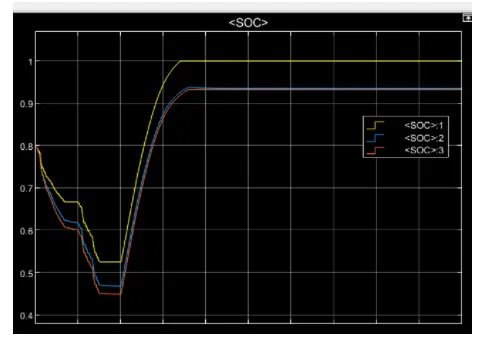
initially state of charge is 80%.
here the yellow reprents SOC by colomb counting technique.
blue plot represent SOC estimation using unscented kalman filter technique.
red plot repesent SOC estimation using extended kalman filter technique.among three UKF and EKFtechnique estimate accurately than coloumb counting technique.
initially for 3000 secs sets SOC decreses to nearly 45% during drive mode.
after 3000 sec upto 4000 secs the SOC is constant at 45% as cell balancing occurs.from 4000 to 9000secs module in charging mode.
after 9000secs the SOC the SOC BECOMES constant app.94% as seen from above plot.
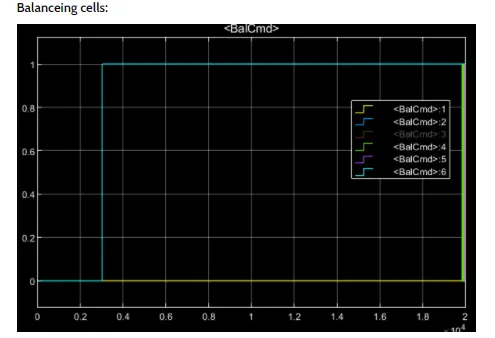
initially upto 3000secs balancing is not done
after 3000 secs cell balancing starts with on cell 6 and cell 2.
afetr this post charging occurs.
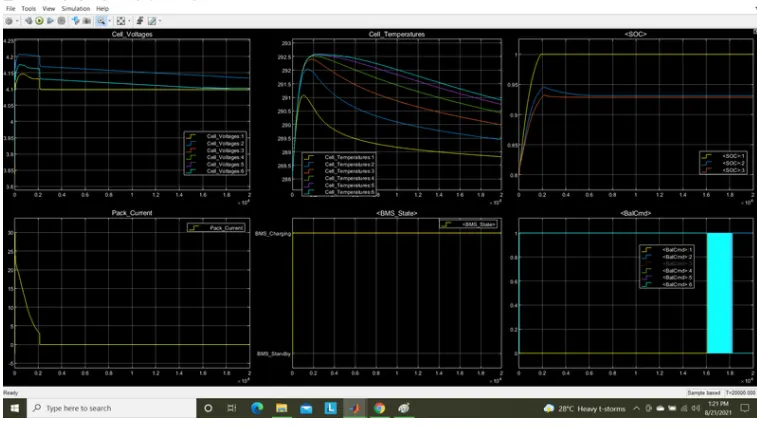
test case 2
test case 3-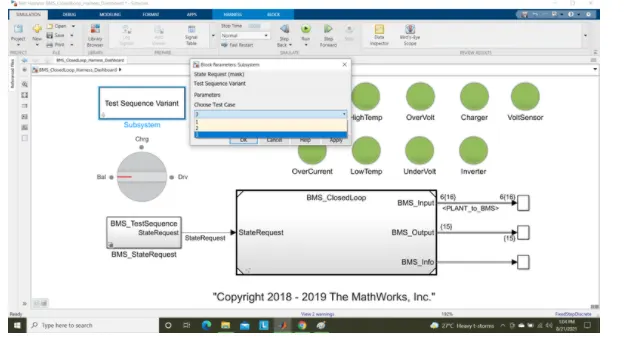
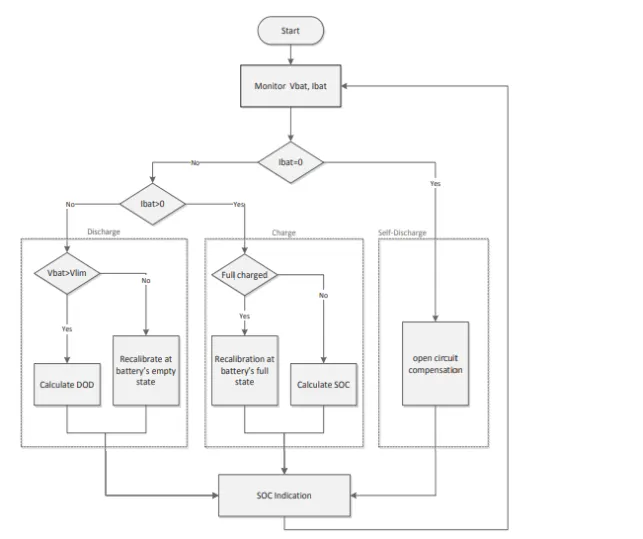
B.colulomb counting-SOC is defined as rate of avalable capacity to its maximum capacity when a battery is fully charged and describes the remaining percentage of the battery cpacity
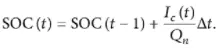
this method measures the discharging current of the battery and integrates the discharging current over time in order to estimate soc.
this can be estimated from discharging current .previosly estimated SOC value(soc(t-1). the relation can be given as.

MODIFIED COULOMB counting-idischarge current is corrected with a function and corrected current is found for accurate SOC estimation.
the function is

SOC relationship is
flow charge for coulomb counting