Week 7 State of charge estimation
Simulation of the 3 test cases from the harness dashboard.
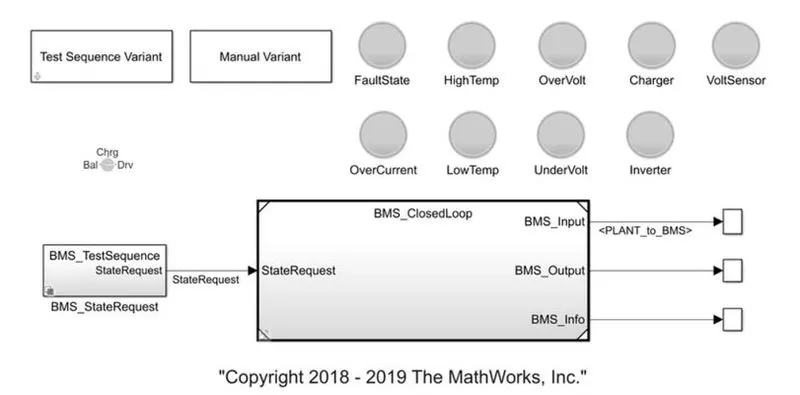
Below is the representation for the battery model harness dashboard downloaded from matlab.
Test 1:
Step1: We need to set the test case to 1 by double clicking on the Test Sequence Varient Block.
Step2: Check the scheme the BMS going to execute by double clicking on the BMS Sequence block. The sequence should be as shown below.
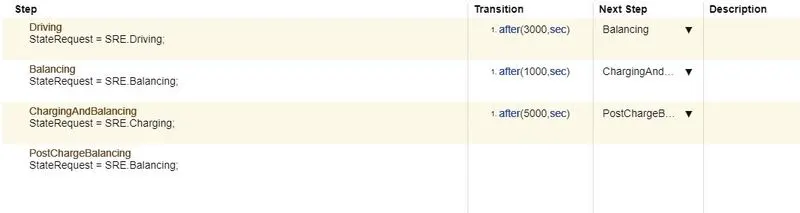
The simulation is set according to the following 3 schemes.
a. Driving for 3000 secs.
b. Standby & Balancing for 1000 secs.
c. Charging & Balancing for 5000 Secs.
Step3. The results can be observed in the curve generated by the scope.
Results:
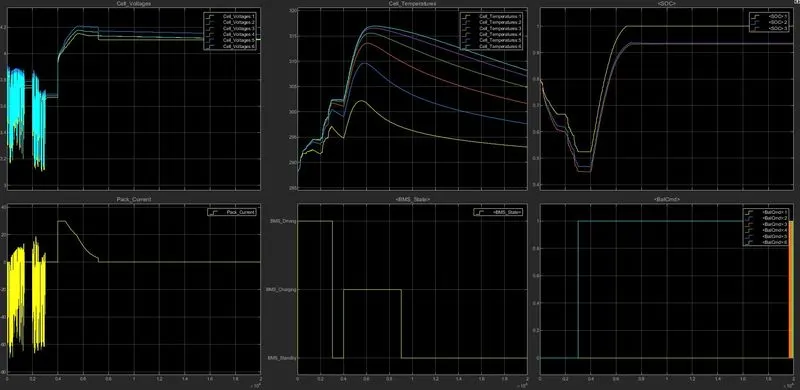
The following conclusions can be derived from the above plots.
a. The initial SOC is 80% (SOC plot). The driving is initiated and maintained for 3000 secs (BMS_State plot). The temperature starts rising(Cell_Temperatures plot). The cell voltage(Cell_Voltages plot) and pack current(Pack_current plot) reflects the power drawn out of the battery and power supplied to the battery during the driving, notice the current changing from positive to negative validating the same where positive current is charging and negative current is discharging.
b. The driving is then followed by standby for a duration of 1000 secs (BMS_State plot). The temperature drops slightly, The variation in current and voltage is constant, The SOC is constant. The cell balancing(BalCmd plot) kicks in.
c. After the standby of 1000 secs, The Battery starts to charge. The voltage peaks to 4.2V, The current peaks at around 30A on the positive side. The temperature starts rising and peaks during this scheme and starts dropping as the SOC starts increasing and settles for a constant rate. The Cell Balancing continues to operate.
Test 2:
The simulation is set according to the following scheme.
a. Driving for 10000 secs.
Results:
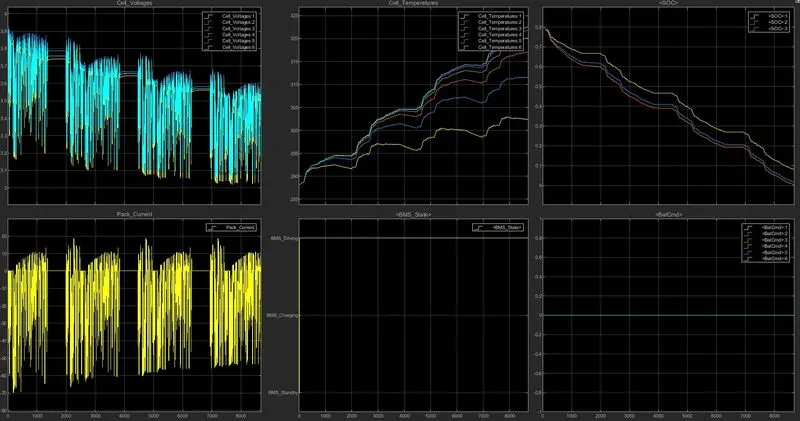
The following conclusions can be derived from the above plots.
a. The variation in cell voltages and pack current is due to the driving cycle. Note the charging and discharging current. The Cell voltage falls to 3.6V from 4.0V at SOC of 80%. There is a rise in temperature. There is no cell balancing as there is no charging.
Test 3:
The simulation is set according to the following scheme.
a. Charging for 20000 secs.
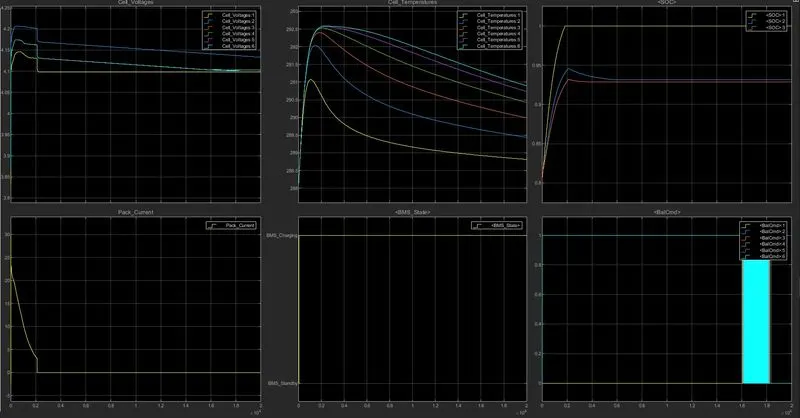
Results:
The following conclusions can be derived from the above plots.
a. There is no huge variation in cell voltages and pack current because there is no driving cycle. The SOC is at 80% initially and reaches 100% in 2000 secs. Note the charging current increases to 30A on the positive side and falls after 2000 secs. The Cell voltage rises from 4.0v to 4.2v and falls to the ocv levels after 2000 secs. There is a rise in temperature for the same duration and falls once the SOC is at 100%. The cell Balancing starts at 16000 secs and termimnates at 18400 secs.
Coulomb counting:
Coulomb counting is a way used to track the SOC of a battery pack. The active flowing current (Amps) is integrated over time to derive the total sum of energy entering (charging) and leaving (discharging) the battery pack. The result is a capacity usually measured in Amp-Hrs.
The equation for the SOC is as follows:
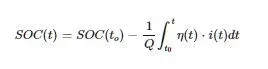
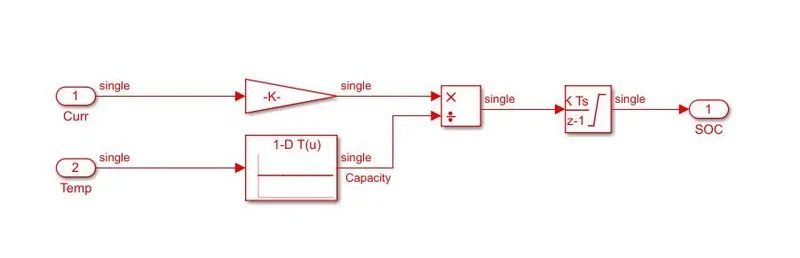
The model below reflects the above equation. The amount of current charging/discharging the battery is integrated over time and the effect of temperature on capacity is added by using the 1-D lookup table.
The implementation of the above model can be observed by the following steps:
Double click on the BMS_closedloop Block.
Double click on the BMS ECU block.
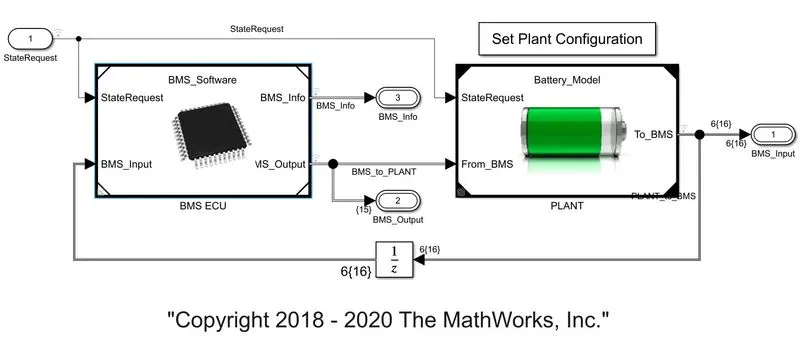
The BMS ECU reflects the software and control part of the model. It enables the cell balancing, soc estimation and closed loop control according to different states.
Double click on the SOC_Estimation block.
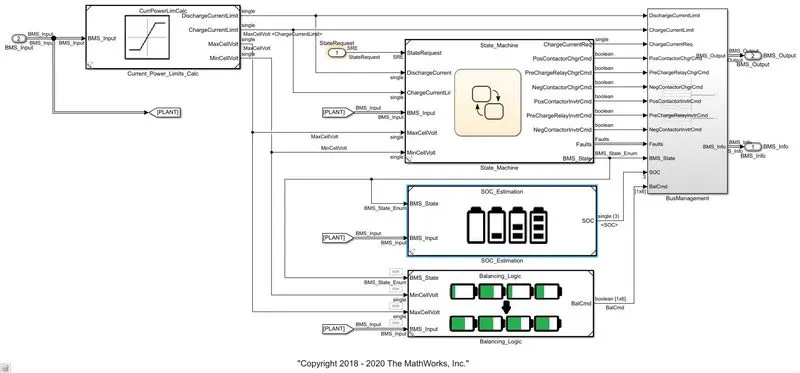
The Plant reflects the electrical hardware part of the model including the battery pack, the precharge circuit and the charger.
After Double clicking on the coulomb counting block, you will get the coulomb counting model.
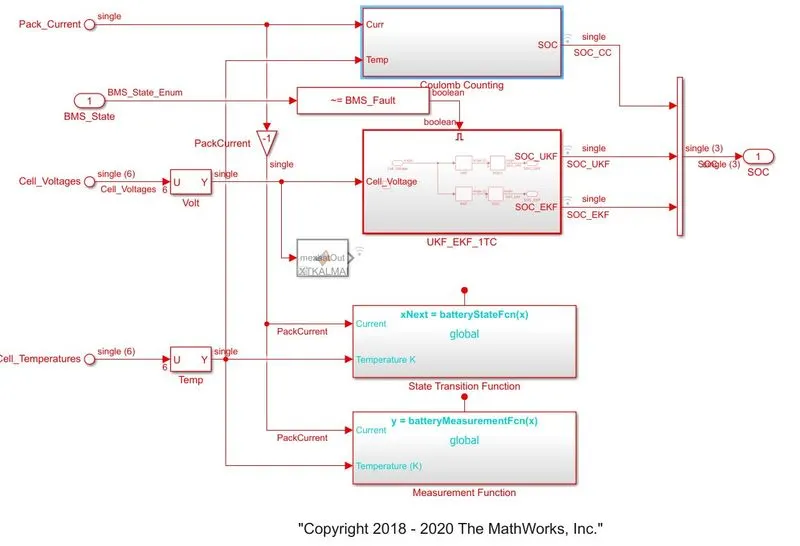
- The above system estimates SOC by coulomb counting blocks as shown above
- The temperature and current inputs received from the sensors from the battery is also accounted for.
- The capacity is set to vary with the temperature.
- The current signal is supplied to the gain block and the combined signal is integrated with respect to time.
- The total signal obtained is divided by the capacity to obtain the SOC.