Week 7 State of charge estimation
OBJECTIVE 1 : Simulate the 3 test cases from harness dashboard and write a detailed report on the results
SOLUTION : We have to simulate the 3 test cases from harness dashboard. For that first we have to download the folder from the given link. After downloading the link we have to add folder to the path of matlab file and then open the BMS closed looped harness dashboard as shown below.
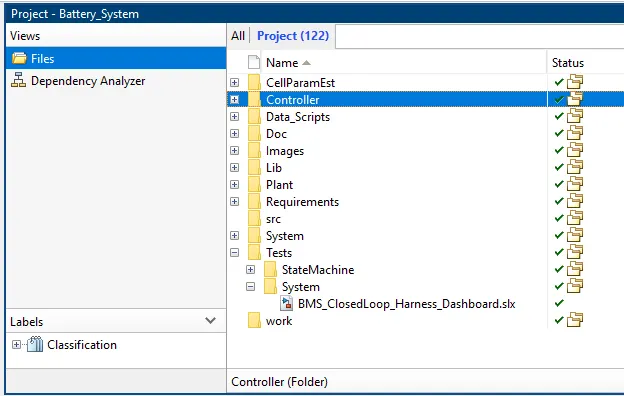
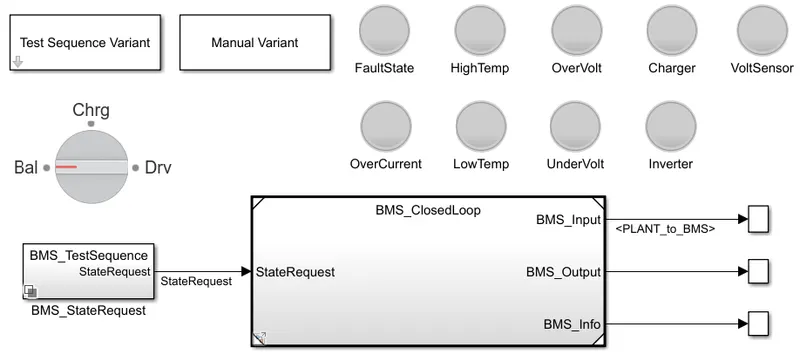
The battery model harness dashboard is given below :-
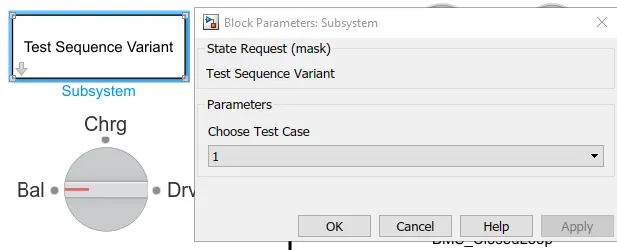
1. Test Case 1 : Click on the test sequence variant block and select the parameter 1
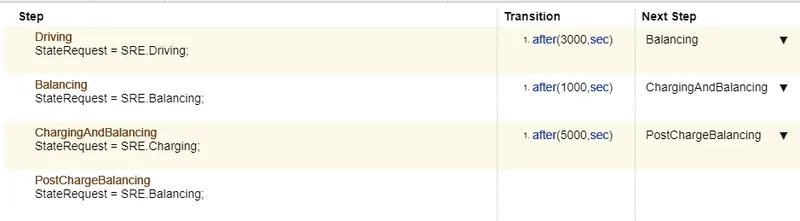
- Now by clicking on the BMS sequence block we'll get the test sequence 1, by selecting it we will get the chart shown below.
- Now simulating the model for 20000 secs we get
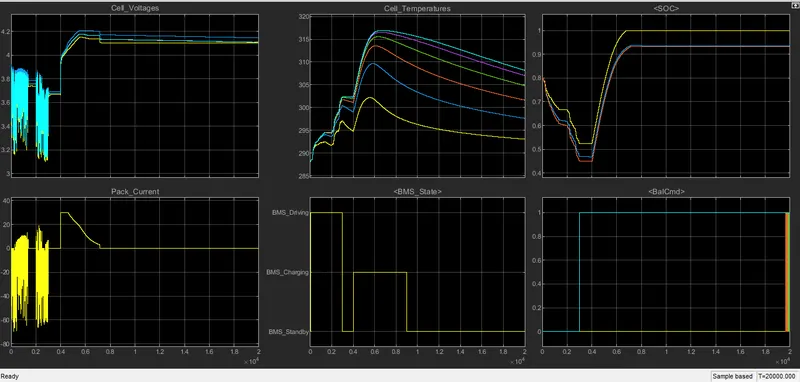
- As simulation was started model was in driving condition.
- After 3000 secs it went to the standby mode then after 1000secs it went to the charging mode.
- Cell Voltages : There are various different cell voltages occuring in the curve.
- Pack Current : Pack current is the combination of drive cycle, here negative current represent the discharging rate & regenerative braking is resulting in charging of battery pack during driving condition.
- Cell temperature & BMS state : While BMS is driving cell temperature is increasing. In this cells in the center are going to have higher temperature.
- SOC : Initial state of charge was around 75-80% . During the standby period SOC it has been reduced to lowest point of SOC curve was discharged
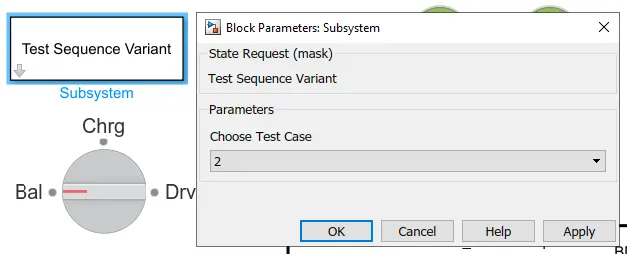
2. Test Case 2 : Click on the test sequence variant block and select the parameter 2
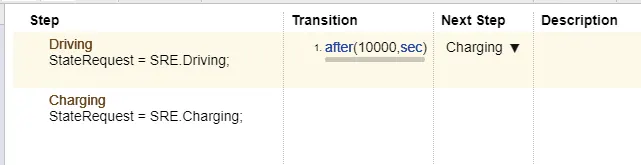
- Now by clicking on the BMS sequence block we'll get the test sequence 2, by selecting it we will get the chart shown below
- Now simulating the model for 20000 secs we get
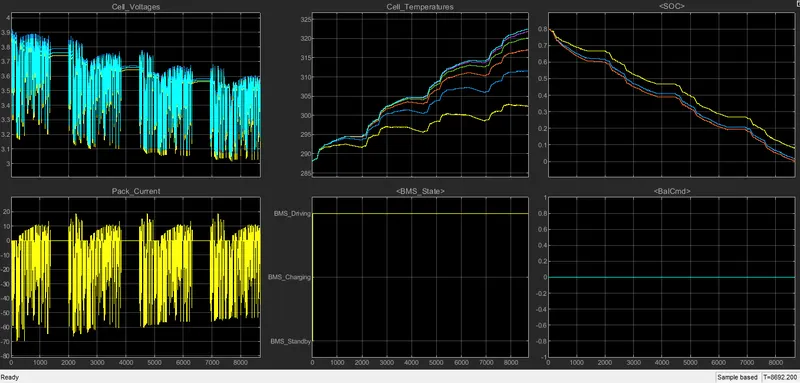
- In this SOC is continuously discharging as BMS state is in driving mode and charging mode was to be initiated after 10000 secs.
3. Test Case 3 : Click on the test sequence variant block and select the parameter 3
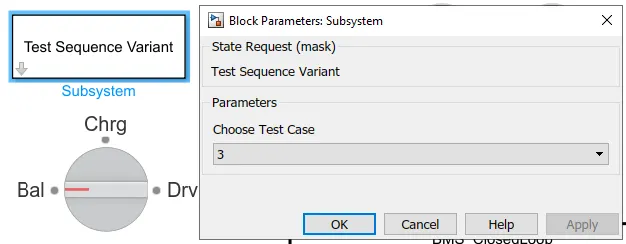
- Now by clicking on the BMS sequence block we'll get the test sequence 3, by selecting it we will get the chart shown below

- Now simulating the model for 20000 secs we get
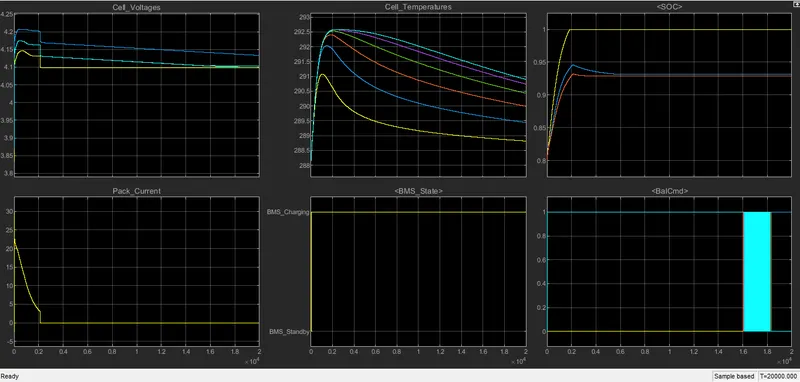
- SOC reached the 100% with cell temperature also decreasing.
OBJECTIVE 2 : What is coulomb counting? Refer to the above model and explain how BMS implements coulomb counting for SOC estimation ?
SOLUTION :
Coulomb Counting :- The Coulomb counting method measures the discharging current of a battery and integrates the discharging current over time in order to estimate SOC. Coulomb method is used to estimate the previously estimated SOC values, SOC is calculated by the equation :
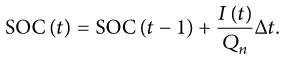
But there there are several factors that affect the accuracy of Coulomb counting method including temperature, battery history, discharge current and cycle life.
Now looking into a project file of BMS Closed loop system
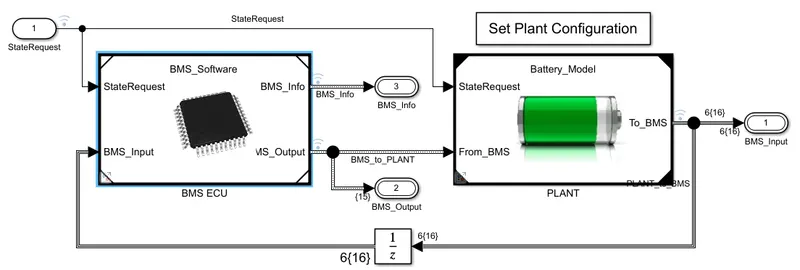
- Now going into BMS ECU we get :-
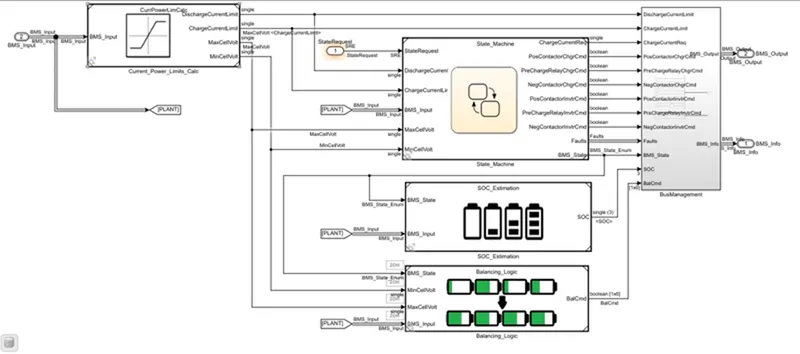
- Now looking into the SOC Estimation block for coulomb counting we get.
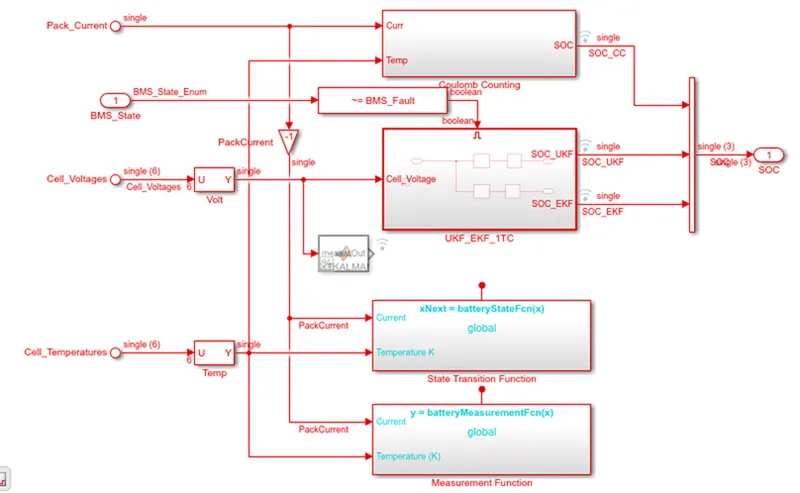
- Selecting UKF_EKF_1TC
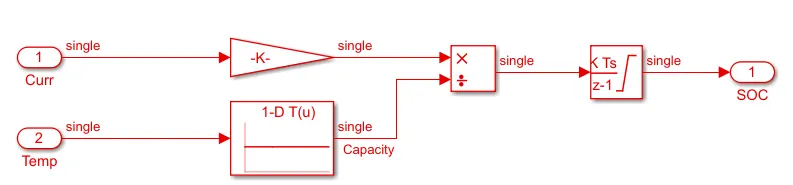
- This system does the estimation by coulomb counting equation mentioned above.
- Advatage of coulomb counting method is its simplicity and low computaional cost.
- Temperature and current from the battery is given as inputs.
- Current signal is given to a gain block and temperature is given to capacity since it varies according to temperature.
- Theseinputs are given for integration where current will be integrated with respect to time.
- This output is given to another block where it is dic=vided by capacity.
- Hence SOC is estimated.