Week 7: Shock tube simulation project
Aim: To setup a Shock Tube and perform transient simulation. Also to study the temperature pressure and various other charcteristics of the simulation.
What is a Shock Tube?
The shock tube is an instrument used to replicate and direct blast waves at a sensor or a model in order to simulate actual explosions and their effects, usually on a smaller scale. Shock tubes (and related impulse facilities such as shock tunnels, expansion tubes, and expansion tunnels) can also be used to study aerodynamic flow under a wide range of temperatures and pressures that are difficult to obtain in other types of testing facilities. Shock tubes are also used to investigate compressible flow phenomena and gas phase combustion reactions.
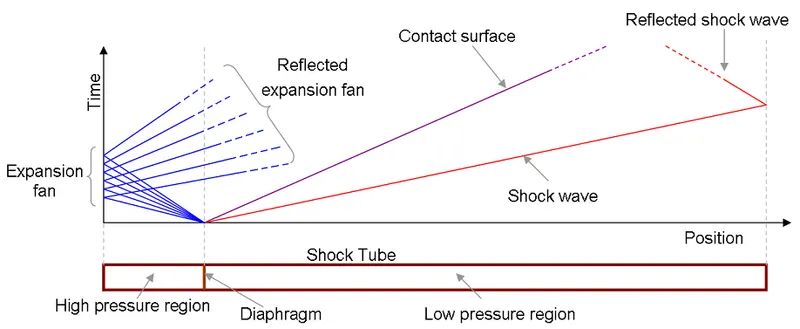
Above is a representation of a schematic diagram of a shock tube.
Geometry:
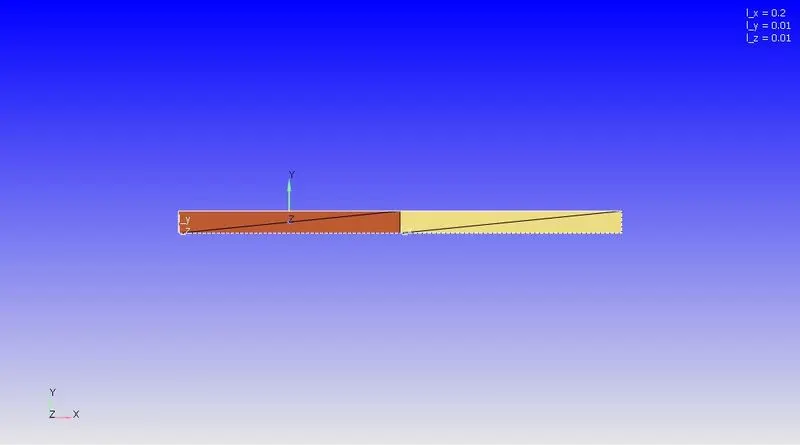
Above is a shock tube with
Case Setup:
Procedure to setup the case:
- Select time based in the application.
- Here, we opt for gas simulation and select air as a predefiend mixture.
- Also we setup the species module for both the gas as (N2and O2).
- In the simulation parameters, we select the transient solver, time based solver and make sure that the mode of simulation is full hydrodynamic. (Usually, simulations are run in non-hydrodynamic mode to ensure that the grid formed on the case is as expected. Due to the simplicity in the geometry, we directly use the full hydrodynamic mode.)
- We setup the boundaries as required also we assign the region to each of the boundary.
- In this case, we assign 2 regions. This is because we are dealing with two pressures high pressure boundary and low pressure boundary.
- Here we employ the turbulence modeling where we use the RANS method and we use the RNG k ε.
- We make use of the events function to ensure that the memberane is split at the required moment.
- Prior to running the file it was made sure that the surfaces in the middle of the geometry were deleted.
- The most important aspect in this model is to make sure that the model is dimentioned in meters. Also the base grid dimensions are to be mentioned in meters.
- The post processing is done on the results once the simulation is complete.
Post Processed Results:
MESH:
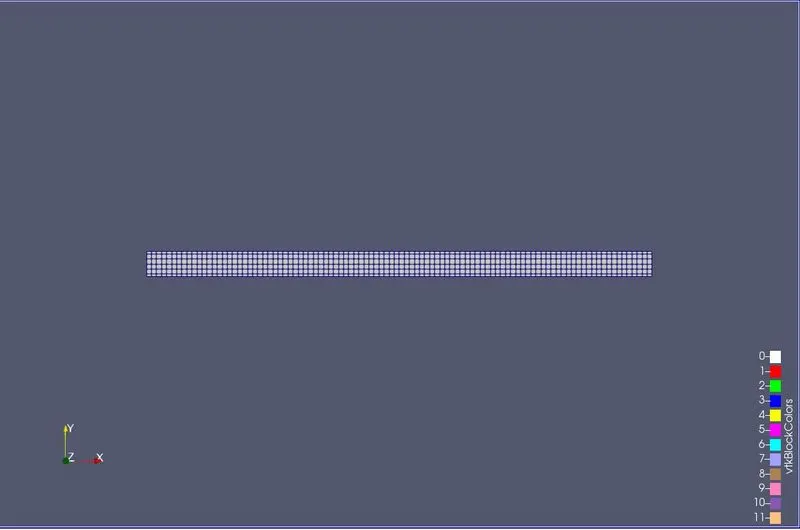
Initial Condition:
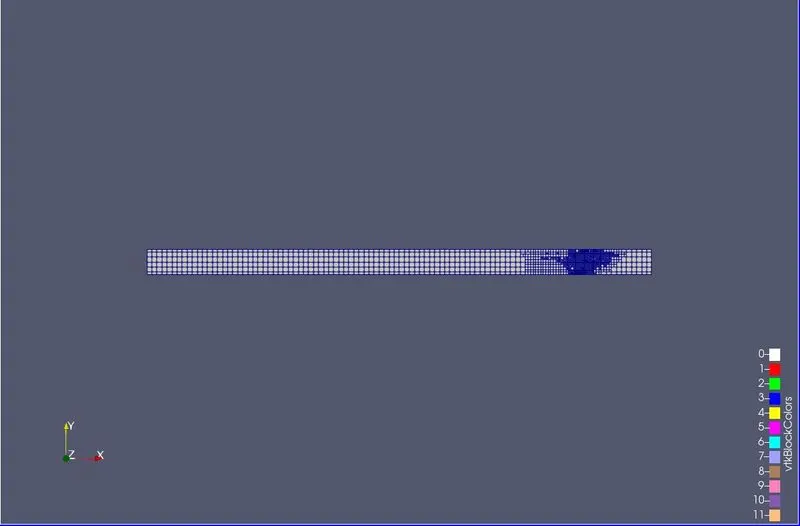
Final Condition:
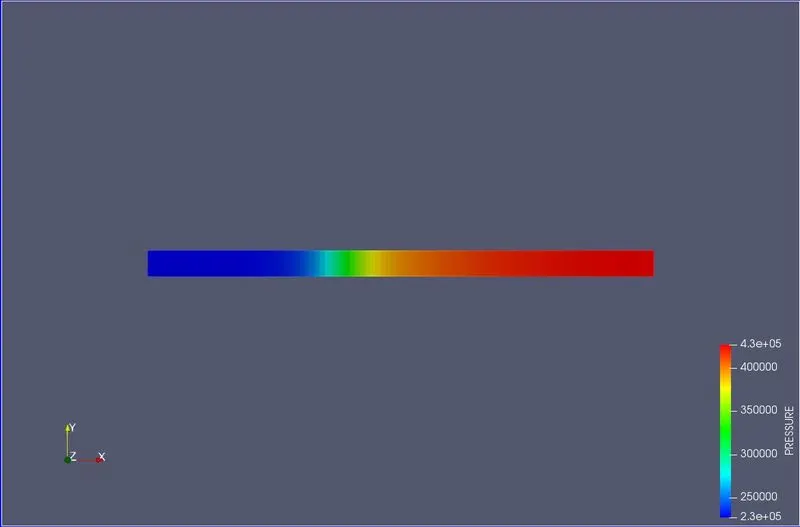
Pressure Contour:
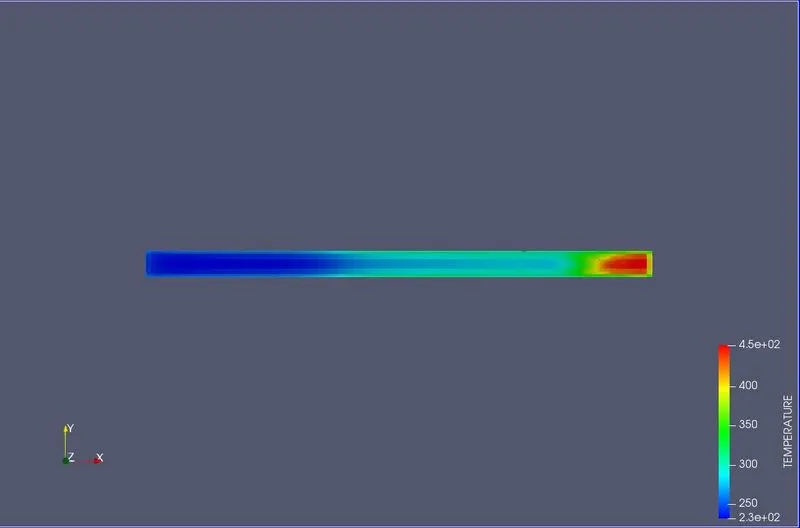
Temperature Contour:
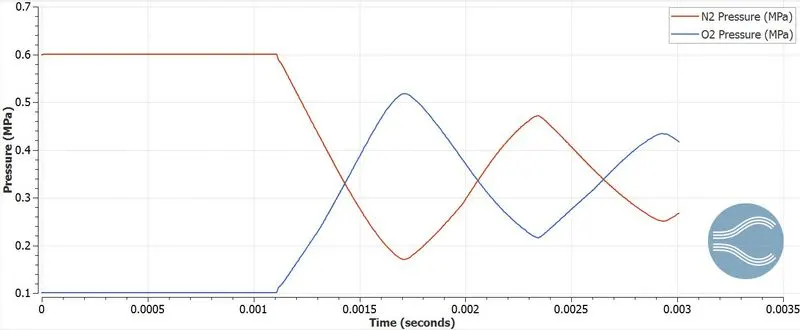
Pressure Plot:
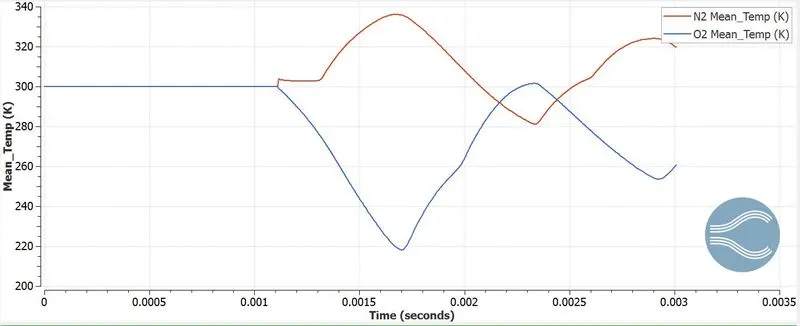
Temperature Plot:
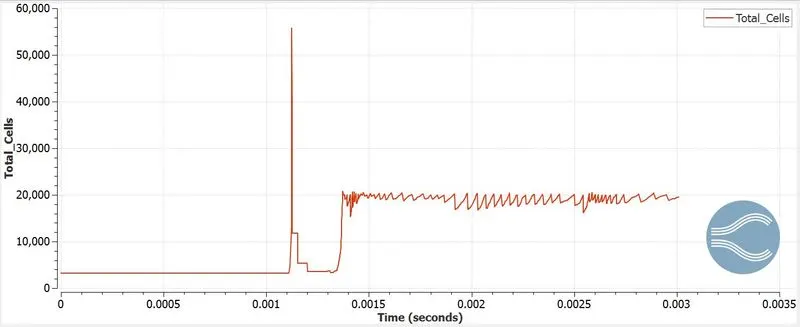
Total Number of Cells:
Inferences:
- The pressure of the species (`N_2` and `O_2`) were at high and low pressures respectively. Once the diaphragm ruptures we can observe a significant variations in pressures on either sides.
- Due to the different pressures on either sides, once the diaphragm ruptures, a shock is produced which results in increase in temperature in the reacting gases prior to reaching steady state and decreases the overall pressure. This shock phenomenon can be studied due to the use of AMR.
- The density of `N_2` is higher than `O_2` thus when the diaphragm ruptures, the gases tend to converge only after the shock subsides.
- The most important trend to be observed is that the temperature increases as the shock wave propogates and the pressure decreases. This can be observed from the respetive plots.
- Also, the total cell count remains consant till the diaphragm ruptures, post which we can observe a significant variation in the number of cells. This is because the AMR function was used to study and capture the shock phenomenon.