Week 7: Shock tube simulation project
Introduction:
Shock Tubes:
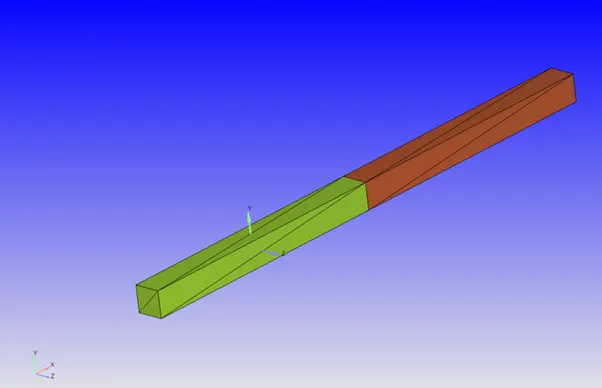
From the last few decades, shock tubes have been used to comprehend the chemical kinetics in a well-controlled environment. Shock tubes consist of two regions with different pressure i.e higher pressure region(driving gas ) and lower pressure region(driven gas ) separated by a diaphragm. In this study, an attempt is made to show the mixing of species with no combustion and visualize to pressure difference which causes the diaphragm to burst and which leads to generating shock waves. In the below figure green region is the high pressure and brown region as low pressure.
Case Setup:
The base size of the mess is kept to be 2mm. In here AMR is used for High-pressure gas i.e N2 with sgs of 0.001 and embedding level of 3.
|
High-Pressure Region |
Low-Pressure Region |
|
|
Mixture |
N2 |
O2 |
|
Pressure |
6 bar |
1 bar |
|
Temperature |
300 |
300 |
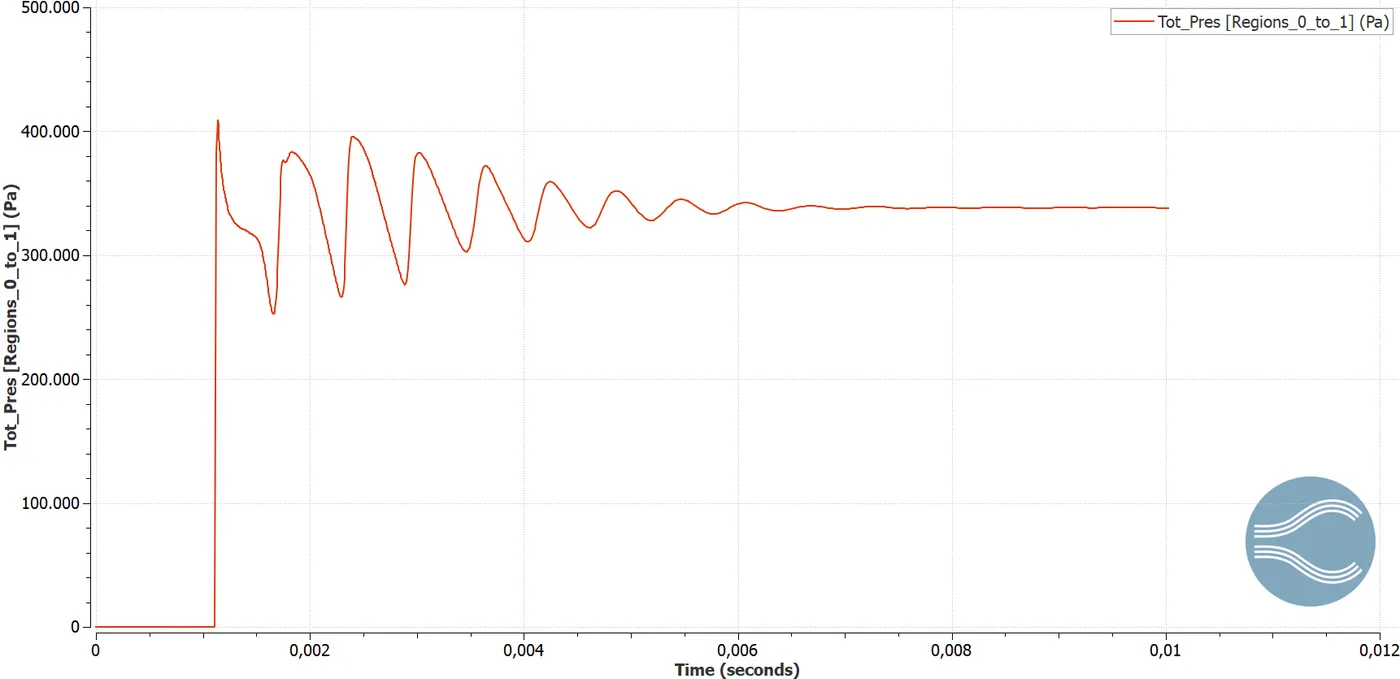
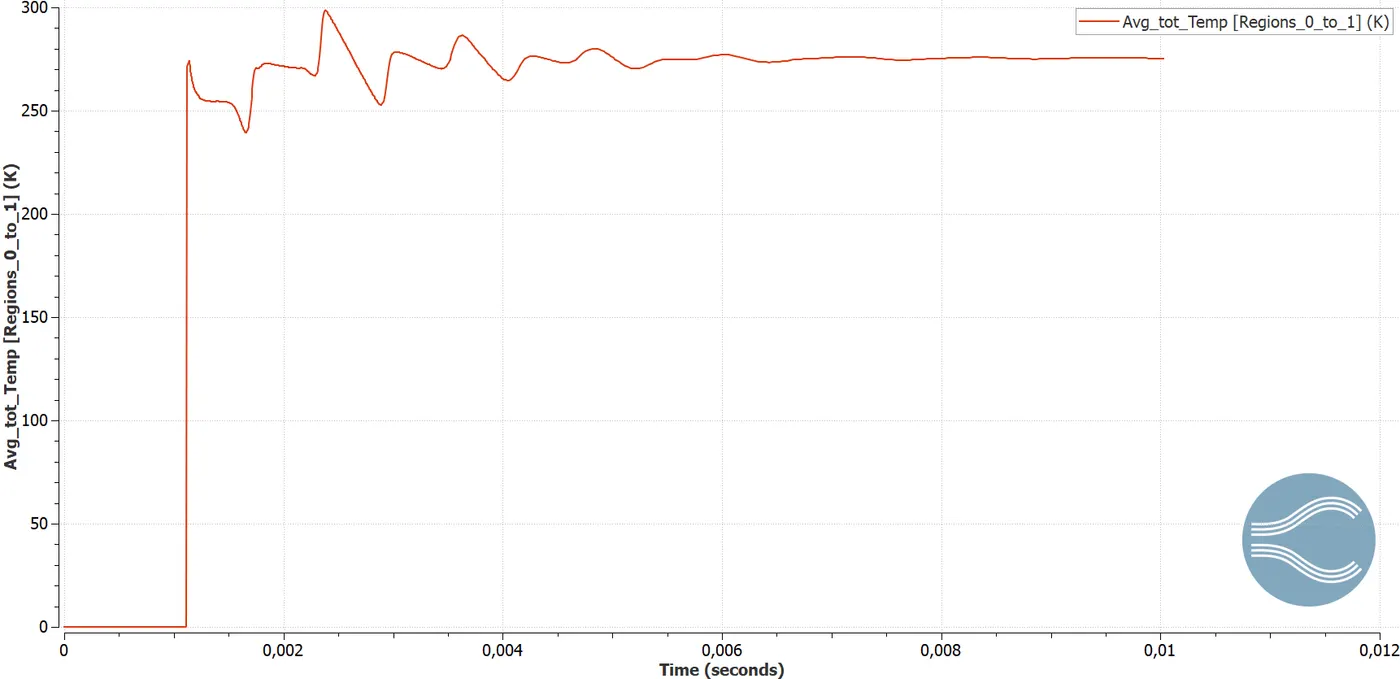
In here a new feature called 'Events' is implemented because of the involvement of two different regions and which are to be opened and close at a certain time. The regions are opened after 0.001 sec which is quite clearly visible in the pressure and temperature plots.
Results:
Cell Count
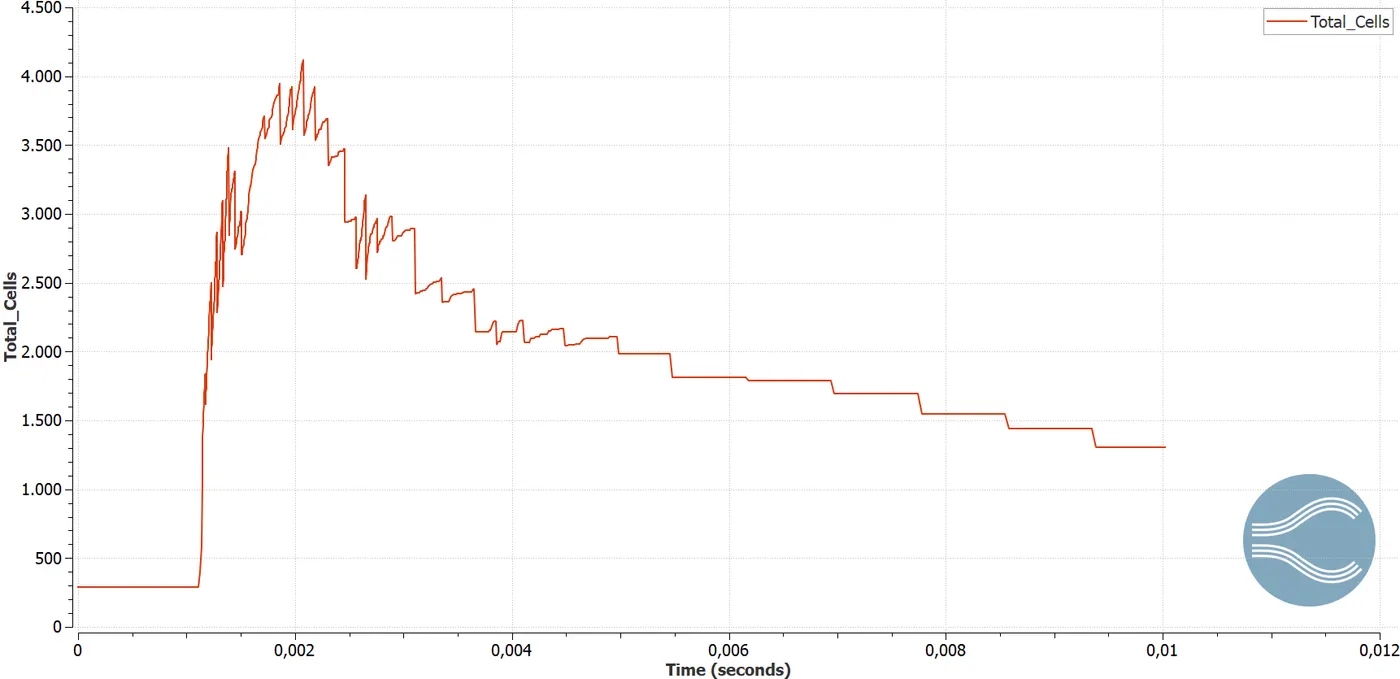
The cell count reaches almost 4K cells !
Pressure
Below is the link for pressure contour animation
https://youtu.be/z6wkLQUGrBo
Temperature
Below is the link for Temperature contour animation
https://youtu.be/5ihkOVcFlCw
In the above plot temperature and pressure starts to vary after 0.001 sec which depicts the bursting of the diaphragm and eventually both the parameters attains steady state. In the animation clips how the shock waves are being developed are shown. Since there is no outlet or inlet, the N2 and O2 mixture move back and forth due to the shock waves being generated in the tube.