Week 7: Shock tube simulation project
Objective
- Setup a transient shock tube simulation
- Plot the pressure and temperature history in the entire domain - Explain the result
- Plot the cell count as a function of time - Explain the result
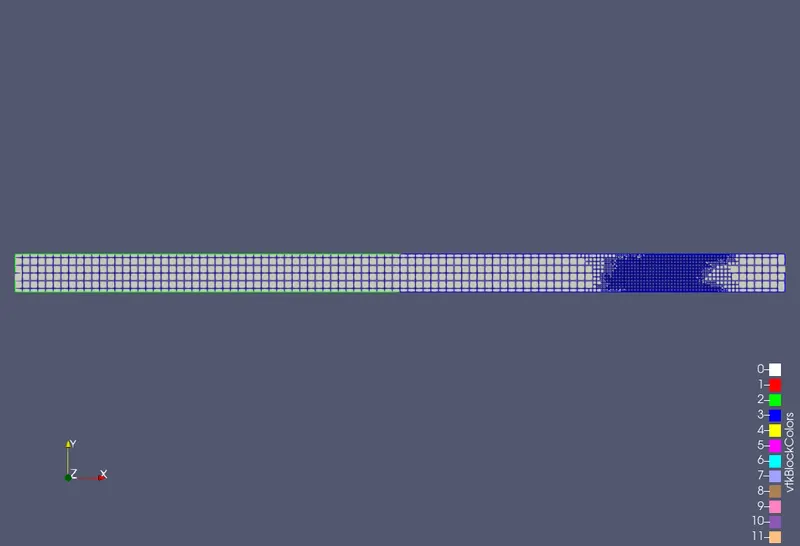
It is expected to show the mesh generation using PARAVIEW.
Also create an animation and upload it on You tube and provide the You tube link for an animaion in your report.
Answer:
Received Geometry
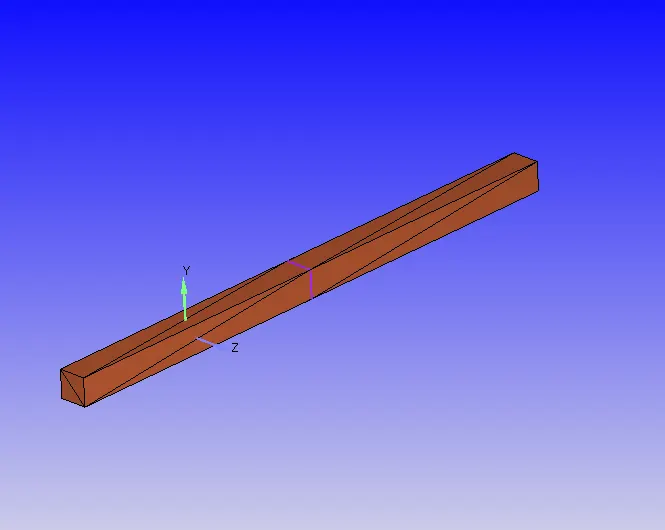
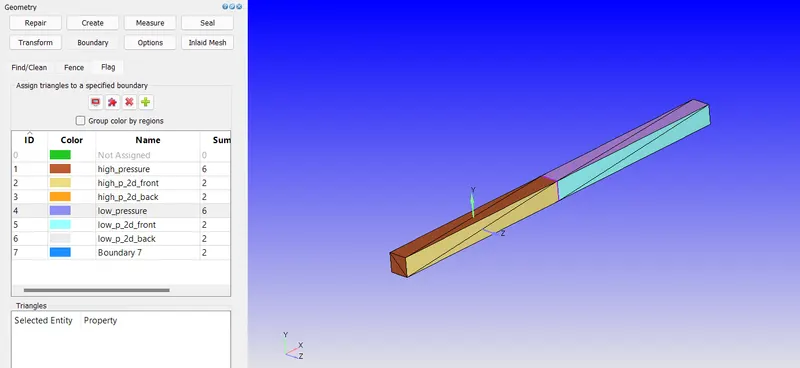
Boundary creation
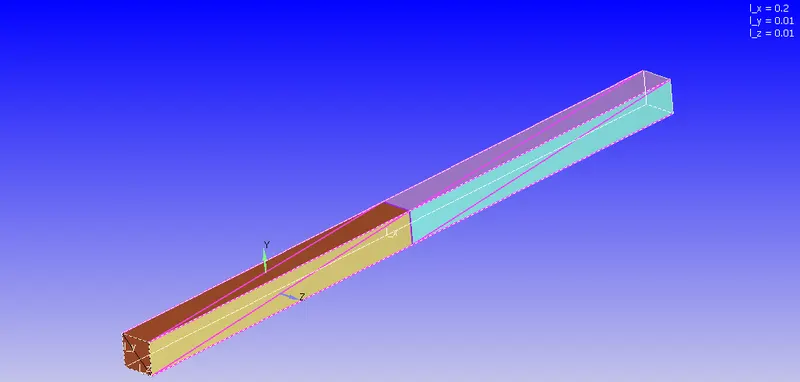
Geometry size
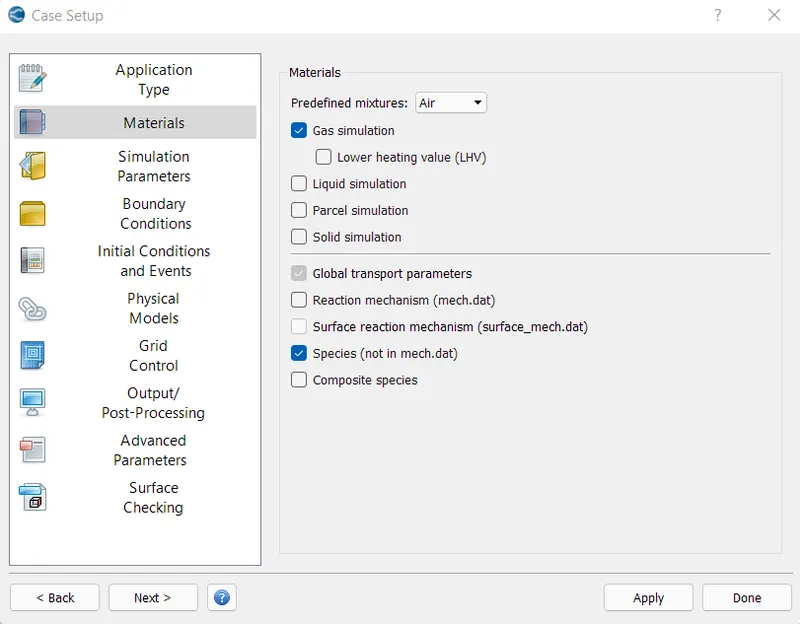
Case Setup
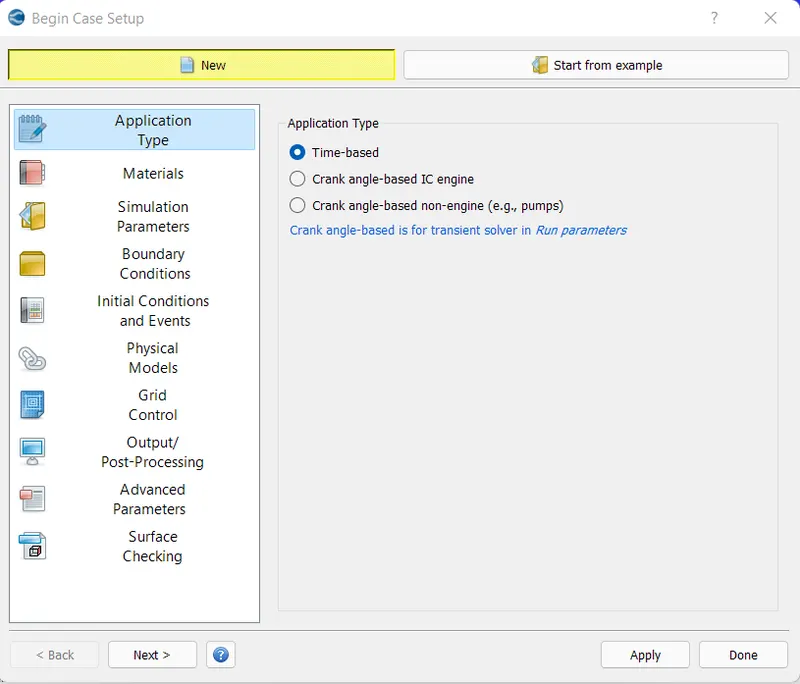
Material
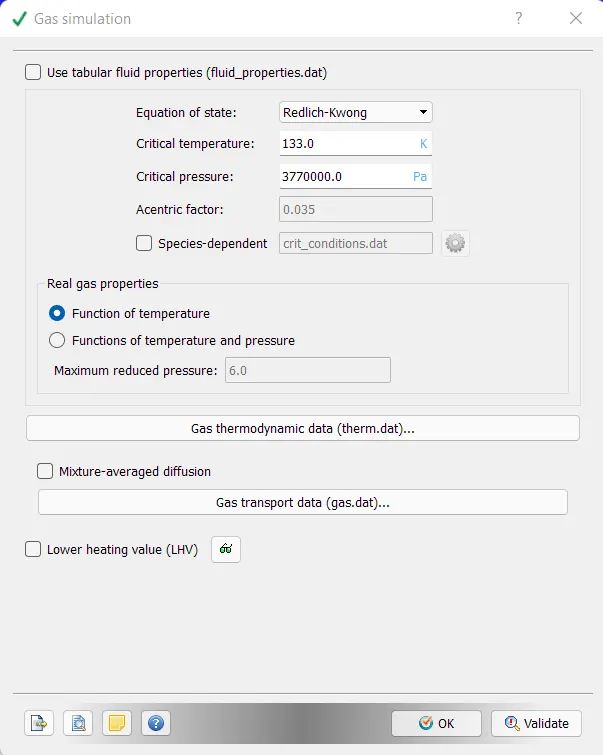
Gas simulation
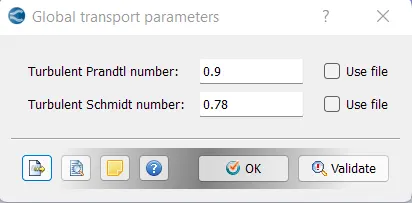
Gas Transport parameters
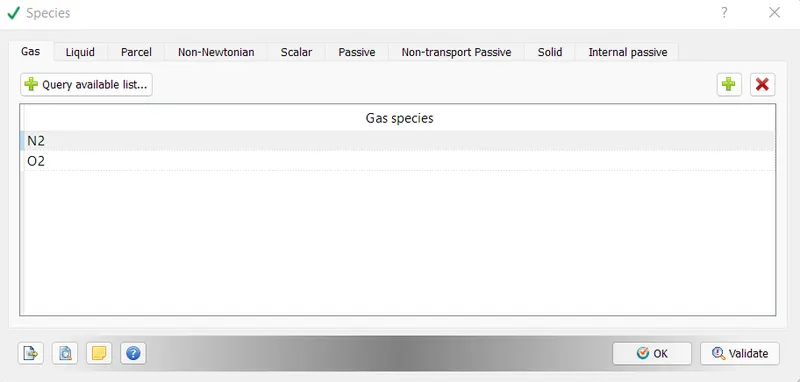
Species
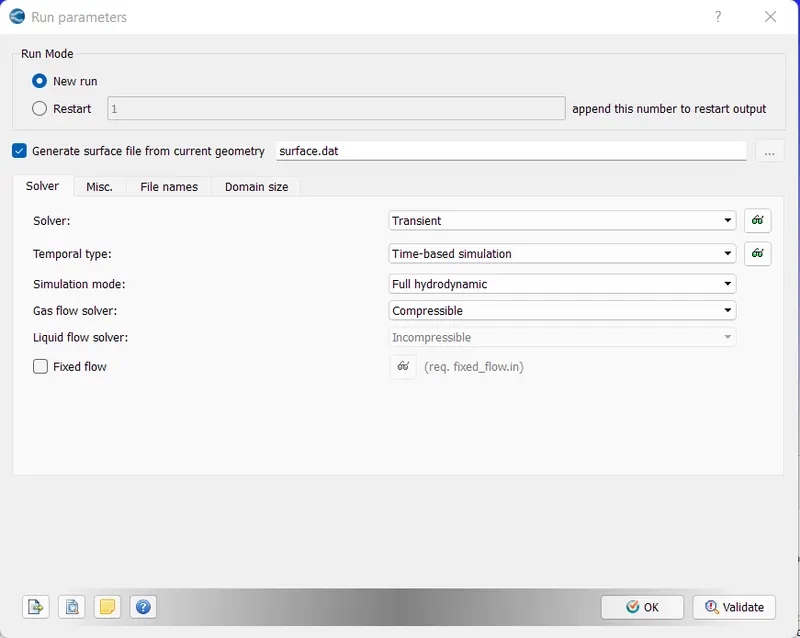
Run parameters
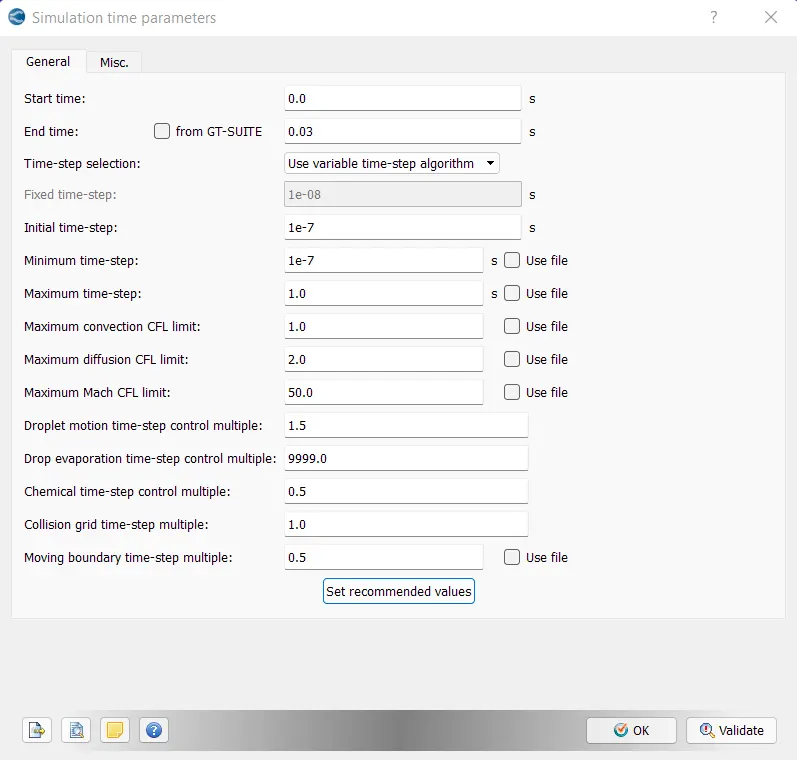
Simulation time parameters
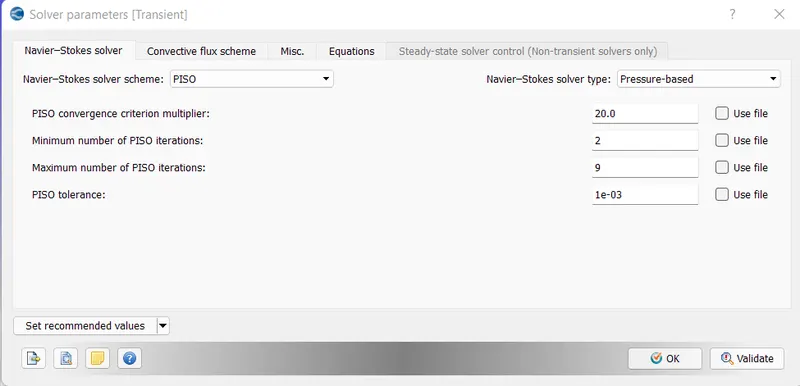
Solver parameters
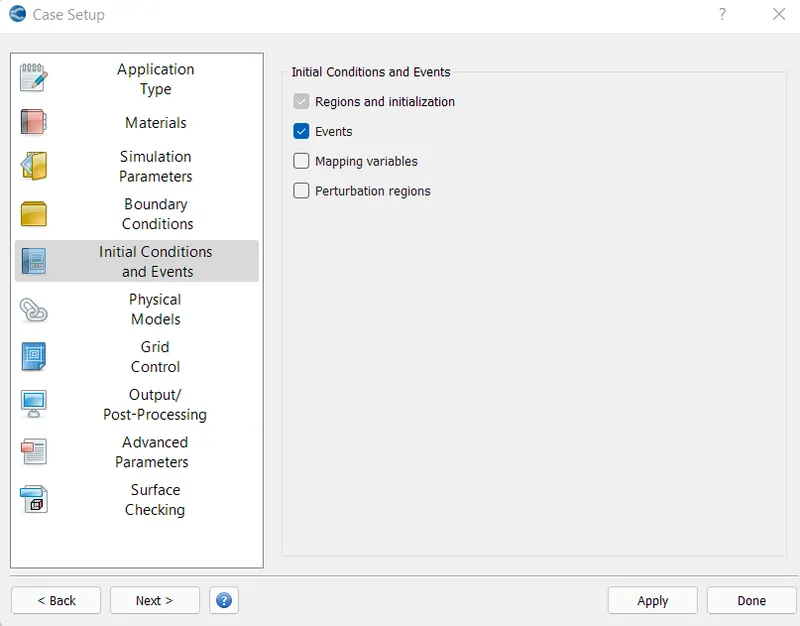
Initial conditions & events
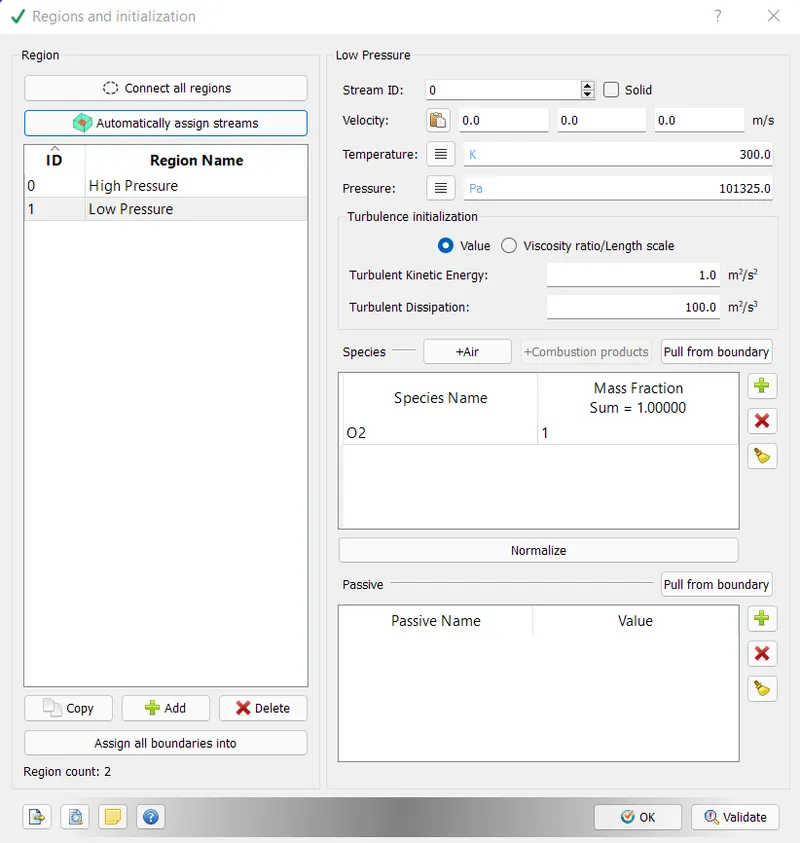
Regions & Initialization
Low Pressure
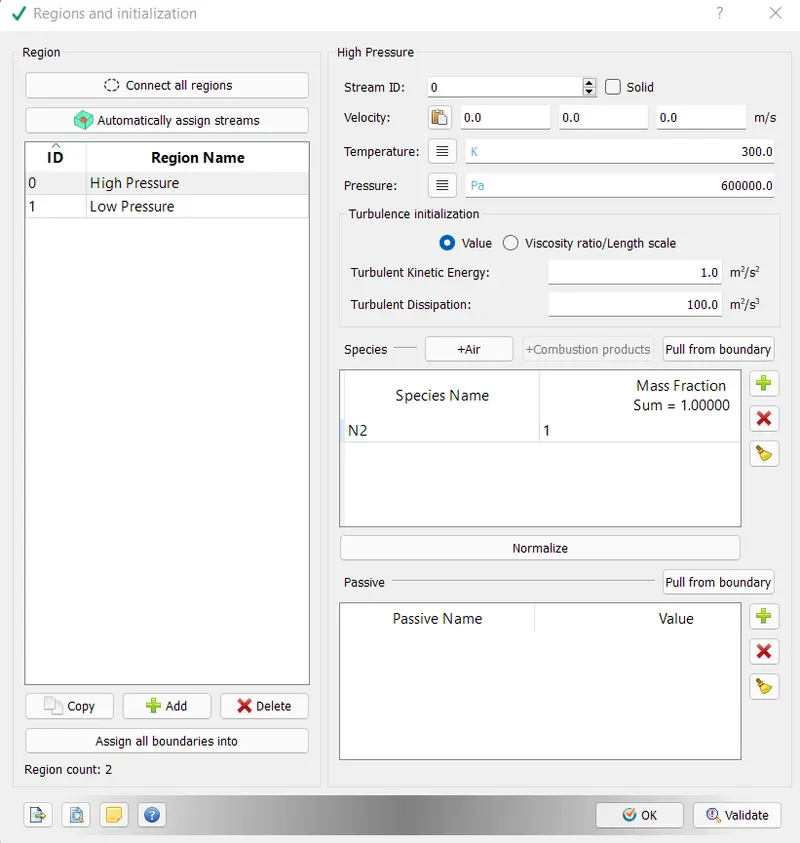
High Pressure
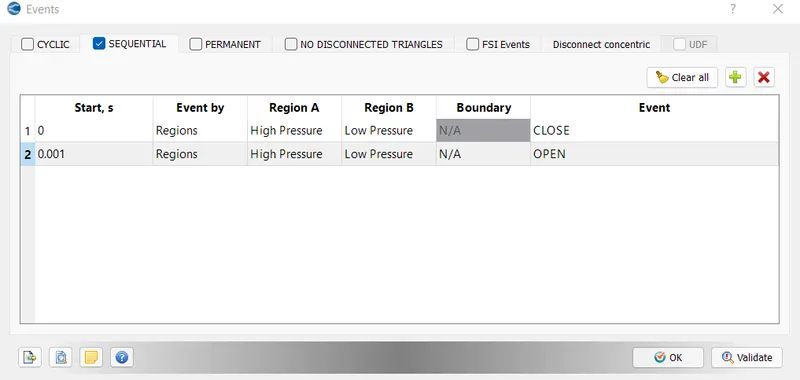
Events
To pop diaphragm at particular time, event has been created. So after 1 millisecond, the diaphragm will pop and two regions will collide which will create shock waves.
Boundary
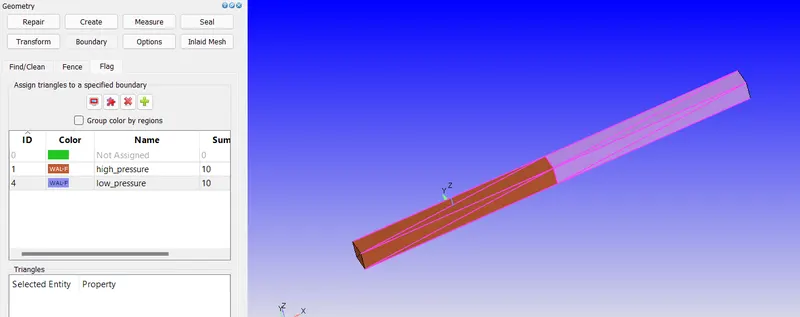
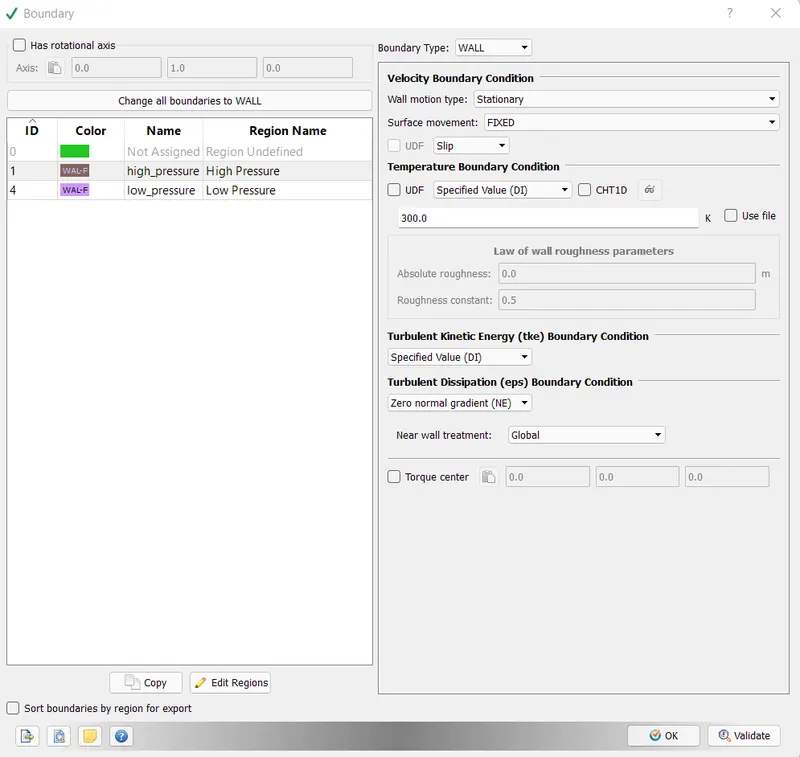
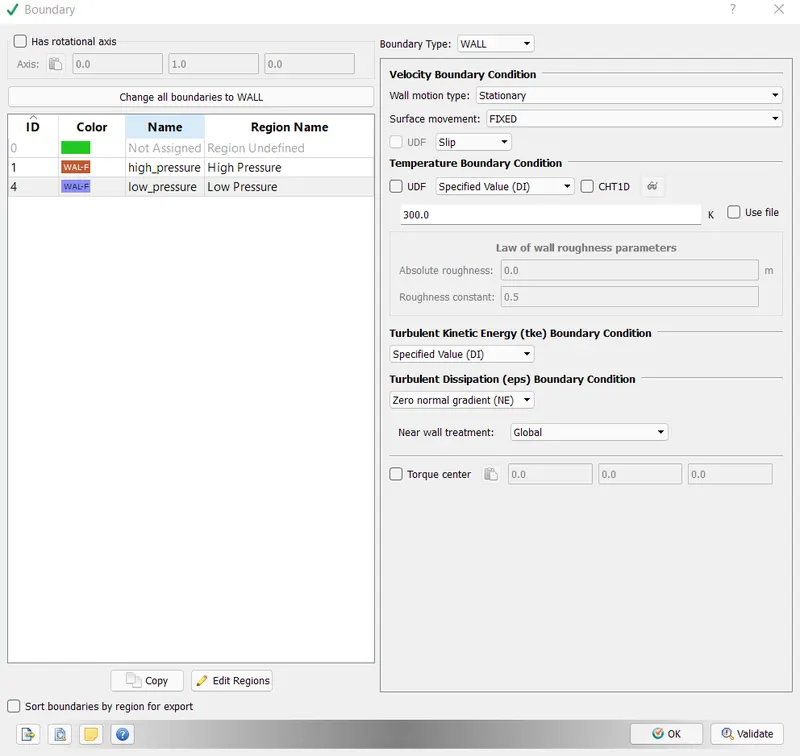
Two boundaries have been created for low & high pressure regions.
Turbulence Modeling
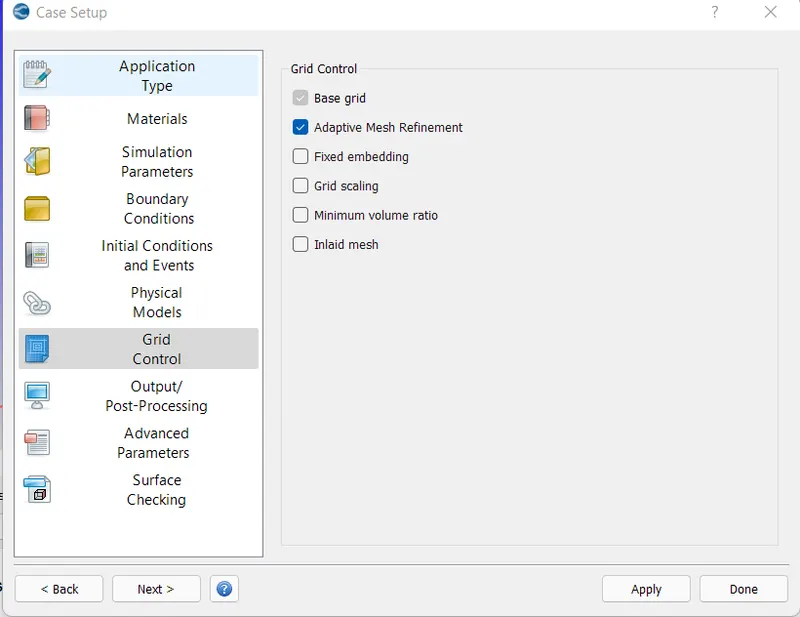
Grid control
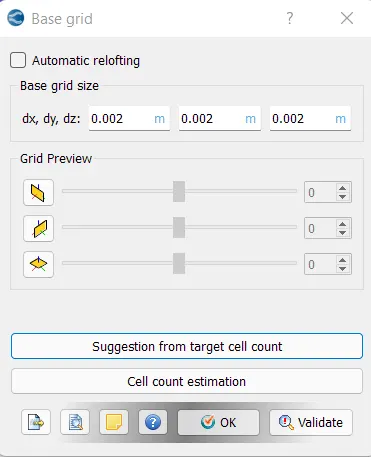
Base grid
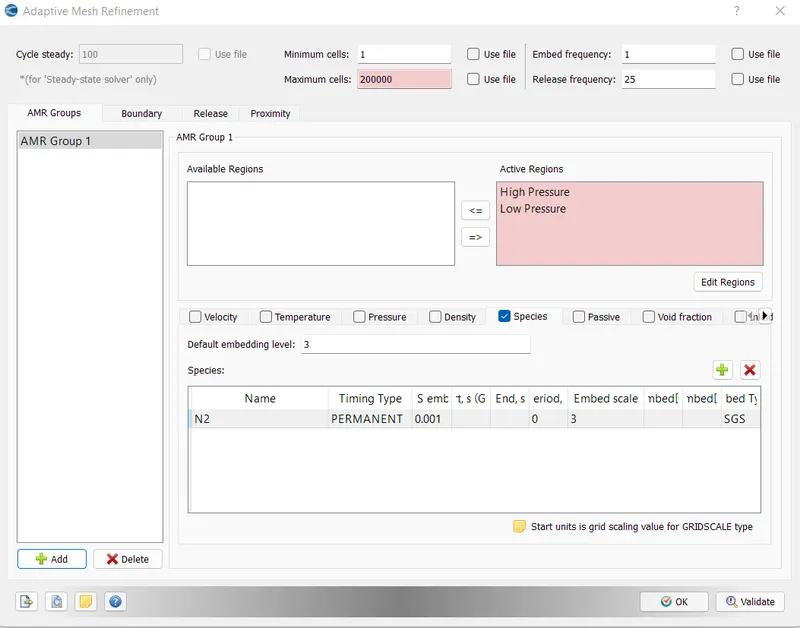
Adaptive Mesh
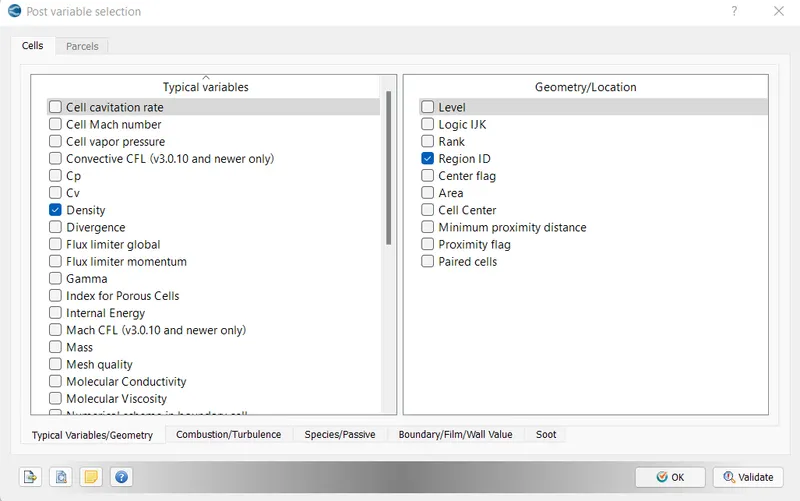
Post variable selection
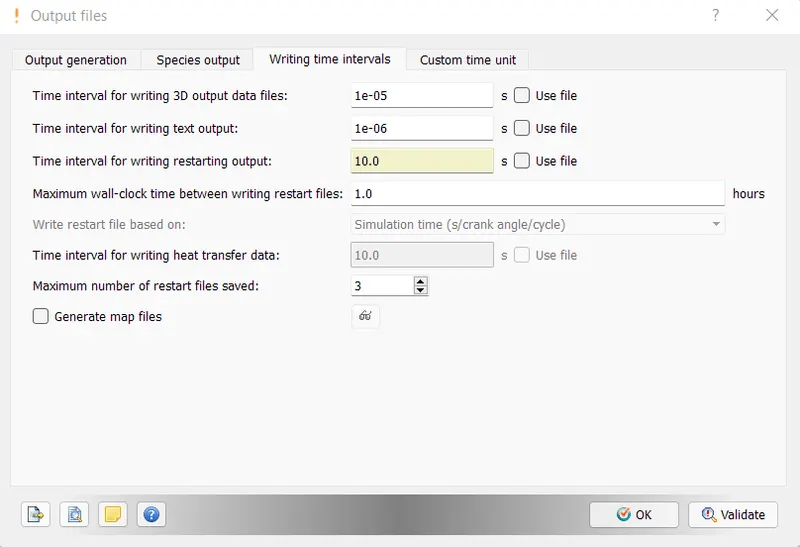
Output files
Mesh
Simulation
Simulation has been performed in Cygwin after navigating to the respective case directory & after executing following command:
mpiexec.exe -n 4 converge.exe restricted
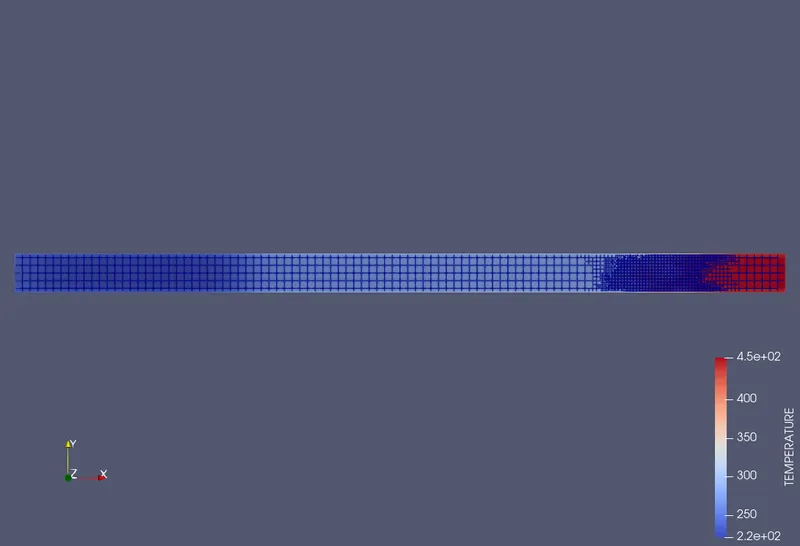
Temperature Contour
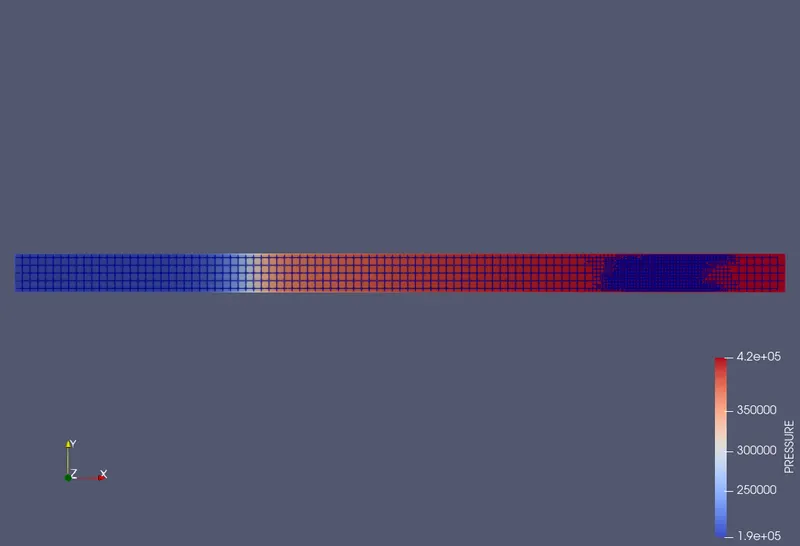
Pressure Contour
Plots
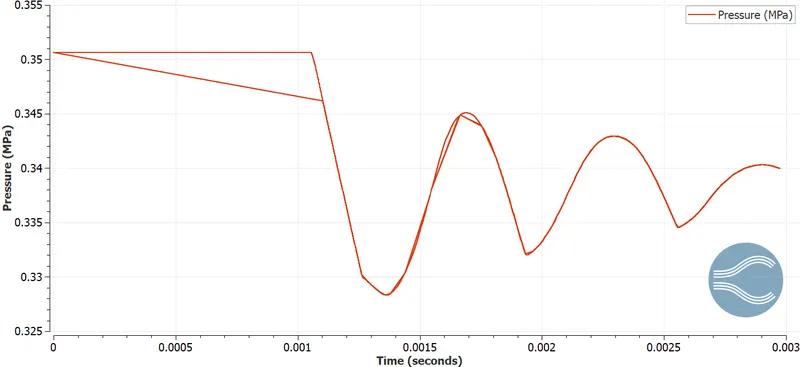
Pressure
After popping diaphragm, the pressure is started decreasing with time as it entered into the low pressure region.
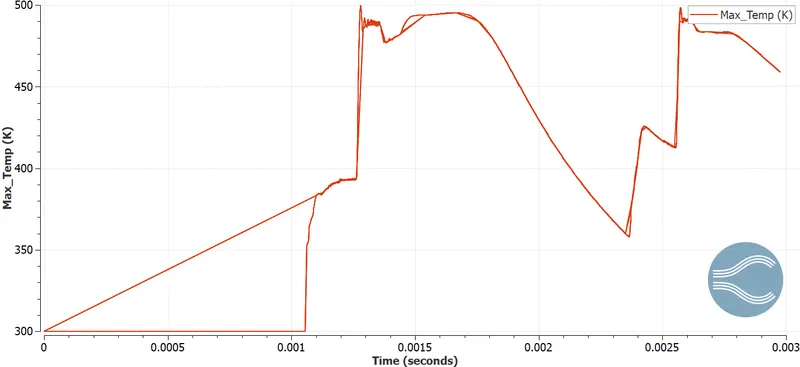
Temperature
The temperature was kept increasing because of shock formation. It reaches as high as 500 K from initial 300K. The temperature was increasing & reached the highest point whenever two different zone came in contact with each other.
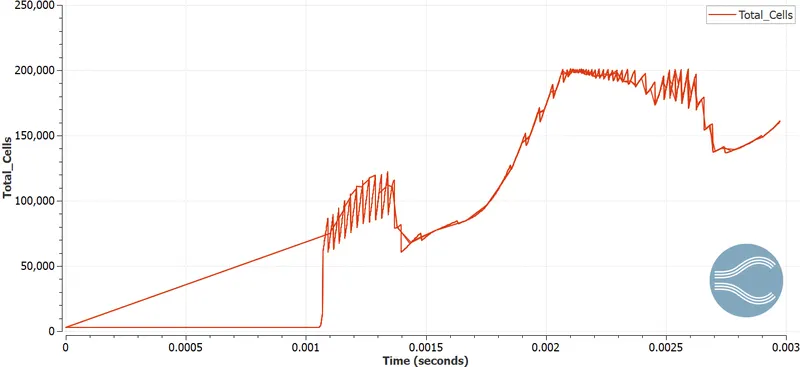
Total cell count with respect to time
Cell count was increasing with time reach upto 200000 which is max element limit set before the simulation. The fluctuations represent here adaptive mesh zone when two zone was colliding inside the tube.