Week 7: Shock tube simulation project
Aim:- Shock tube simulation project
objective:-
- Setup a transient shock tube simulation
- Plot the pressure and temperature history in the entire domain - Explain the result
- Plot the cell count as a function of time
shock tube
The shock tube is an instrument used to replicate and direct blast waves at a sensor or a model in order to simulate actual explosions and their effects, usually on a smaller scale.
Shock tubes (and related impulse facilities such as shock tunnels, expansion tubes, and expansion tunnels) can also be used to study aerodynamic flow under a wide range of temperatures and pressures that are difficult to obtain in other types of testing facilities. Shock tubes are also used to investigate compressible flow phenomena and gas phase cumbution reaction. More recently, shock tubes have been used in biomedical research to study how biological specimens are affected by blast waves.
A shock wave inside a shock tube may be generated by a small explosion (blast-driven) or by the buildup of high pressures which cause diaphragm(s) to burst and a shock wave to propagate down the shock tube (compressed-gas driven).
Shock tubes have been developed in a wide range of sizes. The size and method of producing the shock wave determine the peak and duration of the pressure wave it produces. Thus, shock tubes can be used as a tool used to both create and direct blast waves at a sensor or an object in order to imitate actual explosions and the damage that they cause on a smaller scale, provided that such explosions do not involve elevated temperatures and shrapnel or flying debris. Results from shock tube experiments can be used to develop and validate numerical model of the response of a material or object to an ambient blast wave without shrapnel or flying debris. Shock tubes can be used to experimentally determine which materials and designs would be best suited to the job of attenuating ambient blast waves without shrapnel or flying debris. The results can then be incorporated into designs to protect structures and people that might be exposed to an ambient blast wave without shrapnel or flying debris. Shock tubes are also used in biomedical research to find out how biological tissues are affected by blast waves.
simulation setup
open converge application import stl file of tube and so the boundary flagging
once boundary flagging is done now run thediagnossis if any error are fresen resolve them
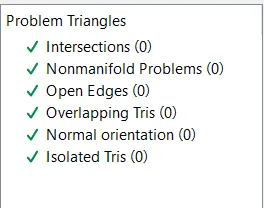
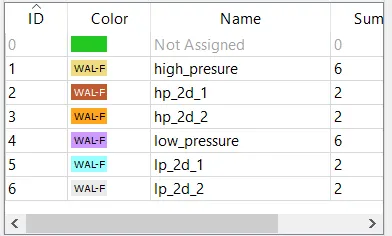
now case setup
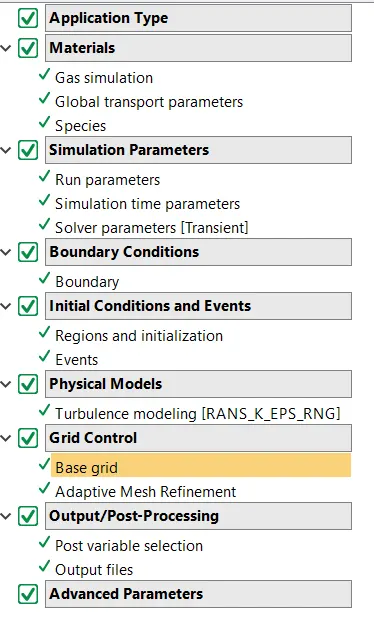
case setup tree
open materials select air as predefinre mixture
in spices selelct O2 and N2
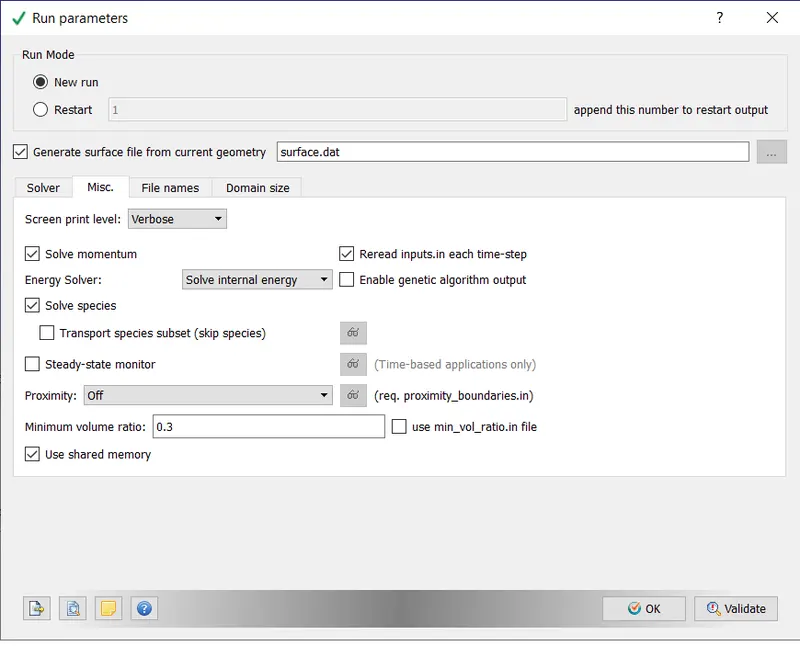
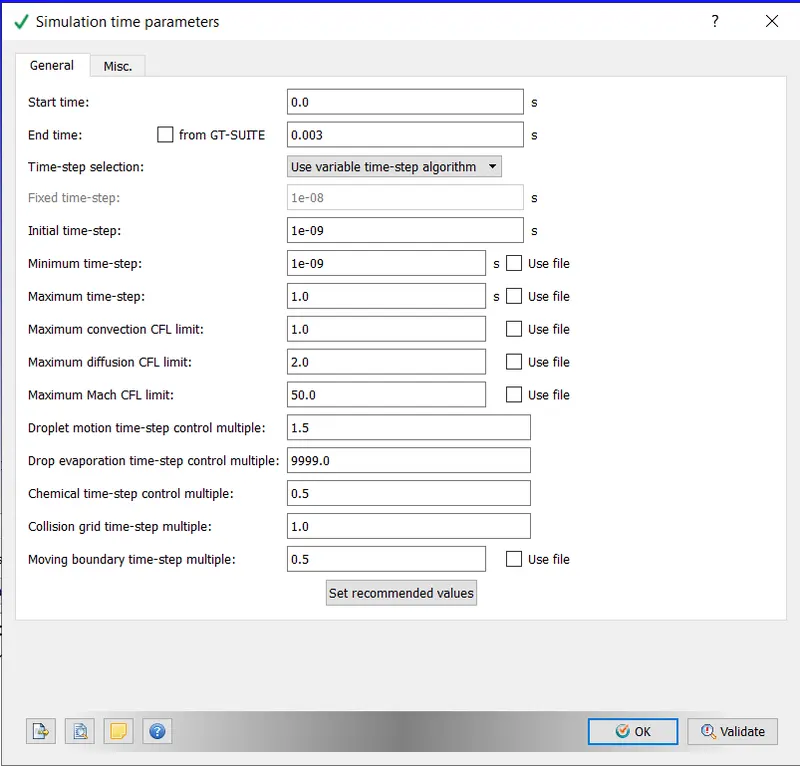
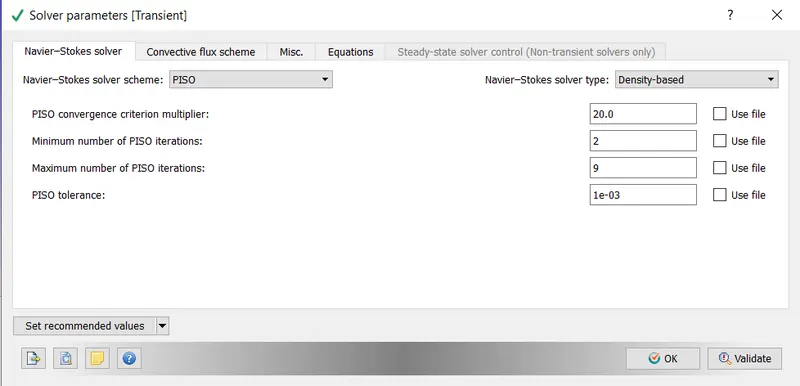
simulation parameter:
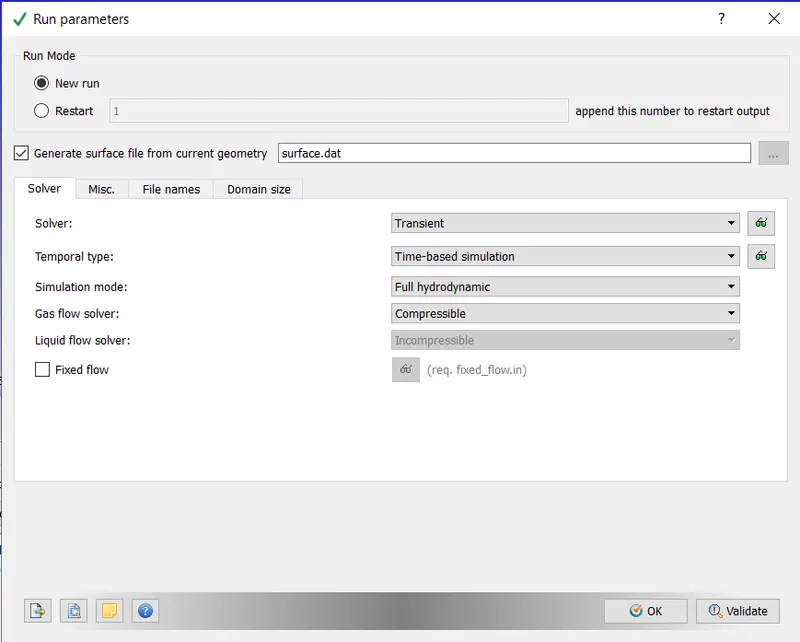
boundary condtion
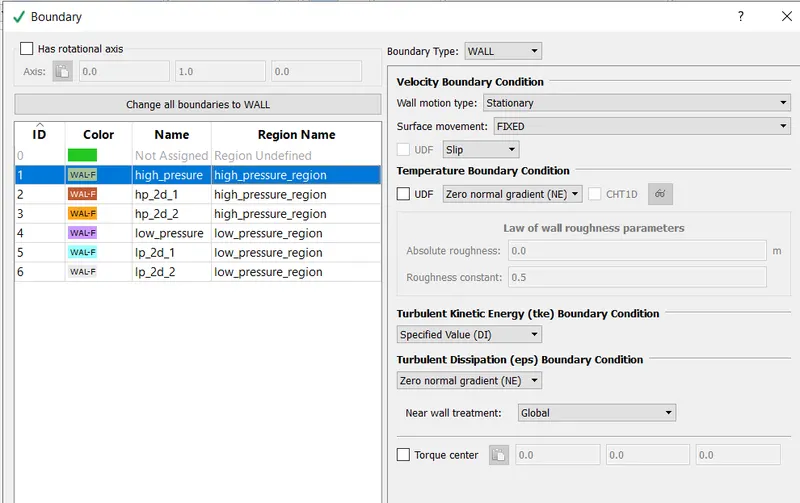
and all othere wall as slip condtion with zero gradient of temprature
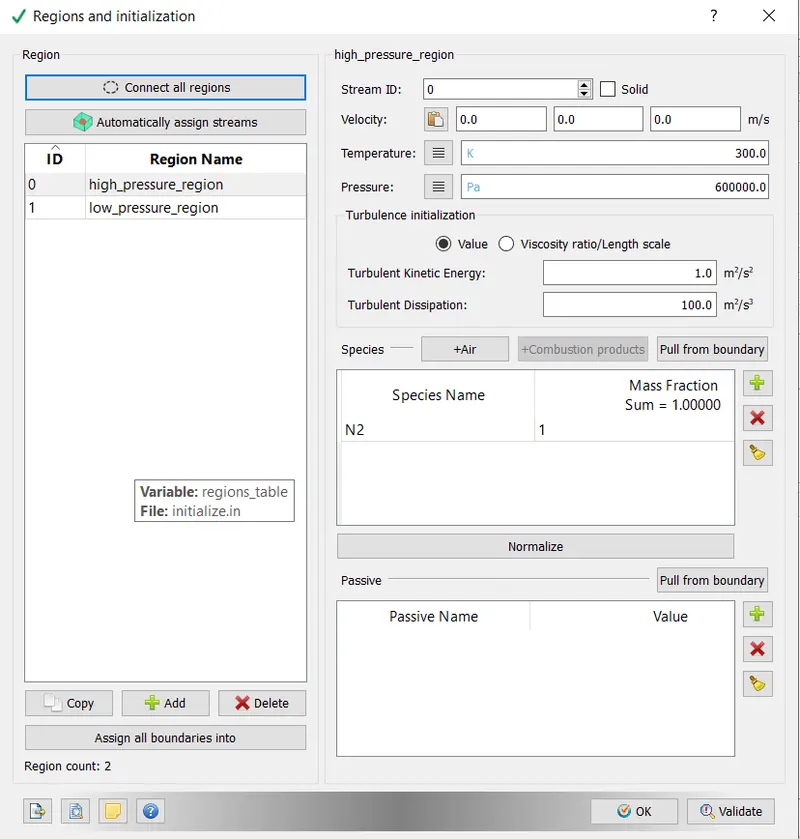
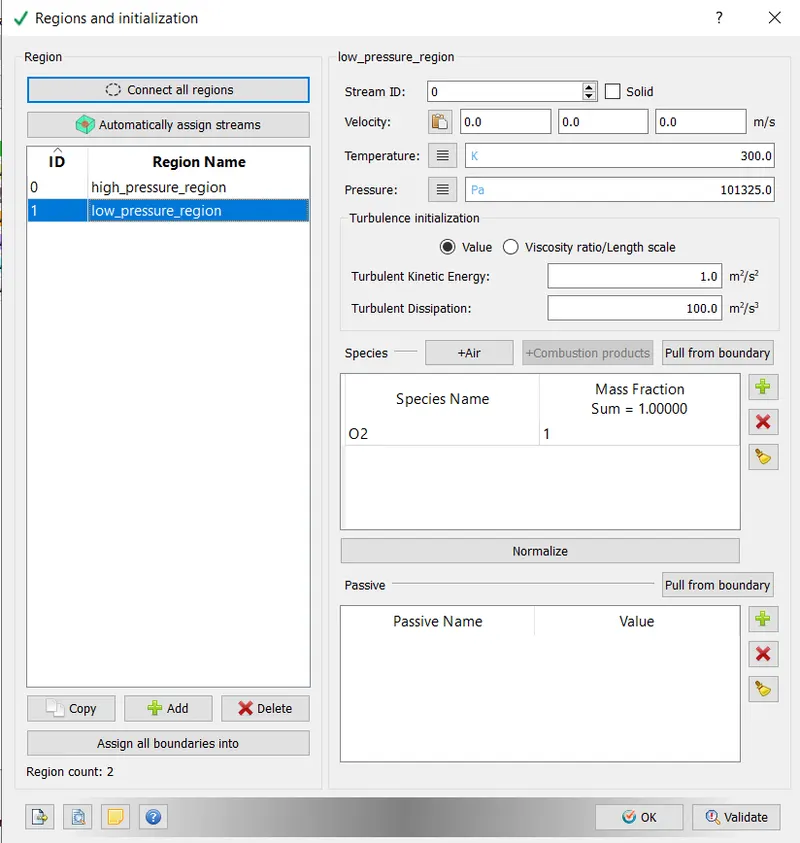
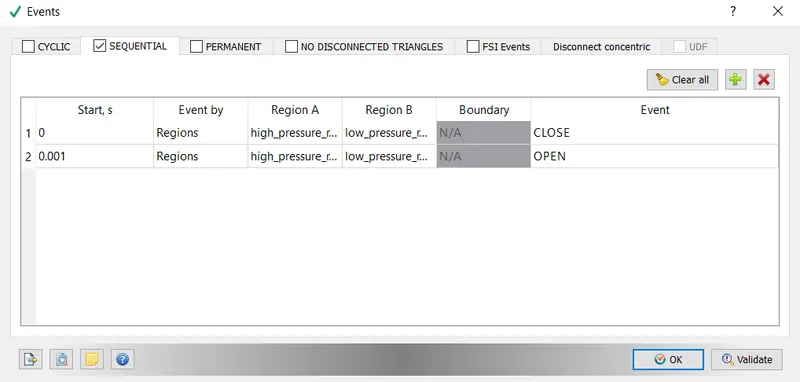
region and intialization : in this simlation event also selected
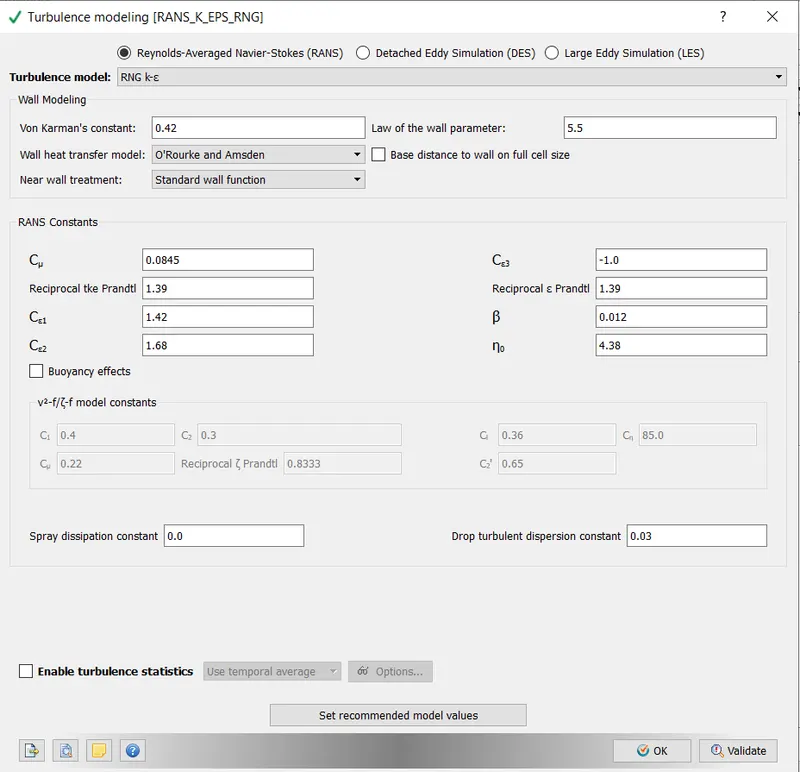
physica models
grid control: here adative meshing also selcated
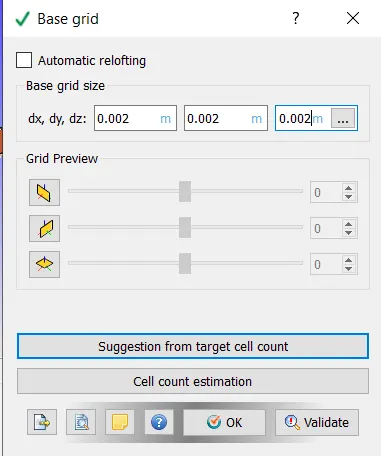
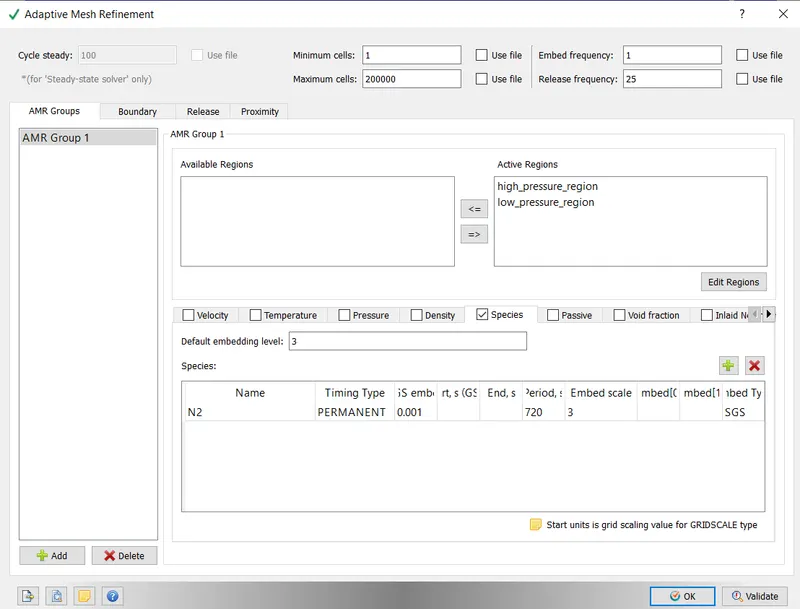
output / post processing
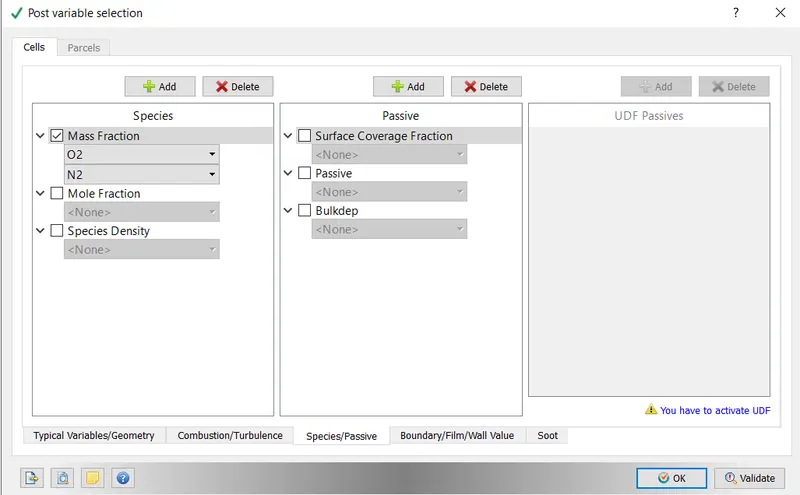
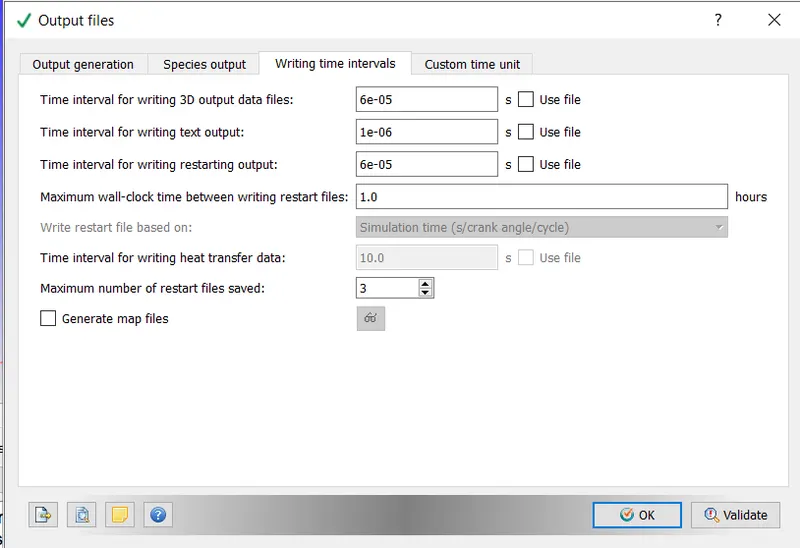
once case setup is done run the final validation
then export the input file a folder
now open cygwin apllication navigate to the folder where inputfiles are saved
wait till simulation runs then plot the result in converge application in line plotting section
result:
result plots are seen in line plot section
for base grid 0.004
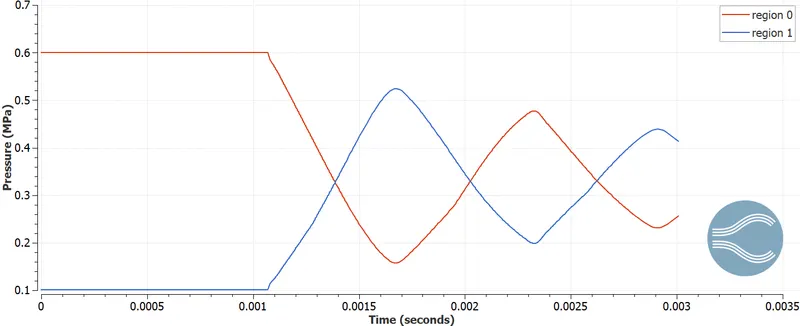
pressure
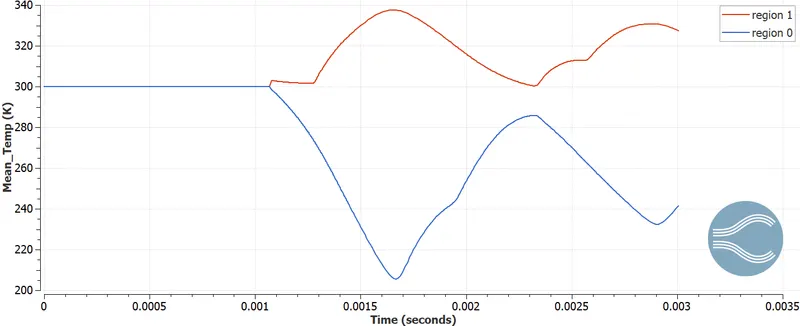
temprature
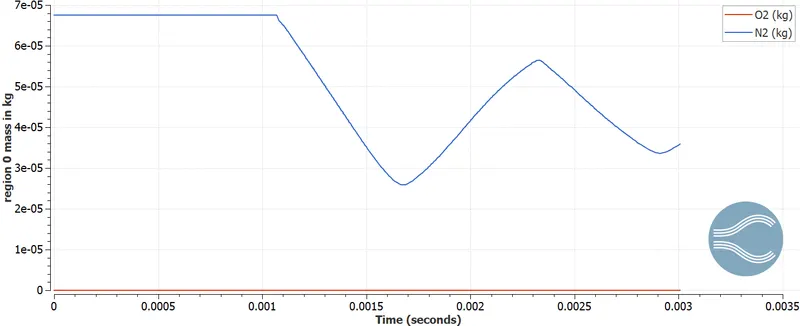
spicies mass in region 0
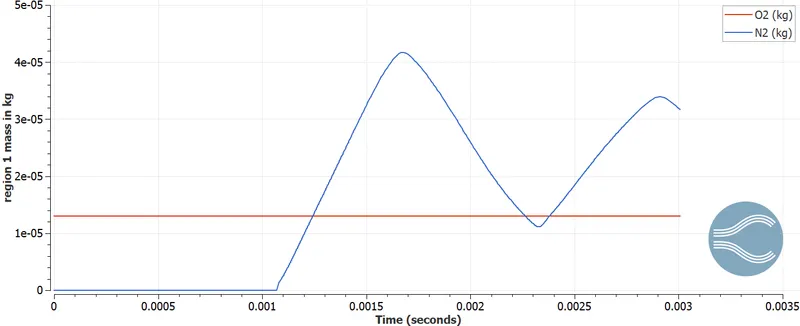
spices mass in region 1
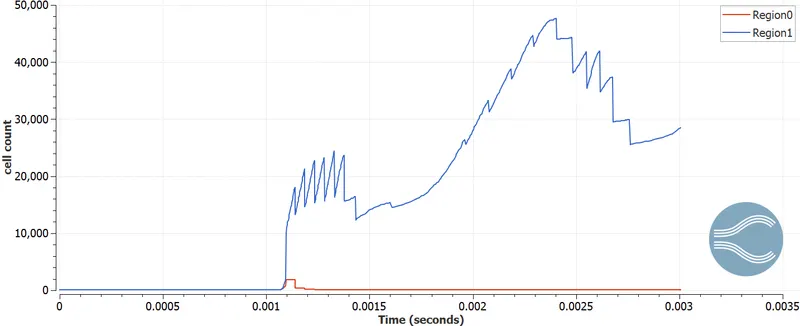
cell count in each region
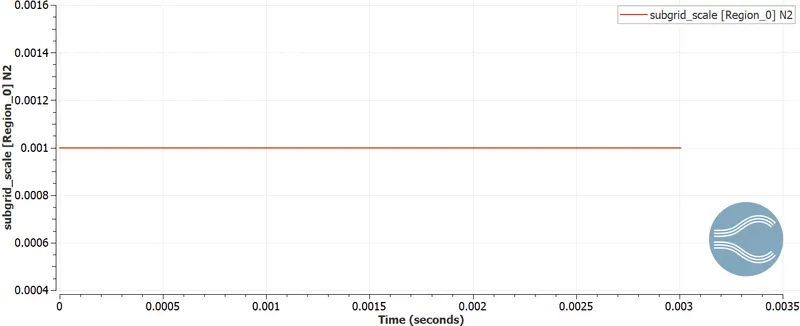
subgrid scale
base grid 0.002
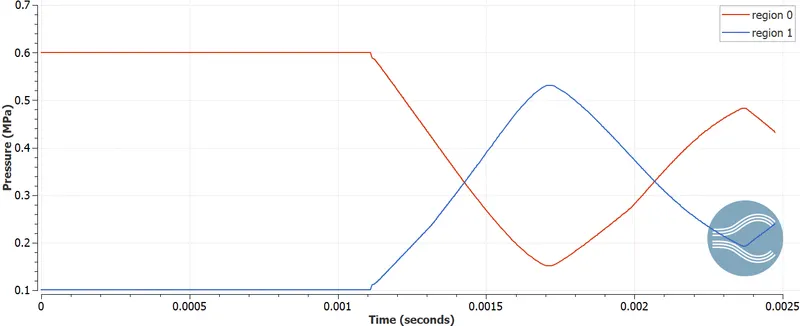
pressure
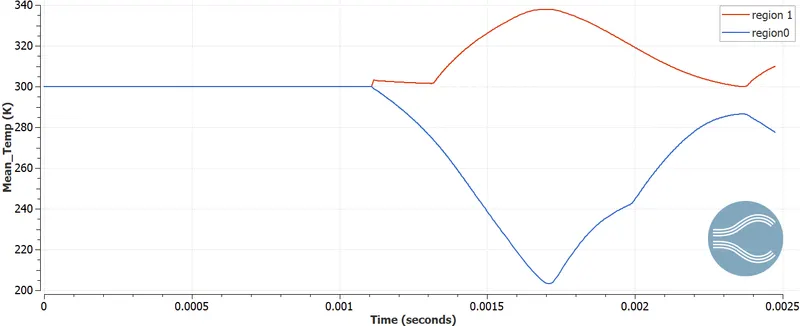
temprature
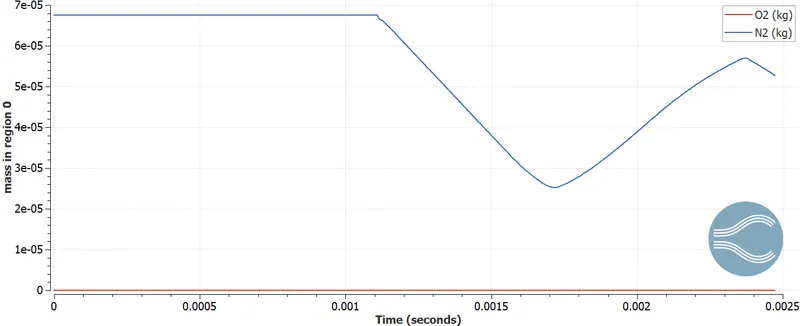
spicies mass in region 0
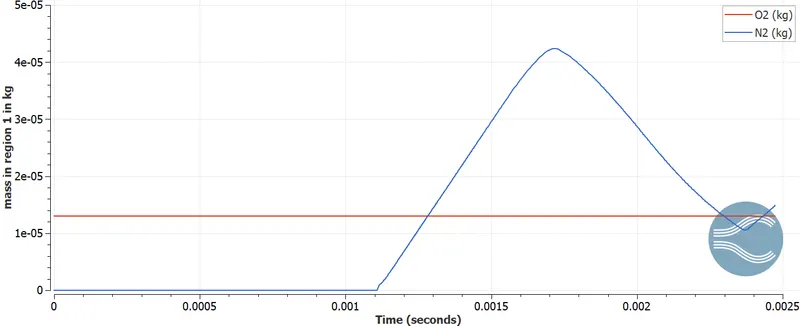
speaces region 1
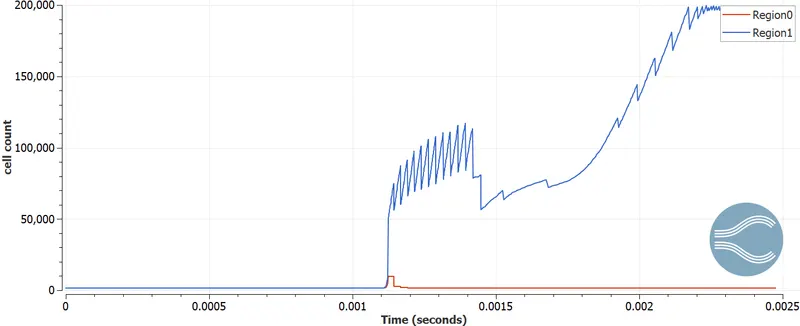
cell count in each region
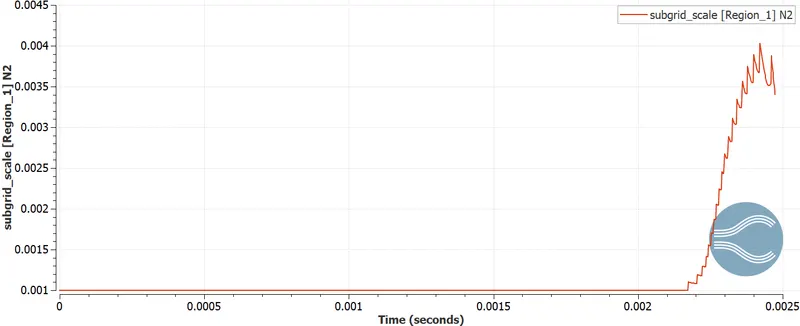
sub grice scale
grid size 0.001
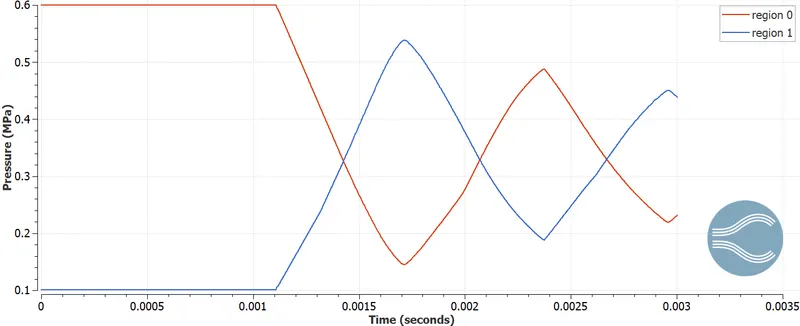
pressure
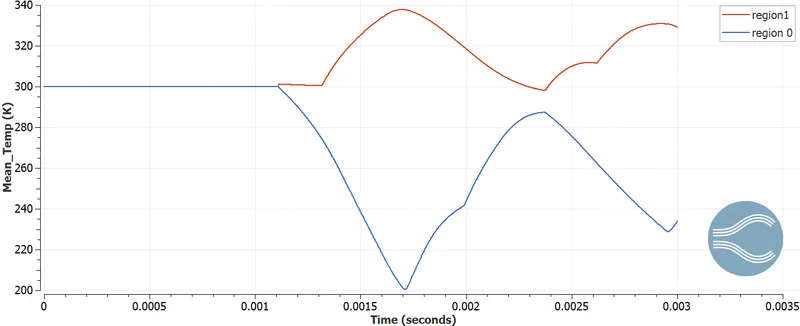
temprature
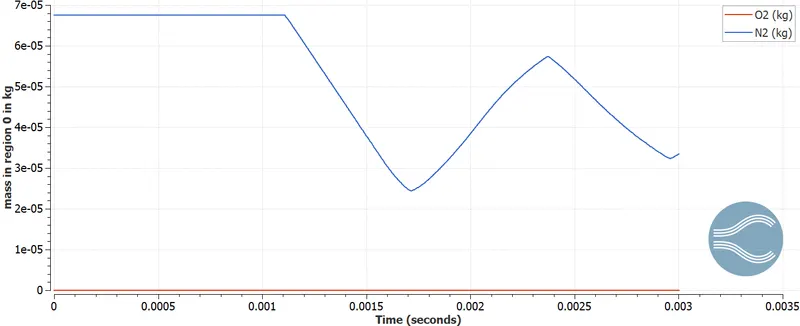
species mass in region 0
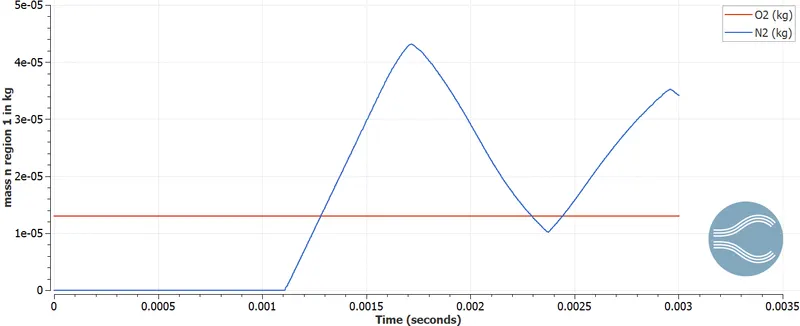
species mass in region 1
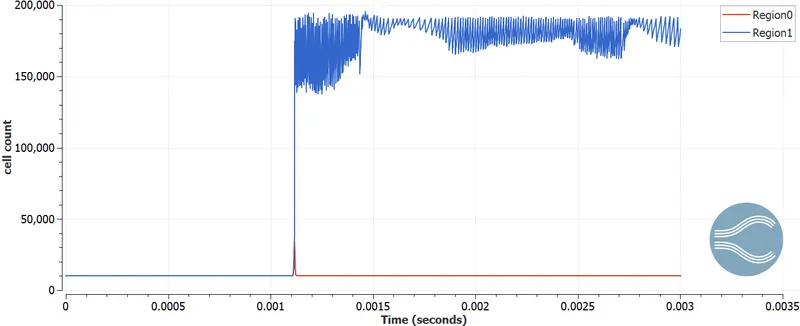
cell count
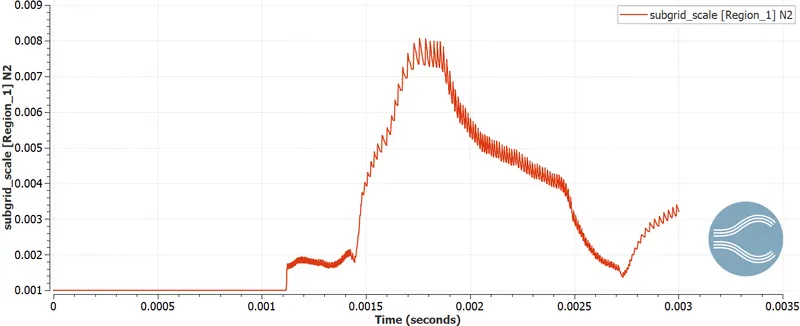
sugride scale
from plots
till the event is activated i.e 0.001 sec every thing was at rest when the evente is opend observations dicused
- mean temprature increase in region 1 and decreases in region 0
- there is subsequent drop in pressure in region 0 after few time and increase in pressure in region 1 subsequently
- mass of species N2 increases in region 1 and deccrease in region 0
- whwre as mass of O2 remain same in throuth the simulation but mass of O2 is more in region 1 then region 0
- cell count in region 0 is almost constan throuh out the simulation but cell count in region 1 rapidly increase after event activation it is fluctuation throghout the simulation.
post processing
once the simlation is done open converge application and in post processing section convert the post process file t readable file for parview
now open paraview to look for post processing results
base grid 0.004
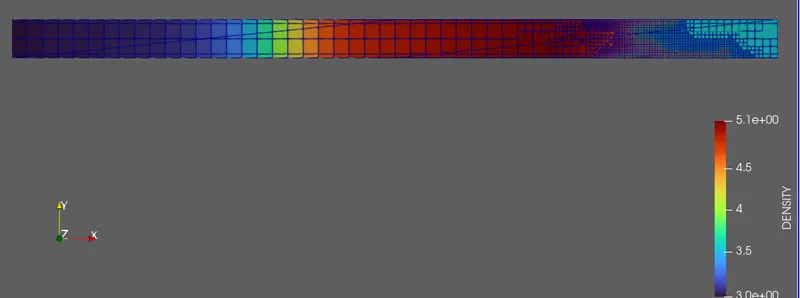
density
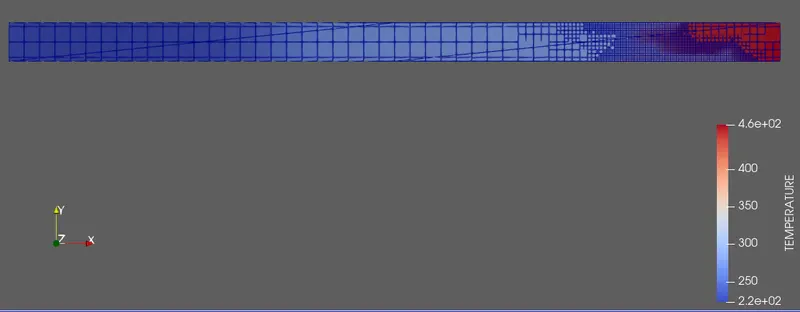
temp
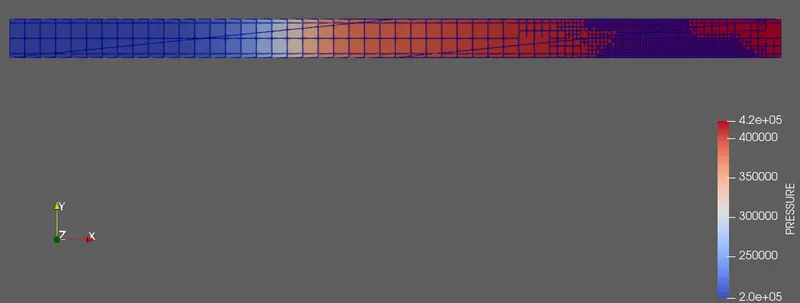
pressure
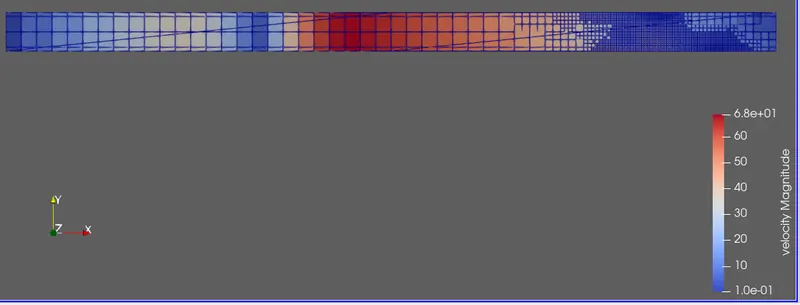
velocity
base grid0.002
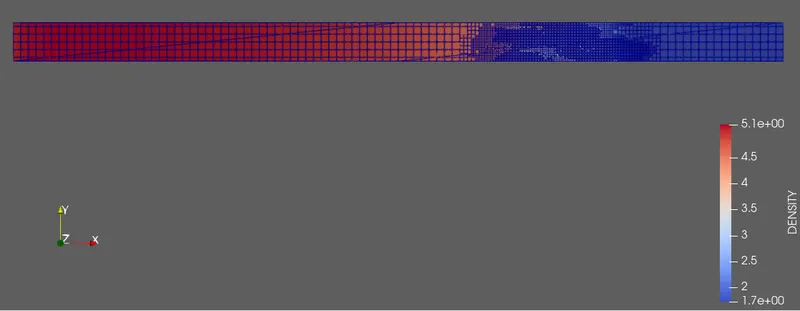
density
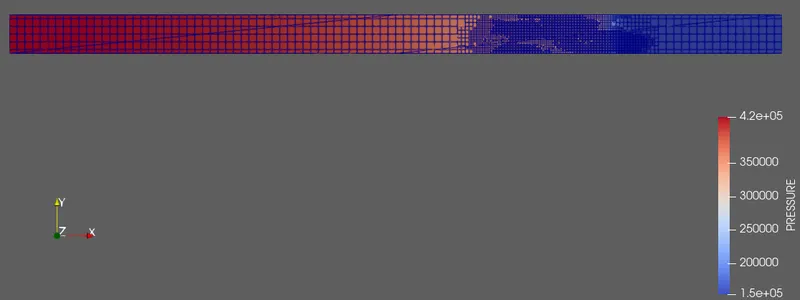
pressure
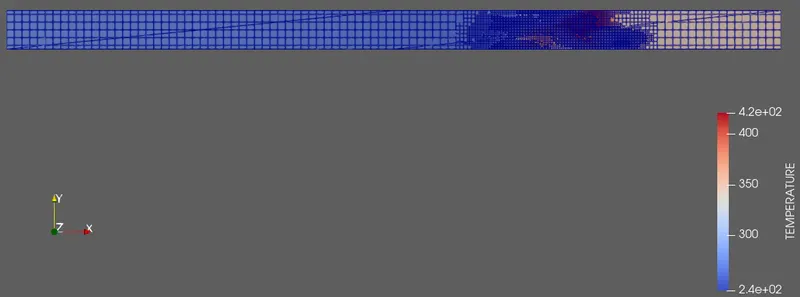
temp
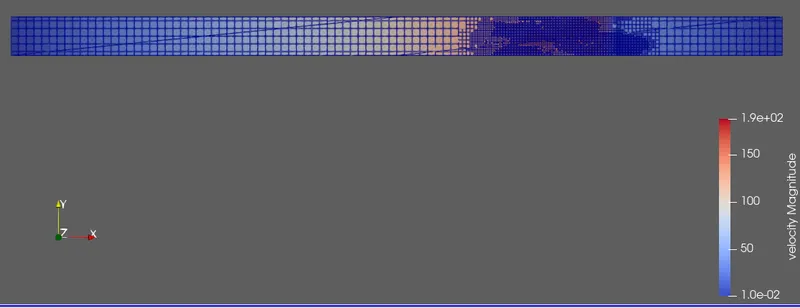
velocity
base grid 0.001

mesh
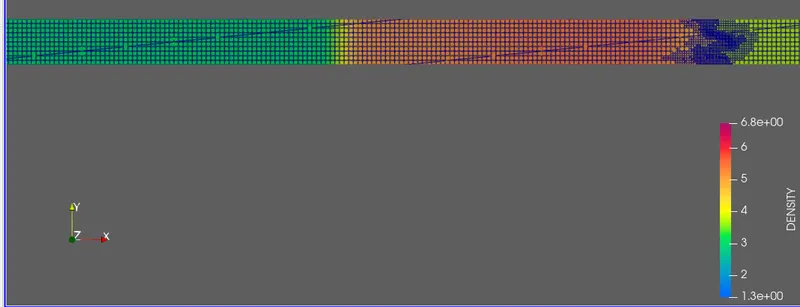
density
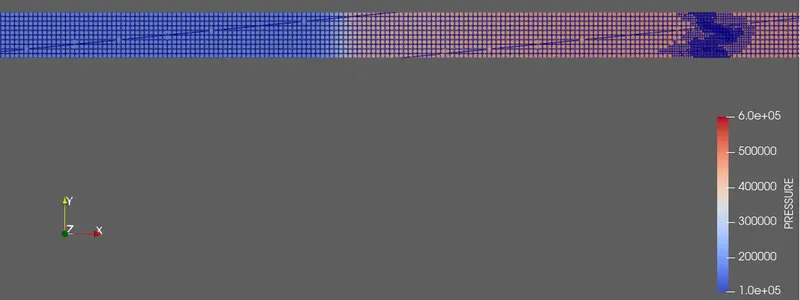
pressure
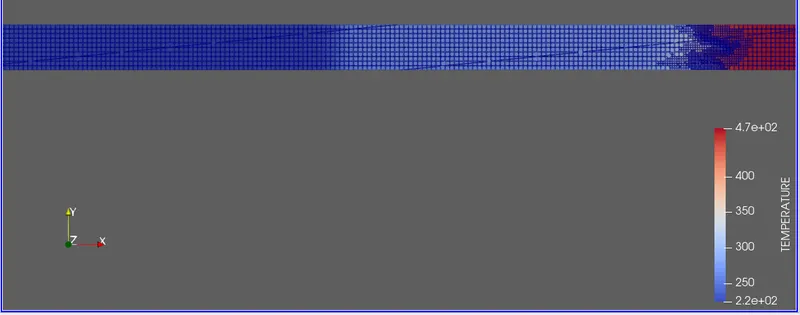
pressure
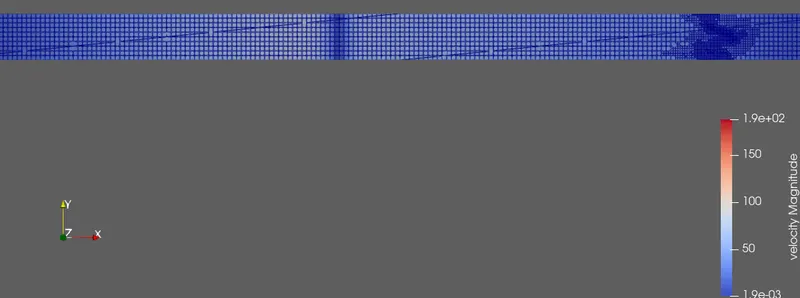
velocity
conclusion
- from result flot and post precessing it can be seen that lesser the grid size more accurate and clean results are obtained
- from plots its also seen that till the event is activated all the properties are constanta when the event is activated then fluctuation in property take place
- in grid size 0.001 the cell count is restricted to 200000 beacause in adptive mess section we defined maximum cell count as 200000
- with introduction of adaptive mesh in shock wave s are captured more accueretly
- animation which support conclusion are attached in zip file