Week-6 : Turbocharger Modelling
Turbocharger
The turbocharger is an integral part of th engine as it reuses the exhaust gases in order to increase the efficiency of the engine. It consists of two parts - compressor and turbine sides.
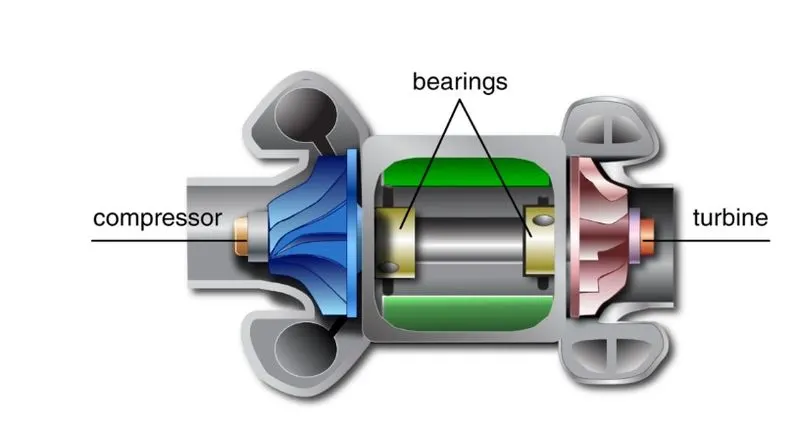
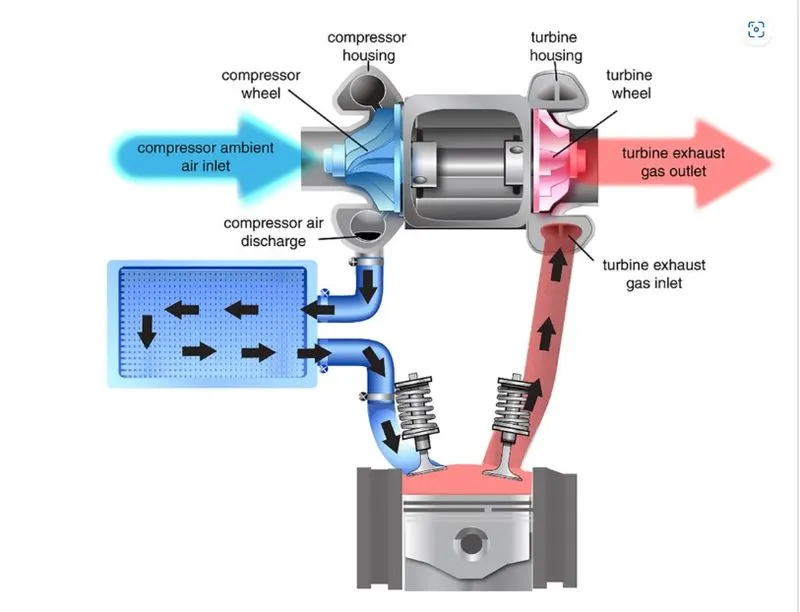
Difference between Turbocharger and supercharger -
Supercharger is power boosting device which require engine power to run the compressor. But Turbocharger use the exhaust gas kinetic energy to run the turbine which is coupled to compressor.
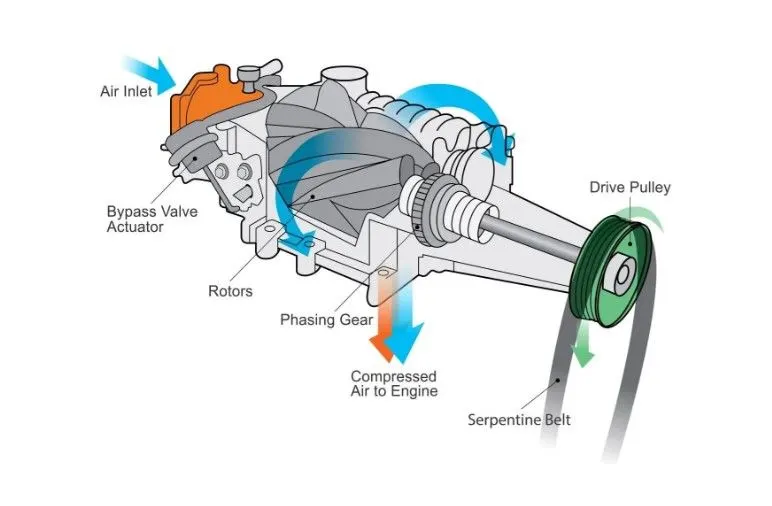
IMAGE - SUPERCHARGER
Types of Turbocharger systems -
1. Constant Pressure Turbocharging system.
- Exhaust gas from all cylinders into a common large manifold where pulse energy is largely formed.
- The gas flow steady rather than intermittentand at a constant pressure at turbine inlet.
2. Pulse turbocharging System
- To prevent this, cylinders are grouped relatively with connections to two or more exhaust pipes.
- Pipes are arranged, in small diameter to boost up pressure pulse and in short, straight length to prevent energy loss.
- Number of exhaust branch depends upon firing order, number of cylinders and turbocharger design.
Types of Turbocharger -
- Single-Turbo
- Twin-Turbo
- Twin-Scroll Turbo
- Variable Geometry Turbo
- Variable Twin Scroll Turbo
- Electric Turbo
Turbo Lag -
The lag comes from the time it takes the engine to create enough exhaust pressure to join the turbo and pump compressed intake air into the engine in starting.
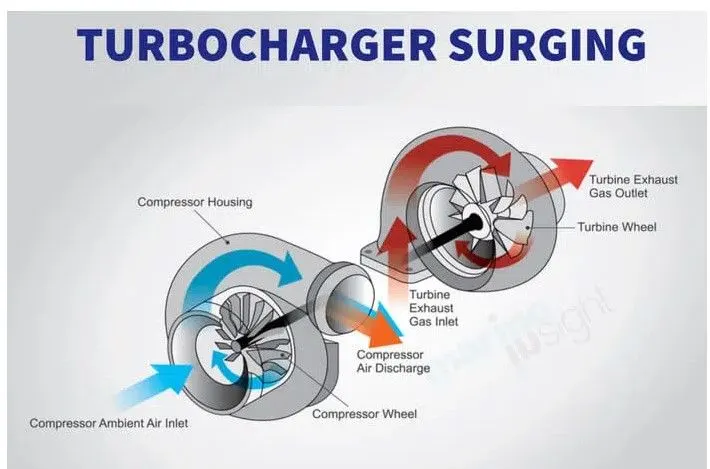
Turbocharger Surging -
When output pressure of compressor or turbocharger falls down inlet manifold pressure due to any reason (reason may be exhaust gass temperature, engine rpm etc.) then there is reverse flow of pressurized air. Pressurized air flows in backward direction i.e from scavenge manifold to turbocharger i.e into compressor and filter. It causes vibration and sounds from compressor vanes.
Task 2 Exploring turtorial number 6,7
I have considered three cases for analysis of turbocharger operations
Case 1 - Without Turbocharger
Case 2 - Only Compressor (Supercharger)
Case 3 - Complete Turbocharger assembly.
Tutorial-6:
The cylinder geometry are as follows:
Bore = 100 mm
Stroke = 100 mm
Connecting Rod length = 220 mm
Compression ratio = 16.5
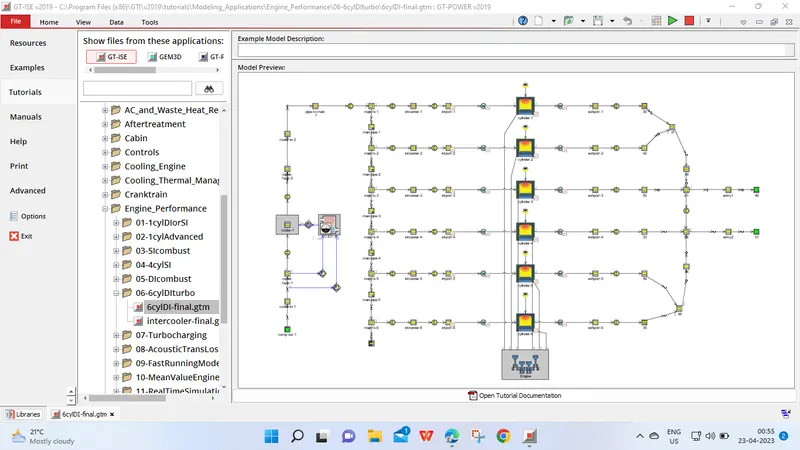
This model consists of 6 cylinders with the implementation of Turbo charger i.e 2 inlets to the turbo as we see in the form of two end environments at the right side and compressor outlet at the bottom in the form of end environment. Generally, twin turbine inlets are used with more than 3 cylinders. In this case, we have 6-cylinders where 3 outlets of cyliders share on the turbine inlet. We were able to combine the outlets of different cylinders with the help of flow splits template. Here, as there is no physical shaft connected the turbine and compressor, we directly input the outlet pressure (Absolute) values for the turbine as well as compressor. Here the inputs for the turbine and compressor are absolute pressure, temperature and composition of air.
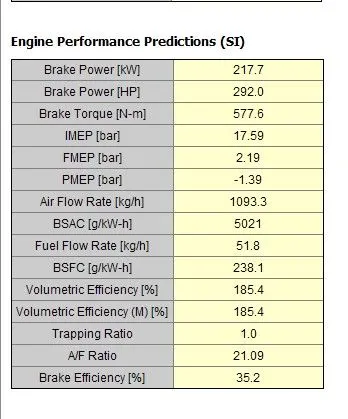
Engine Performance Parameter:
Tutorial-7:
Bore = 100 mm
Stroke = 100 mm
Connecting Rod length = 220 mm
Compression ratio = 16.5
Moment of interia of shaft = 0.0005kgm^2
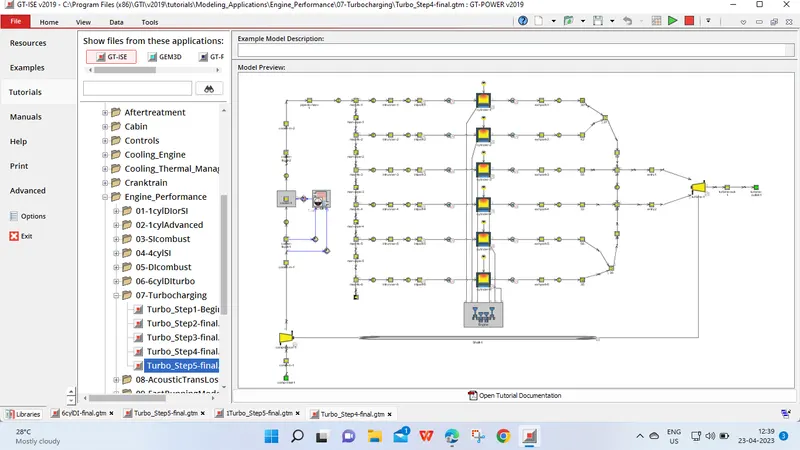
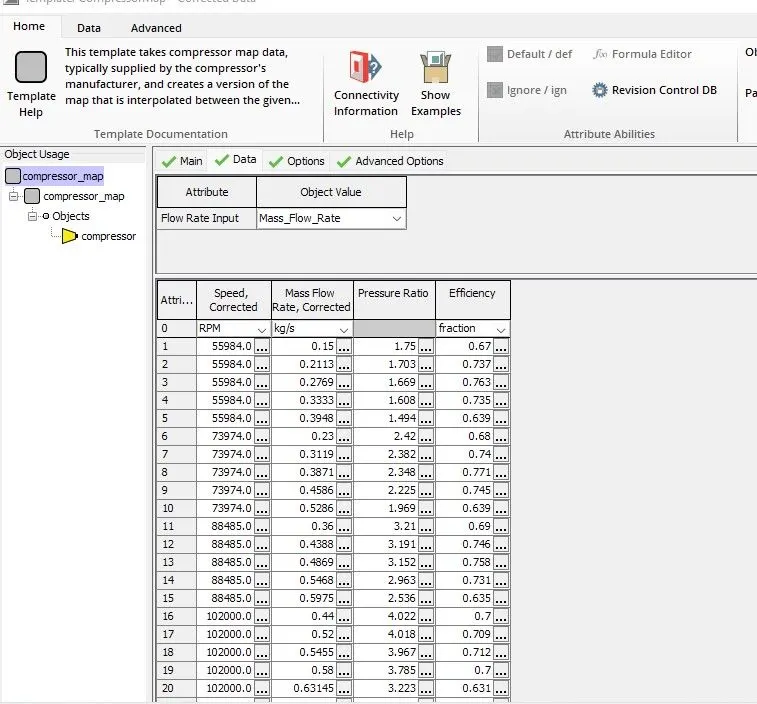
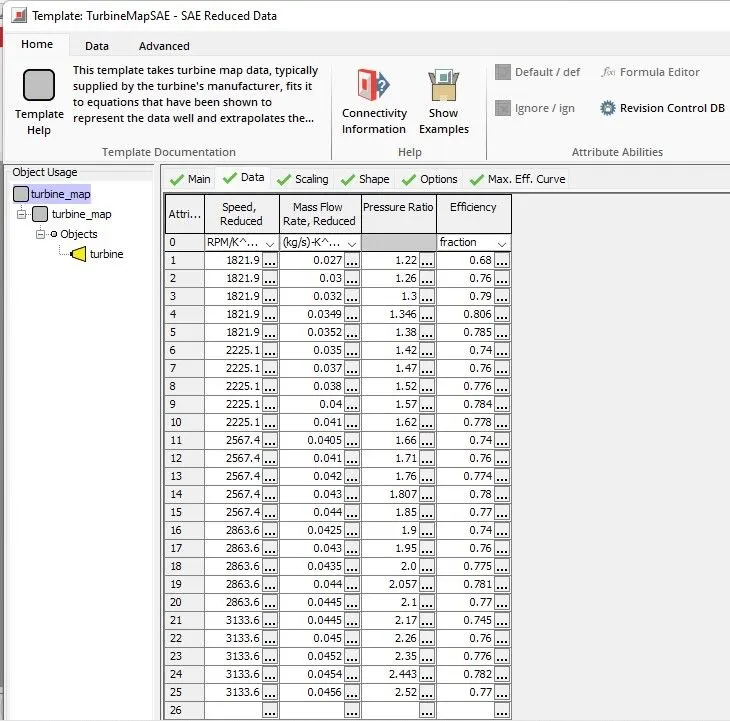
In this Model again we have 6 cylinders diesel enginewuth the two inlets to the turbocharger which is a collection from 6 cylinders splitting into 2 inlets. This model is conceptually same as the above model in tutorial no. 6 with the actual turbocharger setup implemented here, where the turbine is connected with the compressor impeller with the rotating shaft as seen in the image below. Here for the turbine and compressor inputs, we have a turbine map and compressor which is a contour plot of pressure ratio v/s Mass flow rate. This turbine and compressor map data consists of parameters like Rotational speed, Mass flow rate, Pressure Ratio and efficiency.
Now comparison the results and see what happen to the performance of the engine when a turbocharger is connected to it.
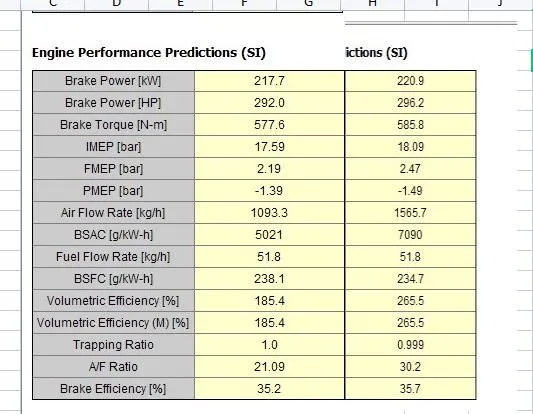
from above table we can clearly see that the overall engine performance is improved by adding the turbocharger to the engine system.
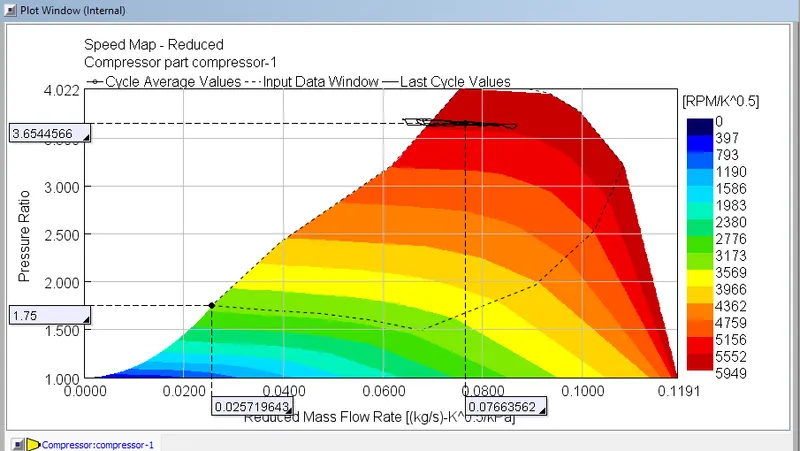
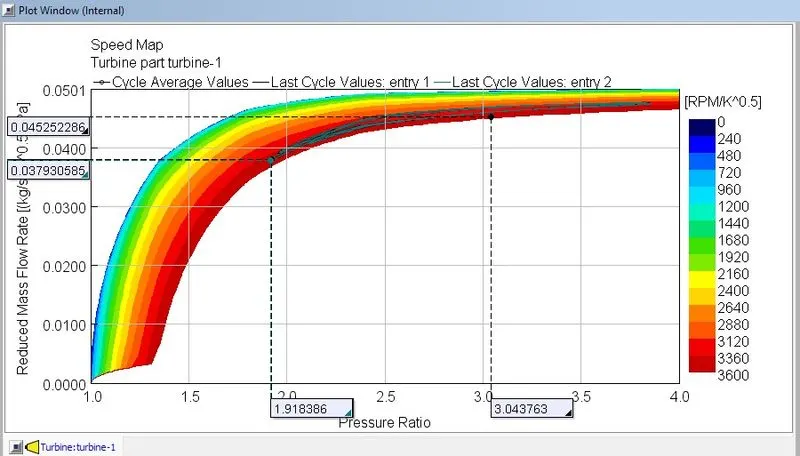
Q:- Plot operating points on compressor and turbine maps?
On compressor graph Mass flow rate of air is on X axis and pressure ratio is on Y axis. Curve line along X axis are speed line and Curve line along Y axis are Efficiency lines. As shown Below three Points represent in best Efficiency range. So turbocharger should run in best efficiency range on Graph.
Compressor Data are given below
Mass flow, Pressure ratio, Speed and efficiency
Turbine Data are given below
Mass flow, Pressure ratio, Speed and efficiency
Q:- In which application Variable Geometry Turbine is benificial?
VGT is mostly used in Commercial vehicles which overcome Turbo lagging problem. So when vehicle start it run at lower RPM, VGT by changing position of blade provide design boost pressure to engine and doesn't lag. Therefore it is mostly used into commercial vehicles like cars, buses and trucks. It also benificial at higher altitude and give best results.
- High A/F ratio anad high peak torque at low engine speed.
- Prevent over-boosting at high engine speed.
- Reduce exhaust gas emissions and improve the fuel economy.
- Improve response time of the turbocharger during transient engine operations.
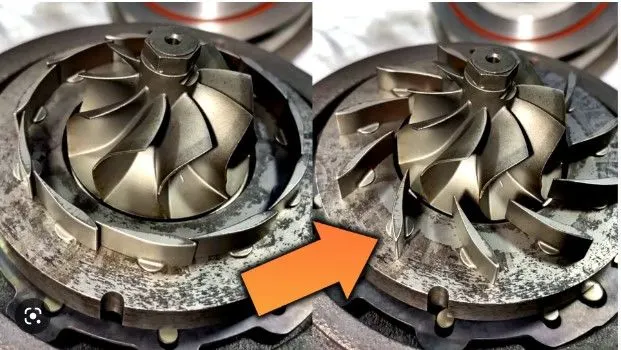
Q:- Explore example- Diesel VGT EGR and understand the modeling part.
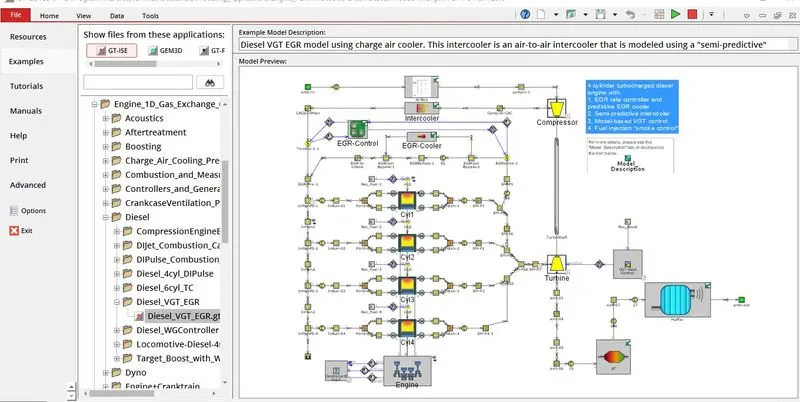
This model contain EGR, VGT,intercooler, injection limiting, boost control and exhaust after treatment device modeling.
The layout represents a 4 cylinders, 16 valve direct injection diesel engine VGT with EGR, air enter at ambient conditions passes through air box and goes into compressor which run through shaft on which turbine is mounted. Turbine runs through the kinetic energy of exhaust gases. Compressed air passes through the intercooler which decreases temperature of air to increase density and goes into inlet manifold. Exhaust gas is cooled into EGR cooler and mixing of exhaust into inlet air is controlled by EGR valve.
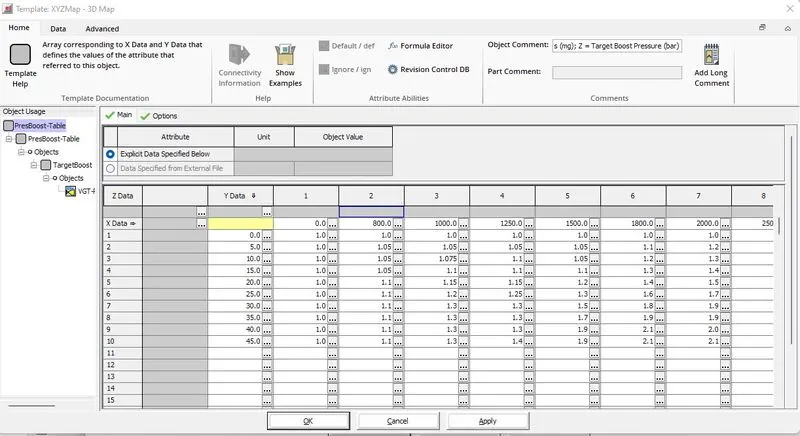
There is VGT rack controller which controls blade positions and vary the speed of turbine and hence boost pressure and target BMEP into the cylinder.
VGT require varying rack positions and also different turbine maps for respective rack position. This technology helps to reduce the turbolag, and allow the engine to perform more better at every operating ranges.
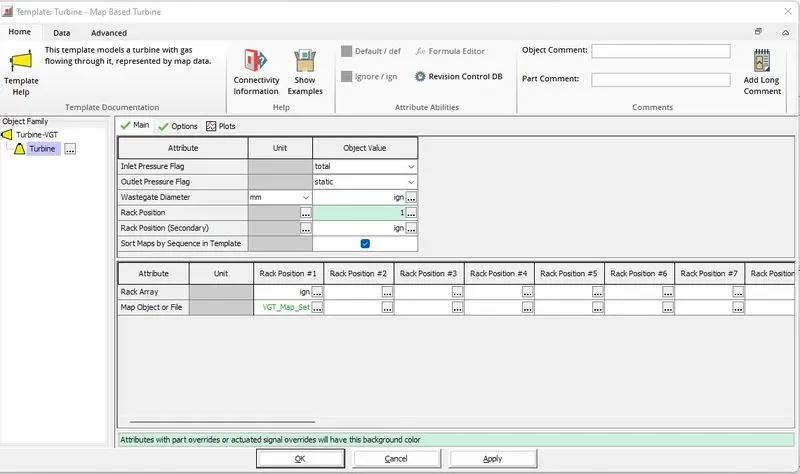
The below map shows the different maps for different rack position
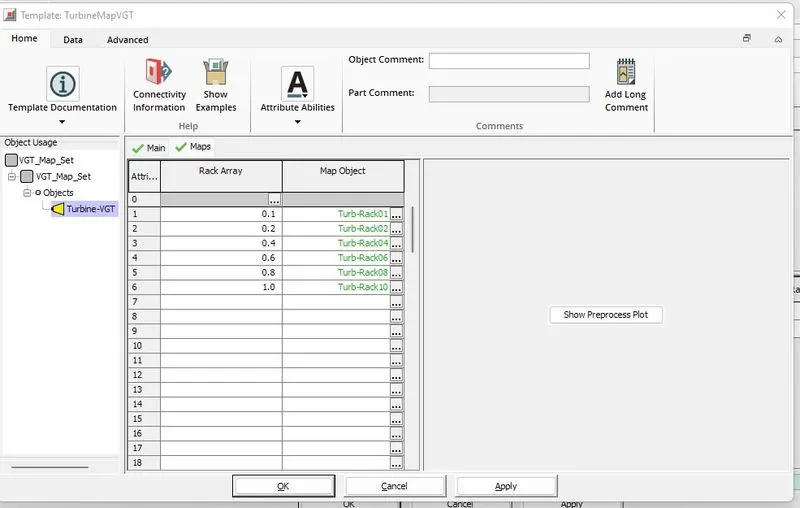
VGT RACK CONTROL:
It represents RLT graph in which x axis is Engine speed and y axis is fuel injection quantity. Rest table represent boost pressure and blade opening is done according to it.
Working of VGT EGR
- This is a 4 cylinder and 16 valve engine with EGR cooler and VGT.
- The ambient air is sucked through the inlet and then the air is passed through the air filters where dirty air and dust particles can be purified and pure air passed into the compressor from compressor the compressed air is passes through the Intercooler.
- In the intercooler the temperature of the air is decreases and increases in the density of the air and thus we will have higher airflow rate than the flow rate of the Ambient air.
- The air from Intercooler passed through the throttle valve where air is passed through this if the throttle valve open means the drive inputs is 90 and if the throttle valve Close means the drive inputs is 0.
- From the throttle valve the air is passed through the two inlet ports into cylinder where combustion takes places during the Power stroke.
- During the exhaust Stroke the exhaust gases and air passes through the exhaust manifold from the exhaust manifold some of the air went to the turbine and some of air went through the Exhaust Gas Recirculation (EGR) in order to reduce the emissions of the NoX.
- The turbine and Compressor are connected to the single shaft from the turbine the air is passed through the wall flow filter (where the diesel and Gasoline particles filters) from there it passes through the Muffler and gases went into atmosphere through it