Week 6 Fuel cell powered vehicle model
AIM: Make a MATLAB model of a fuel cell-powered electric vehicle and comment on results.
Fuel Cell:-
A fuel cell is an electrochemical cell that converts the chemical energy of a fuel (often hydrogen) and an oxidizing agent (often oxygen) into electricity through a pair of redox reactions.
Fuel cells are the greatest energy-efficient devices for removing power from fuels. Hydrogen is an adaptable energy carrier that can be used to power approximately every fuel cell vehicle. Fuel cell electric vehicles use a force arrangement comparable to that of electric vehicles, where energy stored as hydrogen is converted to electricity by the fuel cell. Fuel cell electric vehicles are powered with pure hydrogen gas stored in a tank on the vehicle.
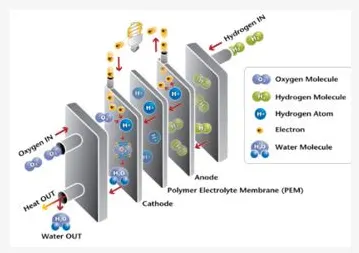
The most common type of fuel cell for vehicle applications is the polymer electrolyte membrane (PEM) fuel cell. In a PEM fuel cell, an electrolyte membrane is sandwiched between a positive electrode (cathode) and a negative electrode (anode). Hydrogen is introduced to the anode, and oxygen (from air) is introduced to the cathode. The hydrogen molecules break apart into protons and electrons due to an electrochemical reaction in the fuel cell catalyst. Protons then travel through the membrane to the cathode.
The electrons are forced to travel through an external circuit to perform work (providing power to the electric car) then recombine with the protons on the cathode side, where the protons, electrons, and oxygen molecules combine to form water.
The first commercially produced hydrogen fuel cell automobile, the Hyundai Tucson FCEV, was introduced in 2013, Toyota Mirai followed in 2015 and then Honda entered the market. Fuel cells are being developed and tested in trucks, buses, boats, motorcycles and bicycles, among other kinds of vehicles.
Few Example of Fuel Cell Cars

2015 Toyota Mirai

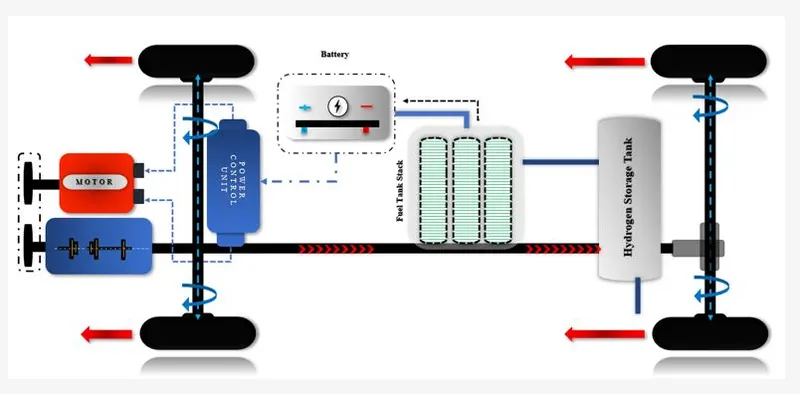
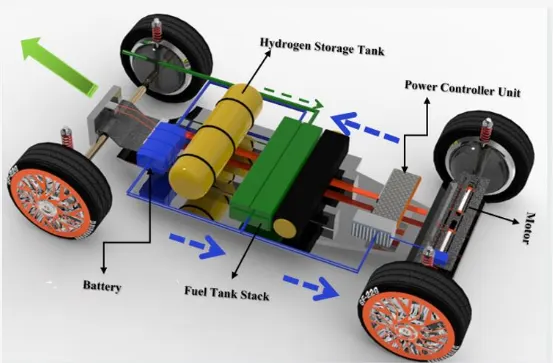
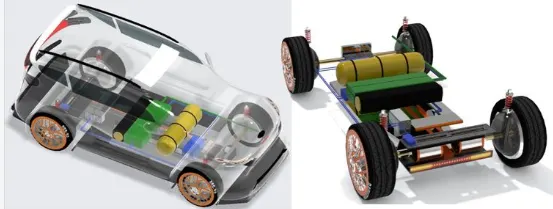
A basic Diagram of Fuel Cell Car is as given below with their main components:
- Motor
- Battery
- Power Controller Unit
- Fuel Tank Stack
- Hydrogen Storage Tank
6 kW 45 Vdc Fuel Cell Stack:
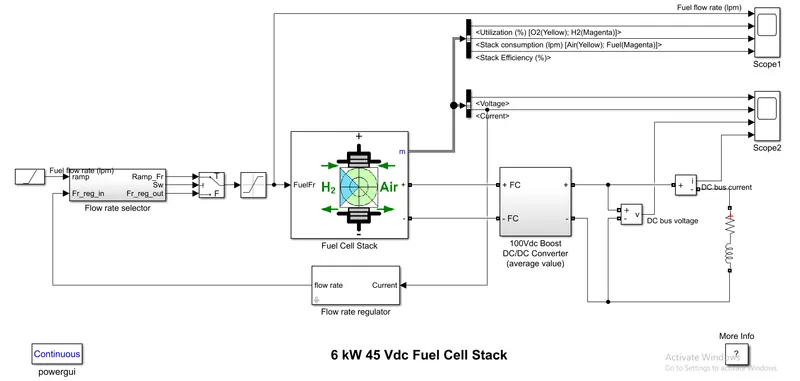
Important Block used in 6 kW 45 Vdc Fuel Cell Stack:
1) Fuel cell stack:
The Fuel Cell Stack block implements a generic model parameterized to represent the most popular types of fuel cell stacks fed with hydrogen and air.The block represents two versions of the stack model: a simplified model and a detailed model. You can switch between the two models by selecting the level in the mask under the Model detail level in the block dialog box.
This model is based on the equivalent circuit of a fuel cell stack shown below:
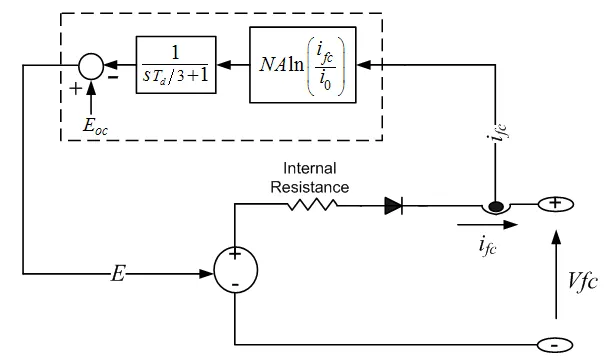
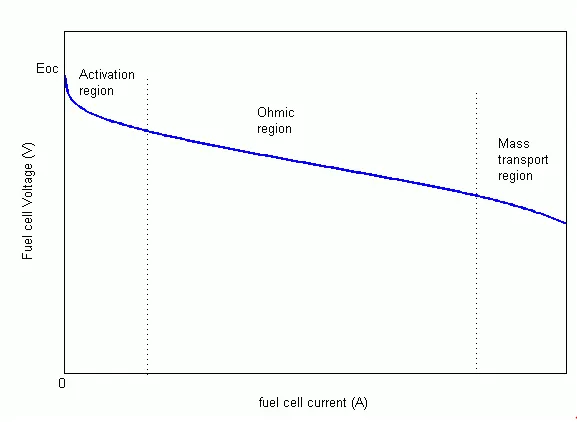
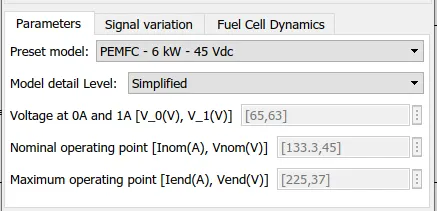
The simplified model represents a particular fuel cell stack operating at nominal conditions of temperature and pressure. The parameters of the equivalent circuit can be modified based on the polarization curve obtained from the manufacturer datasheet. You just have to input in the mask the value of the voltage at 0 and 1 A, the nominal and the maximum operating points, for the parameters to be calculated. A diode is used to prevent the flow of negative current into the stack. A typical polarization curve consists of three regions:
100Vdc Boost DC/DC Converter :
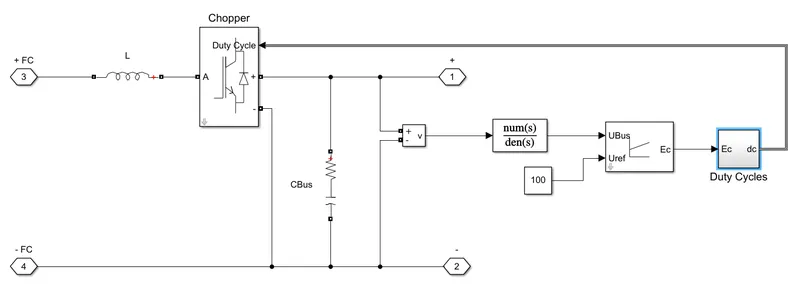
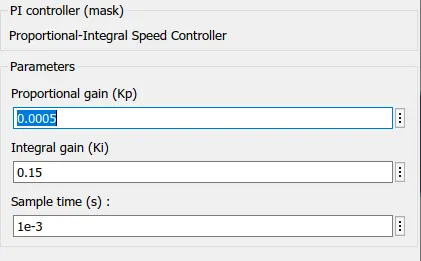
PI converter:
Flow rate regulator:
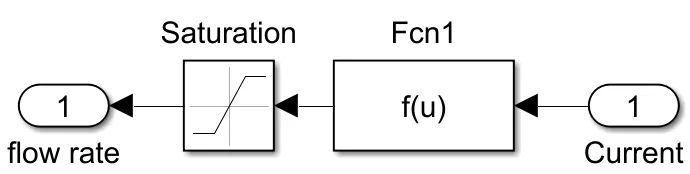
TF: 60000*8.3145*(273+T)*Nc*u(1)/(2*96485*(Pf*101325)*Uf_H2/100*x/100)
Flow rate selector:
Ramp:
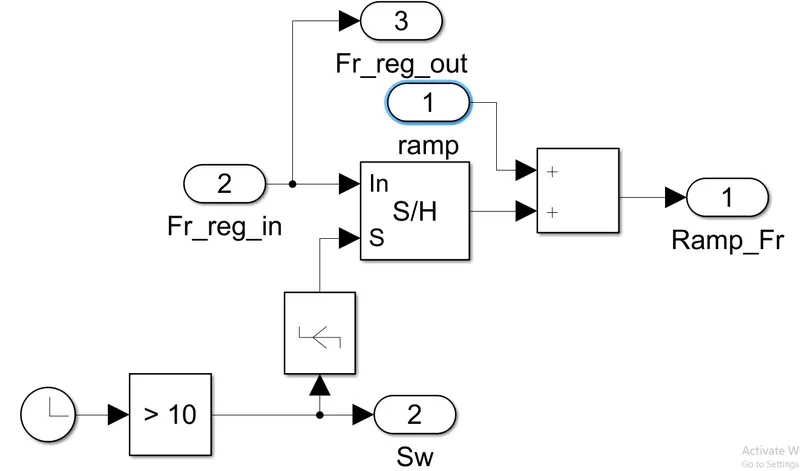
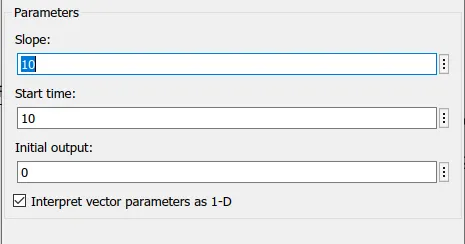
The Ramp block generates a signal that starts at a specified time and value and changes by a specified rate. The block's Slope, Start Time, and Initial output parameters determine the characteristics of the output signal. All must have the same dimensions after scalar expansion.
Saturation:
The Saturation block produces an output signal that is the value of the input signal bounded to the upper and lower saturation values. The upper and lower limits are specified by the parameters Upper limit and Lower limit.
RLC load:
The Series RLC Branch block implements a single resistor, inductor, or capacitor, or a series combination of these. Use the Branch type parameter to select elements you want to include in the branch. Negative values are allowed for resistance, inductance, and capacitance.
Now we run the model on the following values:
Fule stack :
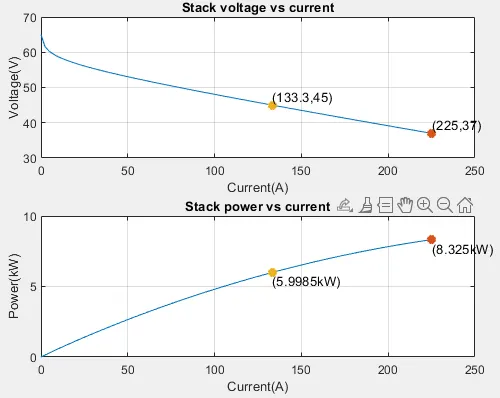
V-I characteristics:
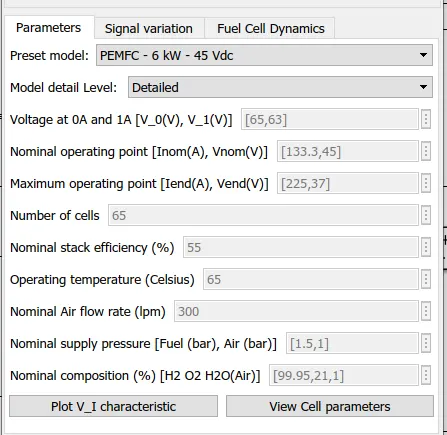
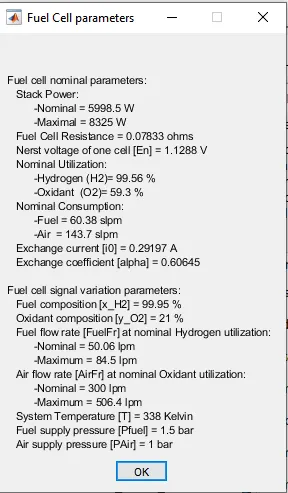
Fuel Cell Parameters:
Ramp:
Saturation:

RESULT:
PEMFC- 6KW – 45 Vdc
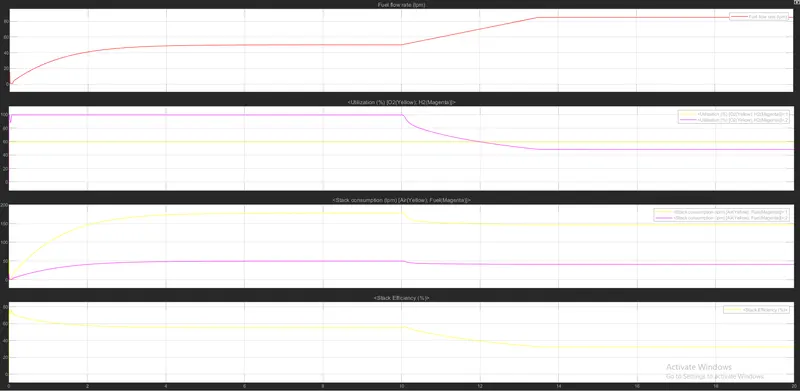
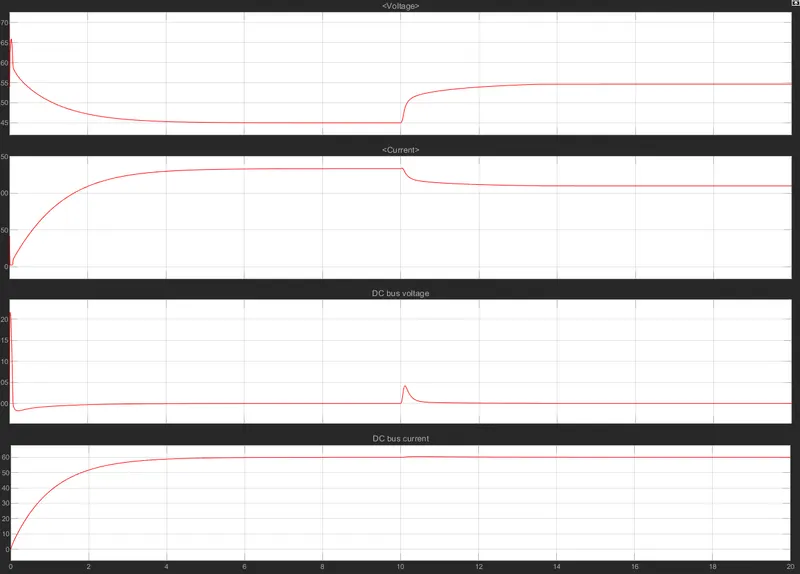
So here we observe that the fuel flow rate is changing 10.007s (1) to 15.000s (2) and the difference is 4.993s it is the absolute value of the time (x-axis) difference between cursor number 1 and cursor number 2.
Voltage and current:
Now we will change the Parameters like the Upper limit of saturation and the Fuel cell stack is changed from Detailed to simplified:
Fuel stack:
Saturation:

Take the result:

Voltage and current:
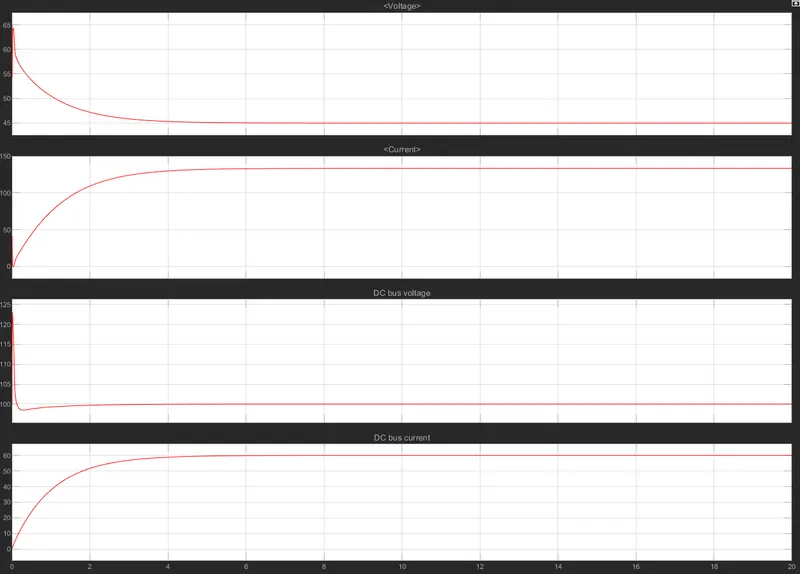
- we notice that the voltage and current are also changing from 10.020 s (1) to 10.805 s (2) and the difference is 784.574 ms it is the absolute value of the time (x-axis) difference between cursor number 1 and cursor number 2.
- So, we can see that the average amount of time required for each rising edge to cross from the lower-reference level to the upper-reference level is 21.226 ms and it is Rise time.
- The average slope of each rising-edge transition line within the upper- and lower-per cent reference levels in the displayed portion of the input signal is 407.184 s and it is a positive Slew rate.
- Total number of negative-polarity or falling edges counted within the displayed portion of the input signal is 2.
- The average amount of time required for each falling edge to cross from the upper-reference level to the lower-reference level is 101.493 ms.
- The DC bus voltage (Scope2) which is very well regulated by the converter. The peak voltage of 122Vdc at the beginning of the simulation is caused by the transient state of the voltage regulator.
How actually result in work
At t = 0 s, the DC/DC converter applies 100Vdc to the RL load (the initial current of the load is 0A). The fuel utilization is set to the nominal value of 99.56%. The current increases to the value of 133A. The flow rate is automatically set in order to maintain the nominal fuel utilization.
At t = 10 s, the fuel flow rate is increased from 50 litres per minute (lpm) to 85 lpm during 3.5 s reducing by doing so the hydrogen utilization. This causes an increase of the Nernst voltage so the fuel cell current will decrease. Therefore, the stack consumption and efficiency will decrease (Scope1).