Week 6 Fuel cell powered vehicle model
AIM:
To make a MATLAB model of fuel cell powered electric vehicle and to comment on the results.
DESCRIPTION:
Matlab Model:
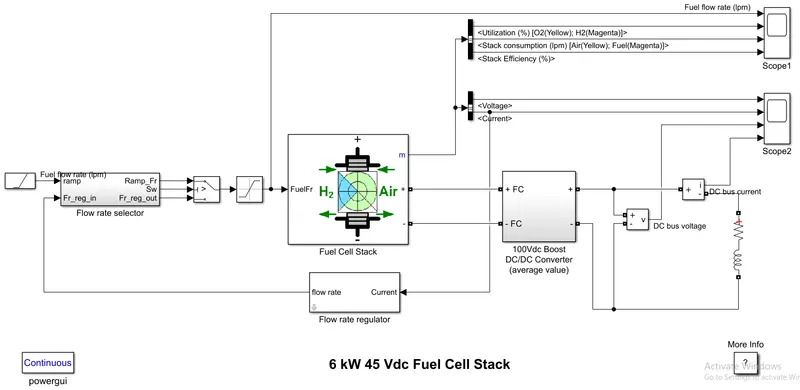
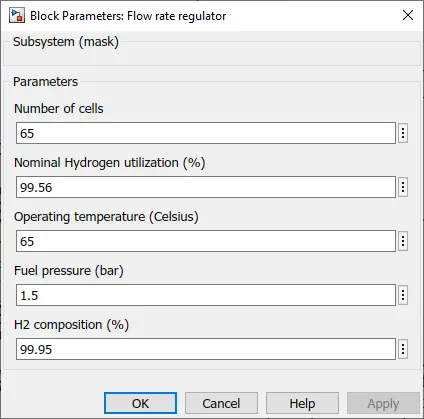
The nominal Fuel Cell Stack voltage is 45Vdc and the nominal power is 6kW. The converter is loaded by an RL element of 6kW with a time constant of 1 sec. During the first 10 secs, the utilization of the hydrogen is constant to the nominal value (Uf_H2 = 99.56%) using a fuel flow rate regulator. After 10 secs, the flow rate regulator is bypassed and the rate of fuel is increased to the maximum value of 85 lpm in order to observe the variation in the stack voltage. That will affect the stack efficiency, the fuel consumption and the air consumption. Fuel cell voltage, current, DC/DC converter voltage and DC/DC converter current signals are available on the Scope2. Fuel flow rate, Hydrogen and oxygen utilization, fuel and air consumption, and efficiency are available on the Scope1.
Blocks used:
- Ramp
- Flow rate selector subsystem
- Switch
- Saturation
- Fuel cell stack subsystem
- Flow rate regulator
- Boost Converter
- DC bus voltage
- Dc bus current
- Series RLC branch
Ramp:
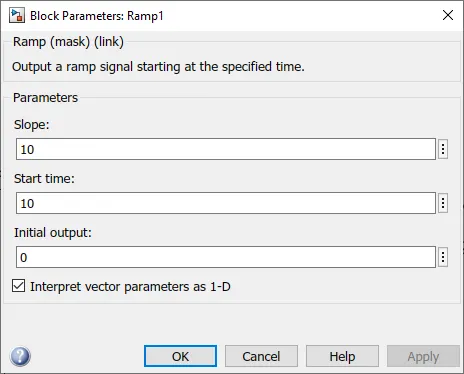
The Ramp block generates a signal that starts at a specified time and value and changes by a specified rate. The block's Slope, Start time, and Initial output parameters determine the characteristics of the output signal. All must have the same dimensions after scalar expansion.
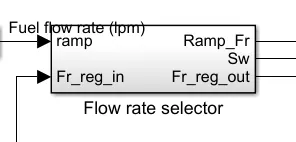
Flow rate selector subsystem:
The system inside the subsystem is attached below:
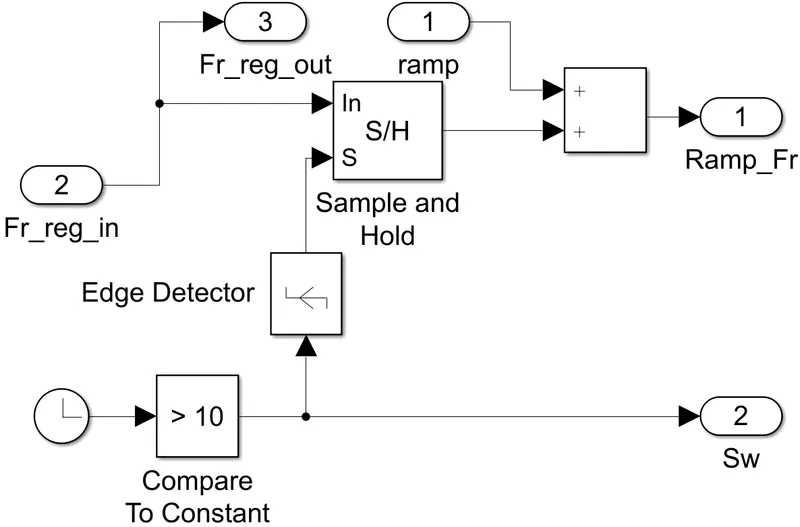
- The clock block allows the output based on the simulation time. Thus the Compare to Constant block compares the value given as input to the constant assigned in the parameters. And let it as a output.
- And the output from the compare to constant block is given as input to the Edge Detector block which compare present input value (Boolean 1/0) to previous value to detect a change (signal edge). The output is a needle impulse (boolean 1) signal when the specified edge type (Rising, Falling, or Either) is detected.
- And then comes the Sample and Hold block, this holds the input ln unelse and until the input S is TRUE. If S is True then it alloes the input ln to pass through it.
- If input S is FALSE then it is given as output Fr_reg_out.
Switch:

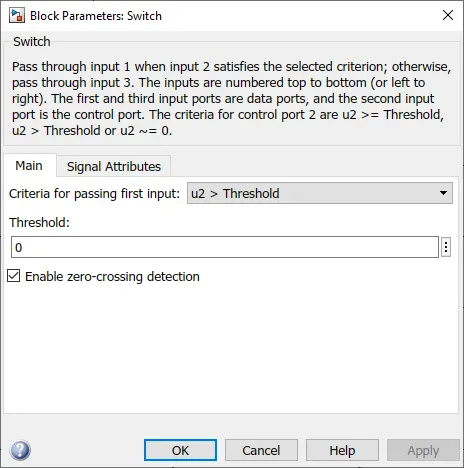
Thus here if u2 (input) passes the condition it is set to pass through the switch. Here the condition is u2>Threshold. And the threshold value is 0. So the if the input value is greater than zero, then it is set to go thorught the switch.
Saturation:

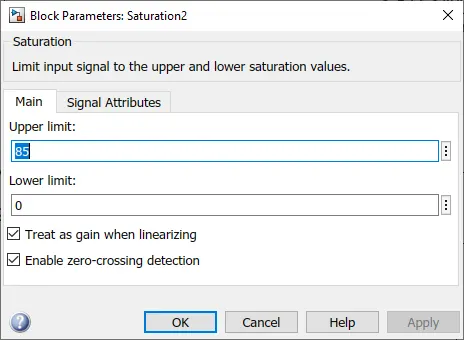
Here the values are to be between 0 to 85, Limits are mentioned in the the upper and lower limit in the parameter dialogue box.
Fuel Cell Stack:
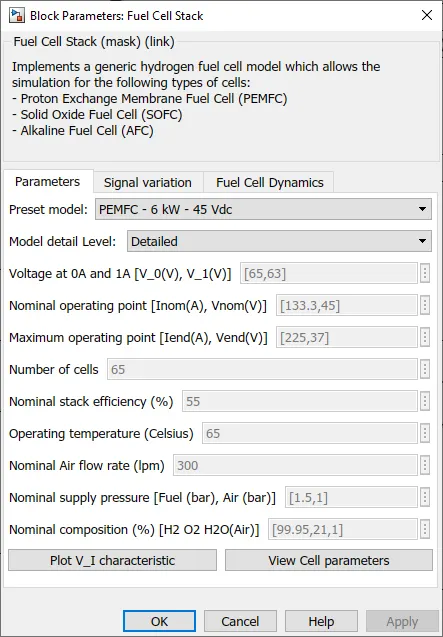
The Fuel Cell Stack block implements a generic model parameterized to represent most popular types of fuel cell stacks fed with hydrogen and air. The block represents two versions of the stack model: a simplified model and a detailed model. You can switch between the two models by selecting the level in the mask under model detail level in the block dialog box.
Flow Rate Regulator:

Here tin the saturation block have set the limitis from 0 to infinity.
Series RLC Branch:
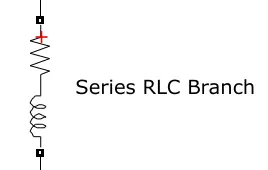
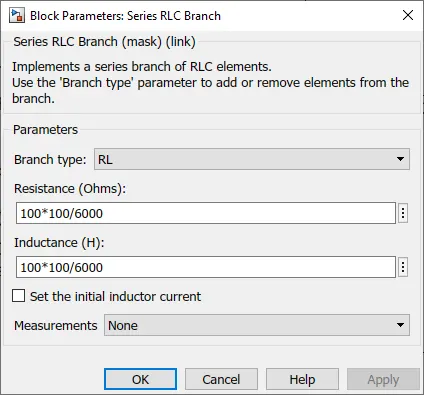
Resistance and Inductance values are given from this series RLC Branch.
DC Bus Current:
Ideal current measurement. The Output signal parameter is disabled when the block is not used in a phasor simulation. The phasor simulation is activated by a Powergui block placed in the model.
DC Bus Voltage:
Ideal voltage measurement. The Output signal parameter is disabled when the block is not used in a phasor simulation. The phasor simulation is activated by a Powergui block placed in the model.
These two measurement blocks are connected to the Boost converter.
Bus Selector:
Thorugh this bus slecetor we can select the parameters that should be sent it to the output.
Graphs:
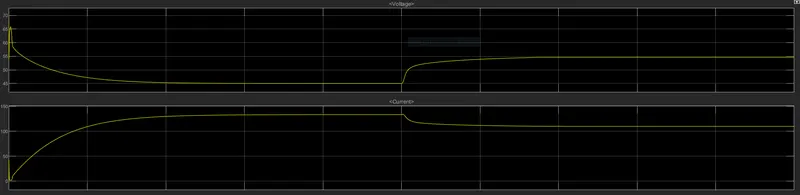
Here are the graphs of Voltage and the current of the fuel cell. The voltage is adjusted to around 45, the moment it has been started, Because it is a RLC circuit it will have a exponential raise in the current, At 10th second the flow rate is increased as the voltage increases due to this the current has been reducing.
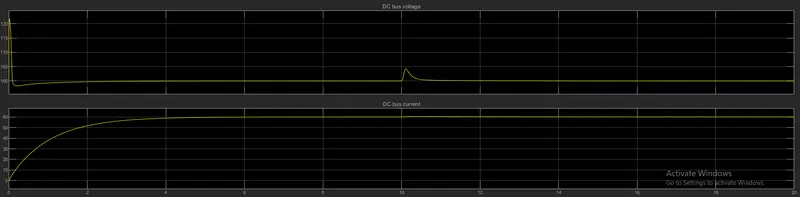
Effect of change of fllow rate in Output voltage, As the load is not going to experience a transient as it invlove a Controlled involved in a DC-DC converter. It will only find a little spike on the curve for this transient. Current is also going to exprience a change but not that much.
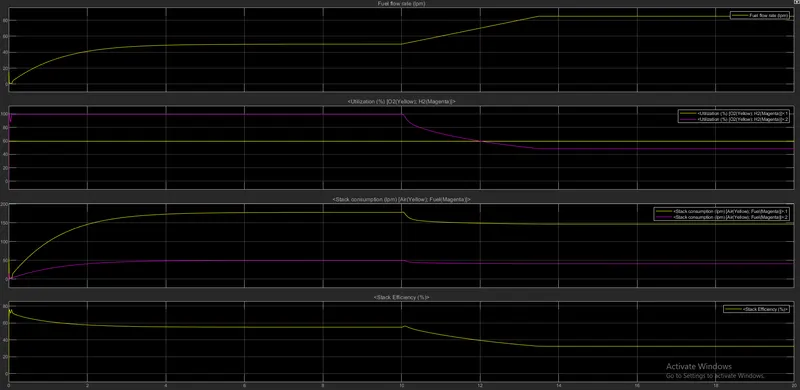
Here in this graph the flow rate is increased from 10th second to 13th second and as the flow rate increases the efficiency decreases and the air and fuel consumptions are also reduces due to the inccrease in the flow rate.
CONCLUSION:
A MATLAB model of fuel cell powered electric vehicle is made and commented on the results.