Week 6 Fuel cell powered vehicle model
Objective:
To create a simulink model of a FCEV and comment on results.
Model:
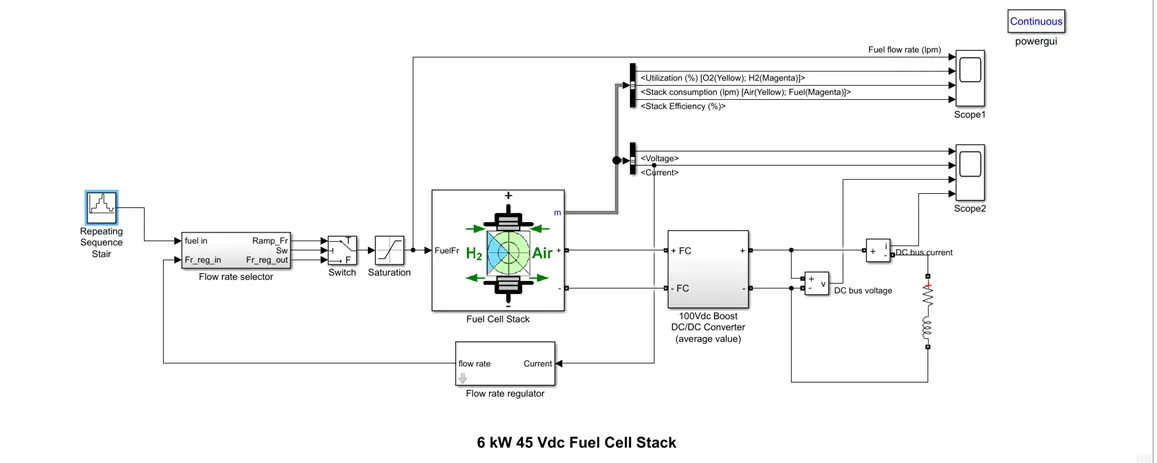
Block diagram given below represents the working of the Fuel Cell Powered Electric Vehicle:
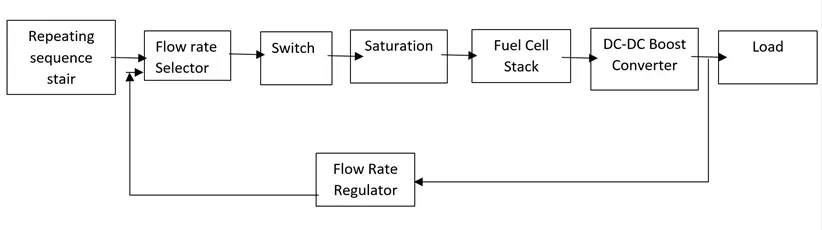
The nominal Fuel Cell Stack voltage is 45Vdc and the nominal power is 6kW. The converter is loaded by an RL element of 6kW with a time constant of 1 sec. During the first 10 secs, the utilization of the hydrogen is constant to the nominal value (Uf_H2 = 99.56%) using a fuel flow rate regulator. After 10 secs, the flow rate regulator is bypassed and the rate of fuel is increased to the maximum value of 85 lpm in order to observe the variation in the stack voltage. That will affect the stack efficiency, the fuel consumption and the air consumption.
Fuel cell voltage, current, DC/DC converter voltage and DC/DC converter current signals are available on the Scope2. Fuel flow rate, Hydrogen and oxygen utilization, fuel and air consumption, and efficiency are available on the Scope1.
At t = 0 s, the DC/DC converter applies 100Vdc to the RL load (the initial current of the load is 0A). The fuel utilization is set to the nominal value of 99.56%. The current increases to the value of 133A. The flow rate is automatically set in order to maintain the nominal fuel utilization. Observe the DC bus voltage (Scope2) which is very well regulated by the converter. The peak voltage of 122Vdc at the beginning of the simulation is caused by the transient state of the voltage regulator.
At t = 10 s, the fuel flow rate is increased from 50 liters per minute (lpm) to 85 lpm during 3.5 s reducing by doing so the hydrogen utilization. This causes an increasing of the Nernst voltage so the fuel cell current will decrease. Therefore the stack consumption and the efficiency will decrease (Scope1).
Steps:
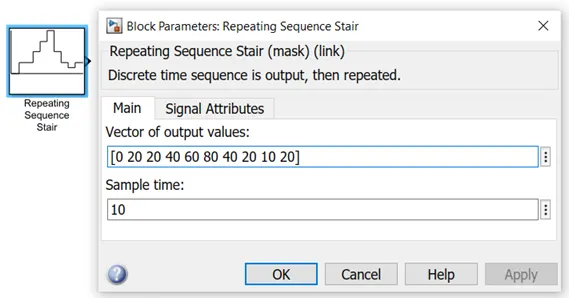
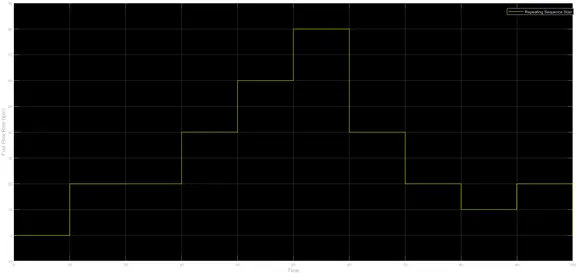
The input which is the fuel flow rate reference is given as the repetitive sequence stair
Here we can see that the vehicle is started, the slowly it is accelerating, after certain time the vehicle is decelerating.
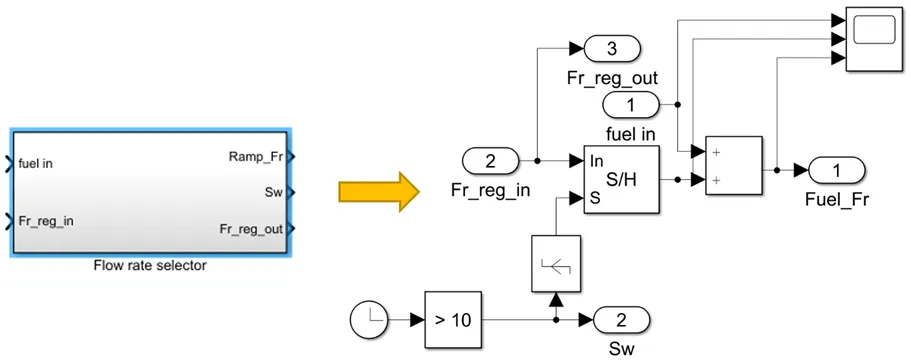
The flow rate selector block:
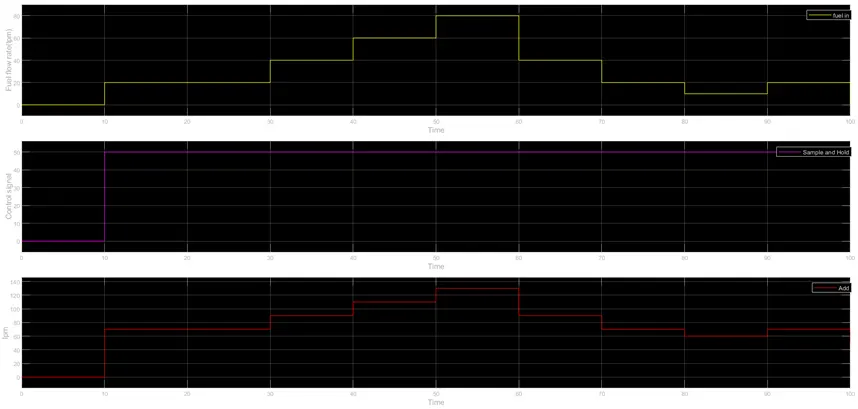
The above graph shows the output from the add circuit. The first figure shows the reference fuel flow rate. The second figure is the output from the sampled and hold circuit. These two signals are added and the output is shown in figure 3.
The output from the flow rate selector block is fed to the switch as input 1. the second input is from the clock circuit which is compared to a constant. the third is directly given from the flow rate regulator output.
Switch:
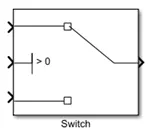
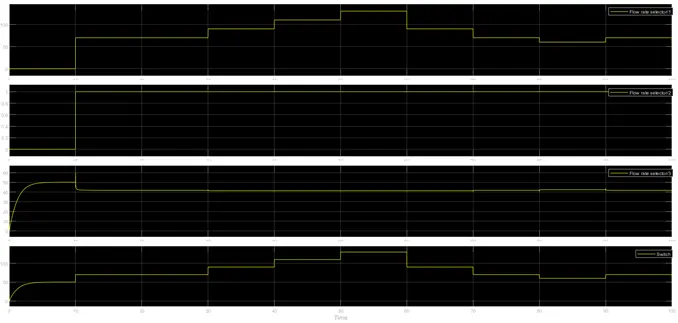
The first 3 are the inputs to the switch and the 4th graph is the output from switch.
Whenever the second input is less than or equal to zero; the output follows input 3 ie till time 10 seconds. After that instant the second input is greater than zero; so the output follows first input.
This output is fed to the saturation block
Saturation Block:
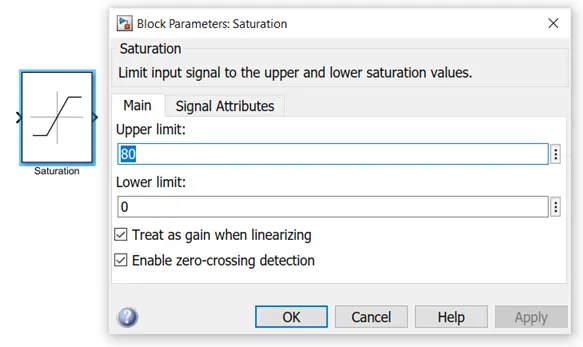
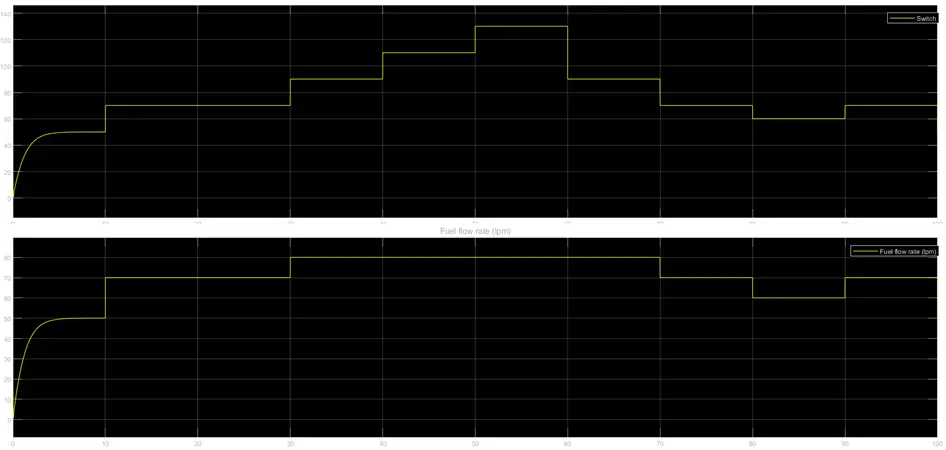
The first figure is the input to the saturation and the second is the output.
The maximum speed value attained during the drive cycle is given as the upper limit value which is 80 m/s here.
So the saturation limits the value to 80
This signal is given to the fuel cell stack
Fuel Cell Stack:
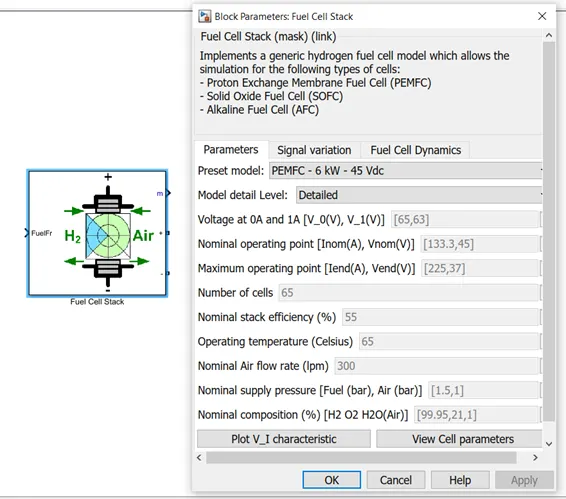
The PEMFC-6kW-45Vdc is selected as the preset model because PEMFC is suitable for HEV drives.
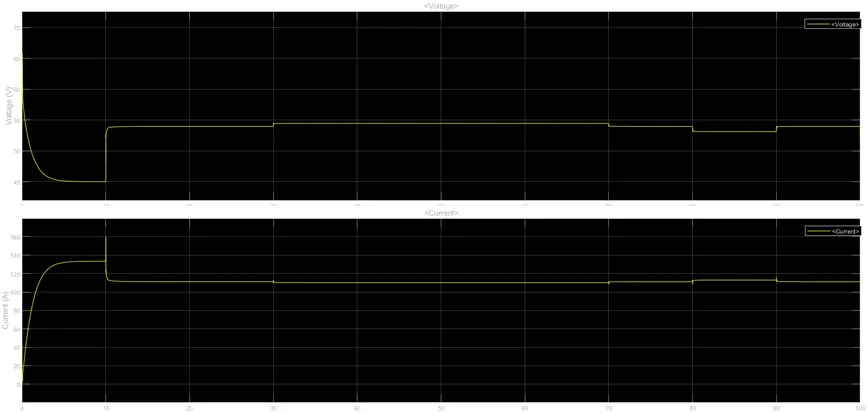
The graph shows the output of the fuel cell.
The initial voltage spike is due to RL load. So it has an exponential fall in voltage due to RL circuit. As well as there is an initial exponential rise in current.
After 10 seconds; the fuel rate is increased for acceleration; as fuel rate increases the voltage increases to 55 V but the current falls to 110A due to inherent properties of fuel stack.
At 30th second; the fuel rate is again increased. We can see a gradual increase in voltage to 55V and small decrease in current.
But further if we try to accelerate as per the input reference; the fuel voltage remains 55V as per the saturation limits
At 70th second; the vehicle is decelerating; ie the fuel flow rate is decreased. So there is a fall in voltage to 54V. at 80th second; the fuel flow rate is again decreased. So the voltage falls to 53 V. the current of the fuel stack rises correspondingly
The current output is given to fuel regulator for regulating the fuel flow rate.
The fuel cell stack is connected to the RL load via 100 V DC-DC boost Converter.
Fuel Rate Regulator:
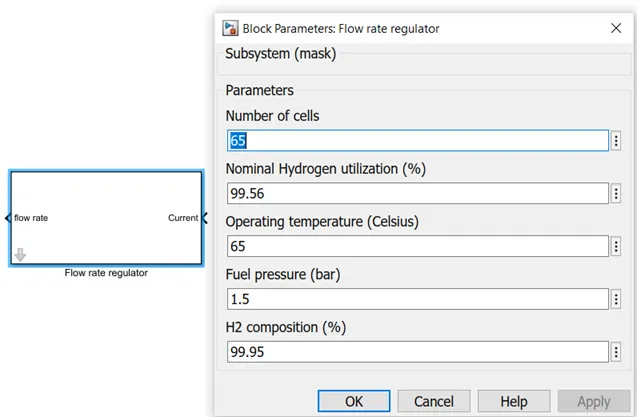
The initial hydrogen utilization is set to 99.56%
As the fuel rate increases or decreses the hydrogen utilization decreases or increases respectively.
DC-DC Boost Converter:
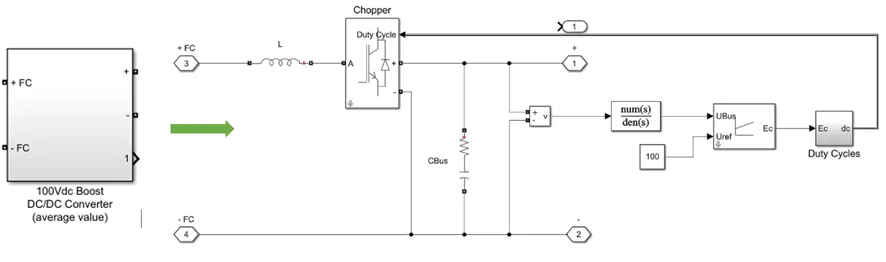
The converter is loaded by an RL element of 6kW with a tinvme constant of 1 sec.
The output of the converter provides a 100V dc to the load.
The complete mathematical model of the Fuel Cell Powered Electric Vehicle is given below:
Analysis:
Fuel cell voltage, current, DC/DC converter voltage and DC/DC converter current signals are available on the Scope2.
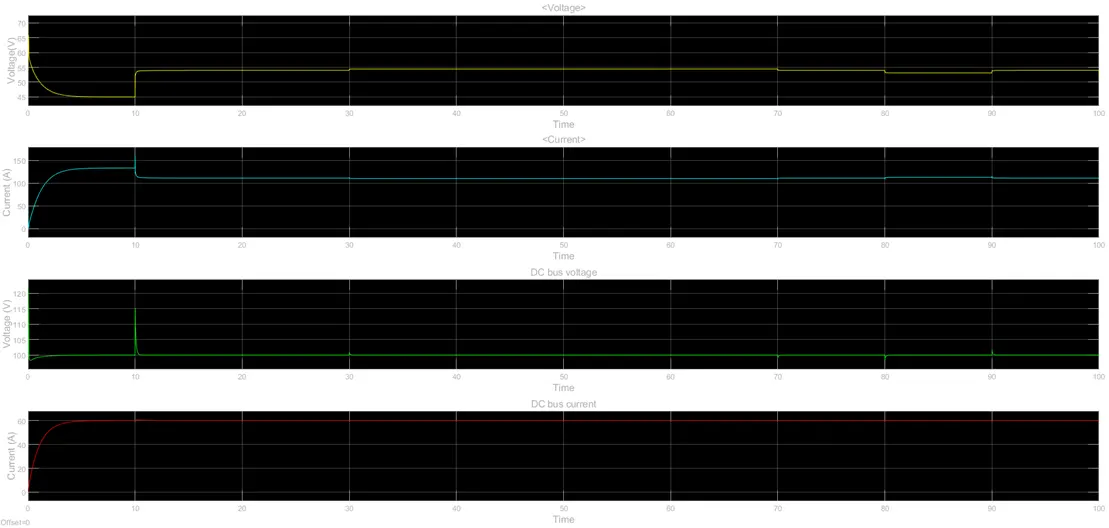
As we have discussed earlier the initial voltage spike is due to RL load. So it has an exponential fall in voltage due to RL circuit. As well as there is an initial exponential rise in current. After 10 seconds; the fuel rate is increased for acceleration; as fuel rate increases the voltage increases to 55 V but the current falls to 110A due to inherent properties of fuel stack. At 30th second; the fuel rate is again increased. We can see a gradual increase in voltage to 55V and small decrease in current. But further if we try to accelerate as per the input reference; the fuel voltage remains 55V as per the saturation limits. At 70th second; the vehicle is decelerating; ie the fuel flow rate is decreased. So there is a fall in voltage to 54V. at 80th second; the fuel flow rate is again decreased. So the voltage falls to 53 V. the current of the fuel stack rises correspondingly. Whatever the change in stack voltage and current the bus dc voltage is maintained to 100V and current to 60 A by dc-dc boost converter. There is a small fluctuation in voltage at 10th sec; nut the dc-dc converter maintains the voltage to 100V.
Fuel flow rate, Hydrogen and oxygen utilization, fuel and air consumption, and efficiency are available on the Scope1.
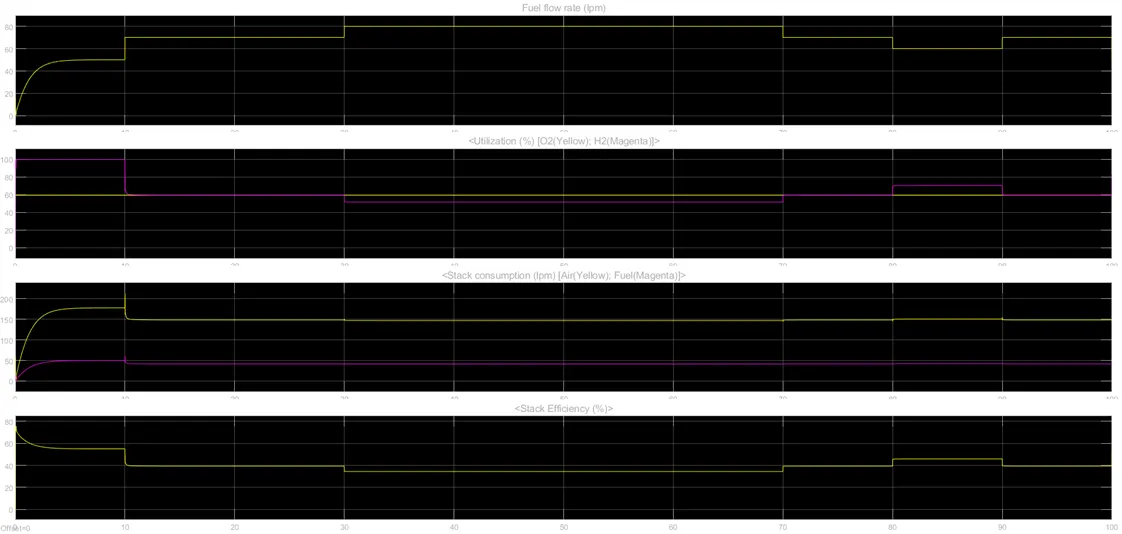
During the first 10 secs, the utilization of the hydrogen is constant to the nominal value (Uf_H2 = 99.56%) using a fuel flow rate regulator. After 10 secs, the flow rate regulator is bypassed and the rate of fuel is increased to the maximum value of 80 lpm during acceleration. We can see that there is a corresponding decrease in the utilization of Hydrogen and decrease in stack consumption and stack efficiency.
After 70 seconds, there is a reduction in the fuel flow rate due to deceleration of vehicle. There we can observe that utilization of hydrogen is increasing. Also the stack consumption and stack efficiency is increasing correspondingly.