Week 6 - Data analysis
Data Analysis using Python
Aim: To create a program for data analysis using Python
Objective:
- To create a tool which can be used for data analysis.
- Calculate the area, power output and specific fuel consumption of engine.
- Explain the code and results.
Theory:
Data analysis is a process of inspecting, cleansing, transforming and modeling data with the goal of discovering useful information, informing conclusions and supporting decision-making. Data analysis has multiple facets and approaches, encompassing diverse techniques under a variety of names, and is used in different business, science, and social science domains. In today's business world, data analysis plays a role in making decisions more scientific and helping businesses operate more effectively.
In this project, data analysis is done on the provided data of an engine. The program is designed in such a way that it can be used as a tool. The data file consists of 17 columns of different thermodynamic parameters for which more than 8000 values have been recorded. The objective is to open the file in the directory, read and extract desired data from the file. The program is further designed to be interactive with the console to seek input from users on opening desired file name, extracting columns to generate plots and save the same in the current directory. The final part of the program allows the user to calculate the Work done per cycle, Power output for specified rpm and Specific Fuel Consumption. The program is also designed to exit gracefully in case an invalid file name is entered for file parsing.
Program:
# A program to create a tool for Data analysis

# Importing libraries
import math
import matplotlib.pyplot as plt
import numpy as np

# File parsing
file = input('Enter file name = ')
if file.endswith('.out'):

	# Creating empty arrays for each column
	crank=[]
	pressure=[]
	max_pressure=[]
	min_pressure=[]
	mean_temp=[]
	min_temp=[]
	max_temp=[]
	volume=[]
	mass=[]
	density=[]
	int_hr=[]
	hr_rate=[]
	Cp=[]
	Cv=[]
	gamma=[]
	kin_vis=[]
	dyn_vis=[]

	# Importing data in arrays
	for line in open('engine_data.out'):
		if '#' not in line:

			# Appending values in empty arrays
			crank.append(float(line.split()[0]))
			pressure.append(float(line.split()[1]))
			max_pressure.append(float(line.split()[2]))
			min_pressure.append(float(line.split()[3]))
			mean_temp.append(float(line.split()[4]))
			min_temp.append(float(line.split()[5]))
			max_temp.append(float(line.split()[6]))
			volume.append(float(line.split()[7]))
			mass.append(float(line.split()[8]))
			density.append(float(line.split()[9]))
			int_hr.append(float(line.split()[10]))
			hr_rate.append(float(line.split()[11]))
			Cp.append(float(line.split()[12]))
			Cv.append(float(line.split()[13]))
			gamma.append(float(line.split()[14]))
			kin_vis.append(float(line.split()[15]))
			dyn_vis.append(float(line.split()[16]))

	# Input
	X = int(input("First column number: "))
	Y = int(input("Second column number: "))

	A1=[]
	c1=1
	for line in open('engine_data.out'):
		if c1 is 3:
			for i in range (0,17):
				A1.append(line.split()[i])
		c1=c1+1

	A2=[]
	c2=1
	for line in open('engine_data.out'):
		if c2 is 4:
			for j in range (0,17):
				A2.append(line.split()[j])
		c2=c2+1

	# For labelling
	plt.xlabel(A1[X]+A2[X])
	plt.ylabel(A1[Y]+A2[Y])
	W = np.array([crank,pressure,max_pressure,min_pressure,mean_temp,min_temp,max_temp,volume,mass,density,int_hr,hr_rate,Cp,Cv,gamma,kin_vis,dyn_vis])
	plt.plot(W[X-1] ,W[Y-1] )
	plt.savefig(str(A1[X])+' vs '+str(A1[Y])+'.png')
	plt.show()

	# Calculating area
	A = np.trapz(pressure,volume)
	print ('Area under P-V diagram is ',A,'M')
	# Calculating power
	P = A*1500/60
	print ('Power output of engine is ',P,'MW')
	# Calculating SFC
	SFC=(20*12.5*3.6*pow(10,-6))/P
	print ('Specific fuel consumption is ',SFC,'g/kWh')

else:
	print ('File not recognized. Please provide a valid CONVERGE output file')

# EndResult:
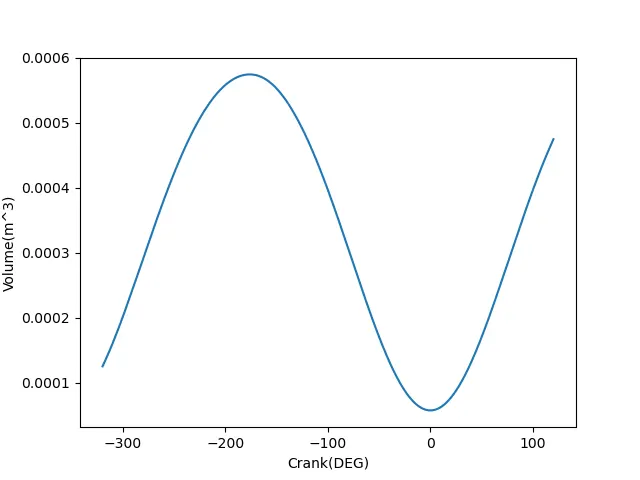
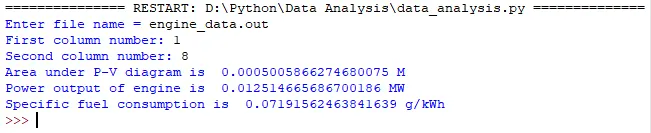
Reference:
https://en.wikipedia.org/wiki/Data_analysis
https://drive.google.com/file/d/1L8GY56d-M8mB1KfceM-xVhGNvnCIqxjm/view