Week 6 - Data analysis
Week 6 - Data analysis
Data parsing or data analysis is the process for inspecting, cleansing, transforming, and modeling data with the goal of discovering useful information, informing conclusions, and supporting decision making. Data analysis has multiple facets and approaches, encompassing diverse techniques under a variety of names, and is used in business, science, and social science domains. In today's business world, data analysis plays a role in making decisions more scientific and helping businesses operate more effectively.
Process of Data Analysis:
Data Requirements - Data collection - Data processing - Data cleaning - Exploratory data analysis.
Coding:
import math
import matplotlib.pyplot as plt
import numpy as np
import sys
# Compatability Check
try :
    open('engine_data.out','r')
except:
    print('File not recognized. Please provide a valid CONVERGE output file')
    sys.exit()
# DATA VISUALIZER
#File parsing
file = 'engine_data.out'
count_rows = 0
count_columns = 0
count_header=0
column_title = []
column_units = []
for line in open(file,'r'):
if '#' not in line:
count_rows = count_rows + 1
count_columns = len(str.split(line))
else:
count_header = count_header +1
if count_header == 3:
for i in range(0,len(str.split(line))):
column_title.append(str.split(line)[i])
elif count_header == 4:
line_content = str.split(line)
for i in range(0,len(str.split(line))):
column_units.append(str.split(line)[i])
print(column_title)
if (count_header < 4 or count_rows < 1 or count_columns < 8):
print('File not recognized. Please provide a valid CONVERGE output file')
else:
#Plotting of given data columns - Change the column numbers to get the desired plot
x = 8
y = 2
x_array=[]
y_array=[]
for k in open(file,'r'):
if '#' not in k:
y_array.append(float(k.split()[y-1]))
x_array.append(float(k.split()[x-1]))
plt.plot(x_array,y_array)
plt.xlabel(column_title[x]+column_units[x])
plt.ylabel(column_title[y]+column_units[y])
plt.savefig(column_title[x] +' VS '+ column_title[y]+'.png')
plt.show()
#Calcualtion for Area under the PV Diagram using trapz command
x = 8
y = 2
pressure=[]
volume=[]
N=1500 #rpm
for k in open(file,'r'):
if '#' not in k:
pressure.append(float(k.split()[y-1]))
volume.append(float(k.split()[x-1]))
area=np.trapz(pressure,volume)
print('Area under PV diagram is',area,'MJ') # Area in MJ
workdone=area*pow(10,6) # Work Done in Nm or Joule
power=2*math.pi*workdone*N/(60*1000) # Power in KWatt
print('Power Output of engine = ',power,'kw')
fuel=20*1e-6 # Fuel in gram - given 20 micro grams fuel/ stroke
sfc=(3600*fuel*N)/(60*power) # Specific Fuel consumption in g/kw.hr
print('SFC=',sfc,'g/kw.hr')
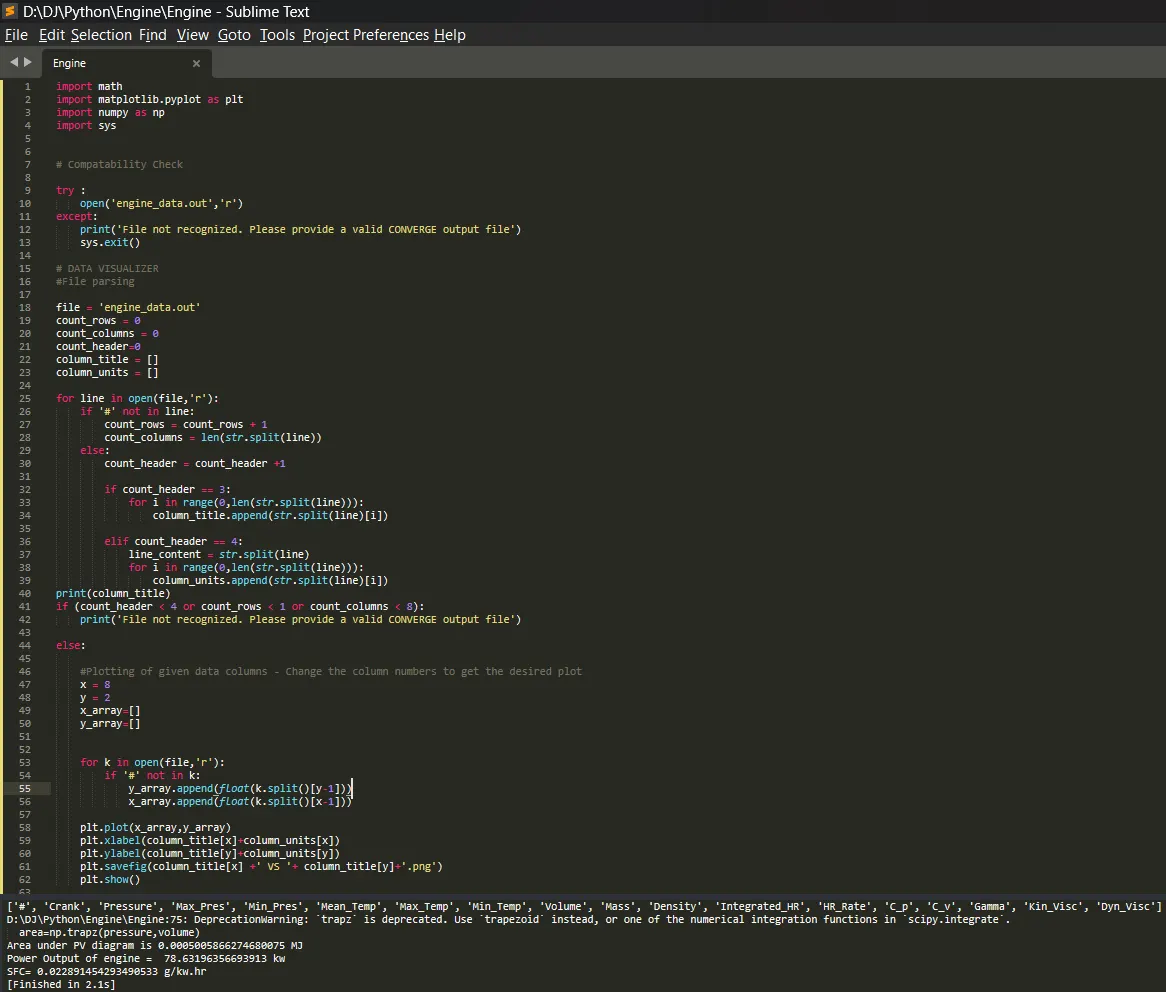
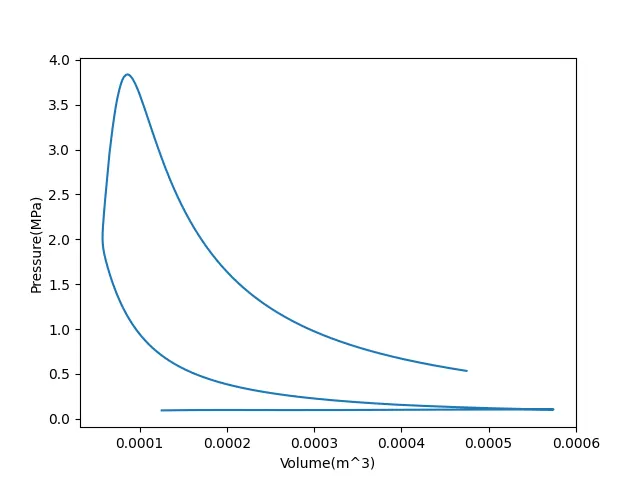
power Output is : 78.6kW
1. Importing Required Libraries
import math
import matplotlib.pyplot as plt
import numpy as np
import sys
- math: Provides mathematical functions.
- matplotlib.pyplot: Used for plotting graphs.
- numpy: Used for numerical operations such as integration.
- sys: Used to handle system-related functionalities like exiting the program in case of errors.
2. Checking File Compatibility
try :
open('engine_data.out','r')
except:
print('File not recognized. Please provide a valid CONVERGE output file')
sys.exit()
- This tries to open the file engine_data.out.
- If the file does not exist, an error message is printed, and the program exits using sys.exit().
3. File Parsing
file = 'engine_data.out'
count_rows = 0
count_columns = 0
count_header = 0
column_title = []
column_units = []
- count_rows: Counts the number of data rows (actual numerical data).
- count_columns: Tracks the number of columns in the data.
- count_header: Counts the number of header lines (lines starting with #).
- column_title: Stores the column names from the third header line.
- column_units: Stores the column units from the fourth header line.
Reading the File Line by Line
for line in open(file,'r'):
    if '#' not in line:
        count_rows += 1
        count_columns = len(str.split(line))
    else:
        count_header += 1
- If the line does not contain #, it's part of the numerical data, so count_rows is incremented.
- If the line contains #, it is a header line, so count_header is incremented.
Extracting Column Titles and Units
if count_header == 3:
    for i in range(0, len(str.split(line))):
        column_title.append(str.split(line)[i])

elif count_header == 4:
    line_content = str.split(line)
    for i in range(0, len(str.split(line))):
        column_units.append(str.split(line)[i])
- If count_header == 3, the third header line is assumed to contain column titles.
- If count_header == 4, the fourth header line is assumed to contain column units.
4. Validating the File Format
if (count_header < 4 or count_rows < 1 or count_columns < 8):
    print('File not recognized. Please provide a valid CONVERGE output file')
- Ensures that the file has at least four header lines, some data rows, and at least 8 columns.
- If these conditions are not met, an error message is displayed.
5. Plotting Data
x = 8  # Column index for x-axis
y = 2  # Column index for y-axis
x_array = []
y_array = []
- The script selects column 8 as the x-axis and column 2 as the y-axis for plotting.
Extracting Data for Plotting
for k in open(file,'r'):
    if '#' not in k:
        y_array.append(float(k.split()[y-1]))
        x_array.append(float(k.split()[x-1]))
- Reads the data file again, skipping headers.
- Extracts values from column 8 (x-axis) and column 2 (y-axis).
- Stores them in x_array and y_array.
Plotting the Graph
plt.plot(x_array, y_array)
plt.xlabel(column_title[x] + column_units[x])
plt.ylabel(column_title[y] + column_units[y])
plt.savefig(column_title[x] + ' VS ' + column_title[y] + '.png')
plt.show()
- Plots the selected data.
- Labels the x and y axes using column_title and column_units.
- Saves the plot as an image.
- Displays the plot.
6. Calculating the Area Under the PV Diagram
x = 8  # Volume
y = 2  # Pressure
pressure = []
volume = []
N = 1500  # Engine speed in RPM
- Column 8 (x) is assumed to represent volume.
- Column 2 (y) is assumed to represent pressure.
- pressure and volume arrays store the corresponding data.
- N = 1500 is the engine speed in revolutions per minute.
Extracting Pressure and Volume Data
for k in open(file,'r'):
    if '#' not in k:
        pressure.append(float(k.split()[y-1]))
        volume.append(float(k.split()[x-1]))
- Reads the data file again, skipping headers.
- Stores pressure and volume values in separate arrays.
Calculating Area Under the PV Curve (Work Done)
area = np.trapz(pressure, volume)
print('Area under PV diagram is', area, 'MJ')  # Area in MJ
- Uses the trapezoidal rule (np.trapz) to integrate pressure vs. volume.
- The area under the PV curve represents work done (in MJ).
7. Calculating Engine Power Output
workdone = area * pow(10, 6)  # Convert MJ to Joules
power = 2 * math.pi * workdone * N / (60 * 1000)  # Convert to kW
print('Power Output of engine = ', power, 'kw')
-
Converts the work done from MJ to Joules.
-
Uses the formula:
to calculate power output in kilowatts (kW).
Converts the work done from MJ to Joules.
Uses the formula:
to calculate power output in kilowatts (kW).
8. Calculating Specific Fuel Consumption (SFC)
fuel = 20 * 1e-6  # Fuel per stroke in grams (20 micrograms)
sfc = (3600 * fuel * N) / (60 * power)  # Specific Fuel Consumption in g/kW.hr
print('SFC=', sfc, 'g/kw.hr')
-
Assumes 20 micrograms of fuel per stroke.
-
Uses the formula:
to calculate specific fuel consumption (SFC) in g/kW.hr.
Assumes 20 micrograms of fuel per stroke.
Uses the formula:
to calculate specific fuel consumption (SFC) in g/kW.hr.