Week 6 - Data analysis
Aim & Objective:
- By using python programming for analyzing the data provided with the challenge.
- Plot the graph as per user inputs
- Do a basic performance calculation for the IC engine with the available data set.
Problem Statement:
Data-science is a wide and new field in engineering and sciences. Data science gives us a vast set of data which needs to be studied for forecasting the future behavior of the data being studied. Thus, writing a program that can do the same with the set of data provided will be simplifying this process for the data scientists.
Formula Used:
The data file given consist of various parameters of an engine. We have to calculate the below parameters
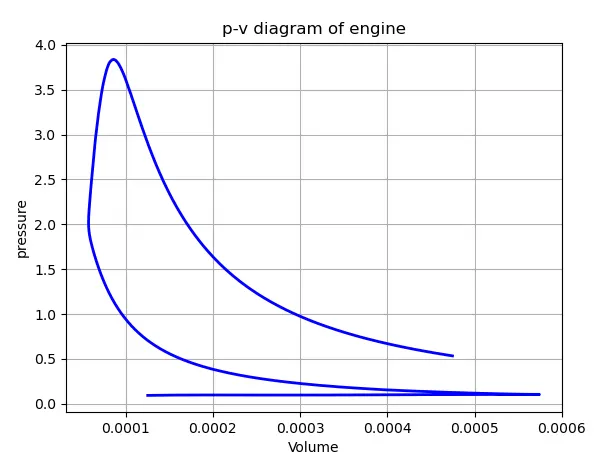
a. Work done by the engine is obtained by calculating the area under the P-V diagram
b. Power output of the engine is given as below
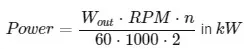
Were, n - Number of cylinders of engine,
RPM - engine speed in minutes,
Wout - Work output by the engine
c. Specific Fuel Consumption (SFC),

SFC = mass of fuel consumption / Engine brake power = FC / Pb
Python Program :
'''
Challenge_6_data Analysis
'''
import math
import matplotlib.pyplot as plt
import numpy as np
from scipy.integrate import simps
# Checking the compatability of file
file_name = input("Enter the filename:") # User input vaiable
if file_name == 'engine_data.out': # using if command checking the file name
print('Selected file is valid') # if user input file name is correct, printing 'valid file'
else:
print('Selected file is invalid') # if user input file name is not correct, printing 'not valid file'
exit()
def compatibility_check(a):
if 'CONVERGE' not in a:
print('File not recognized. Please provide a valid CONVERGE output file')
exit()
else:
print('Compatibility check is successful')
pass
# file parsing
open('engine_data.out') # opening the file
# Basic intialization
line_count = 1
# creating array
pressure = [] # empty array
volume = [] # empty array
# File parsing starts here
for line in open('engine_data.out'):
if '#' not in line:
# spliting the line data using split command
# converting that number from string to floating point number
# Appending the values in empty array
pressure.append(float(line.split()[1]))
volume.append(float(line.split()[7]))
line_count = line_count+1
#plotting p-v diagram
plt.plot(volume,pressure,'b',linewidth=2)
plt.xlabel('Volume')
plt.ylabel('Pressure')
plt.title('p-v diagram of engine')
plt.savefig('p-v diagram of engine')
plt.grid()
plt.show()
# Calculating Work done by engine using simpsons rule from P-V Diagram
area = simps(pressure,Volume)
print('Area under the curve using Simpsons Rule :' +str(area) + ' units')
print('Work done by the engine : ' + str(area) + ' MJ')
area = area * 1e6
print('Work done by engine : ' + str(area) + ' J')
# Calculating the output power by engine using given parameters
rpm = 1500
rps = 1500/60
stroke_cycle = rps/2
# Fuel consumption in micrograms per stroke cycle
fuel_consumption = 20
# Engine specifications
n = 1 # Number of cylinder 4 stroke engine
# Calculation of power output and Specific fuel consumption
power_output = n*area*stroke_cycle/(1000)
print('power output from engine : ' + str(power_output) + 'KW')
SFC = (fuel_consumption*pow(10,-6)*stroke_cycle*3600)/(power_output*1000)
print('Specific Fuel consumption, SFC : ' + str(SFC) + '(kg/hr)/KW')
print('t')
# Calculation of Area under PV diagram
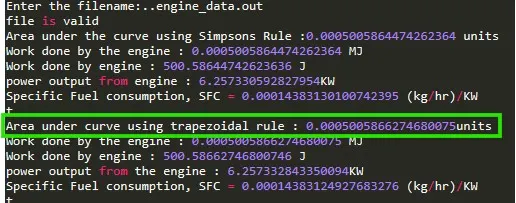
Area = np.trapz(pressure,Volume)
print('Area under curve using trapezoidal rule : ' + str(Area) + 'units')
print('Work done by the engine : ' + str(Area) + ' MJ' )
Area = Area * 1e6
print('Work done by engine : ' + str(Area) + ' J')
power_output = n*Area*stroke_cycle/(1000)
print('power output from the engine : ' + str(power_output) + 'KW')
SFC = (fuel_consumption*pow(10,-6)*stroke_cycle*3600)/(power_output*1000)
print('Specific Fuel consumption, SFC = ' + str(SFC) + ' (kg/hr)/KW')
print('t')
# Transposing columns in to row matrix and converting them in to float type from string type
transpose = np.transpose(data)
float_f = transpose.astype(np.float)
# Array for header and their units
parameters = ['Crank','Pressure','Maximum Pressure','Minimum Pressure','Mean Temperature','Maximum Temperature','Minimum Temperature','Volume','Mass','Density','Integrated HR','HR rate','Cp','Cv','gamma','Kinematic Viscosity','Dynamic Viscosity']
units =['(DEG)','(Mpa)','(Mpa)','(Mpa)','(K)','(K)','(K)','pow(m,3)','(kg)','(kg/(pow(m,3)))','(J)','(J)','(J/time)','(J/kgK)','(J/kgK)','','pow(m,2)/s','(Ns/pow(m,2)']
# Providing user choice of picking 2 parameters for plotting
print('Choose from following options and press enter key')
print('1 Crank \n 2 Pressure \n 3 Maximum Pressure \n 4 Minimum Pressure \n 5 Mean Temperature \n 6 Maximum Temperature \n 7 Minimum Temperature \n 8 Volume \n 9 Mass \n 10 Density \n 11 Integrated HR \n 12 HR rate \n 13 Cp \n 14 Cv \n 15 gamma \n 16 Kinematic Viscosity \n 17 Dynamic Viscosity')
X = int(input('Enter your choice on X-axis: \n'))
Y = int(input('Enter your choice on Y-axis: \n'))
# Plotting the figure based on user choice
plt.figure(1)
plt.plot(float_f[X-1],float_f[Y-1],linewidth=3)
plt.title(' plot for ' + parameters[Y-1]+ ' versus ' +parameters[X-1],color='k')
plt.xlabel(parameters[X-1] + ' ' +units[X-1])
plt.ylabel(parameters[Y-1] + ' ' +units[Y-1])
plt.savefig(parameters[Y-1]+ ' Vs ' + parameters[X-1])
plt.grid()
plt.show()
Python Snaps:
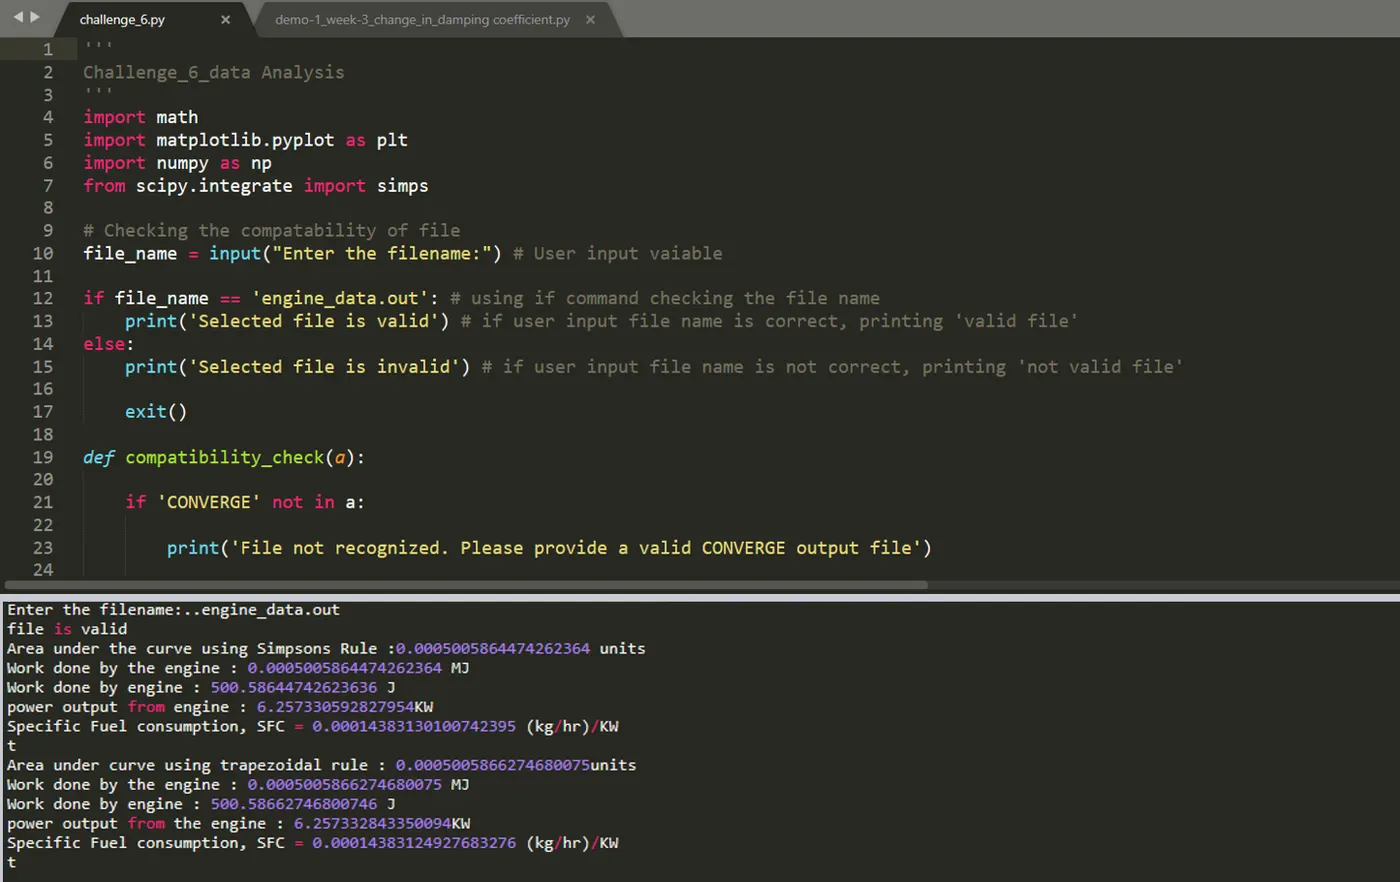
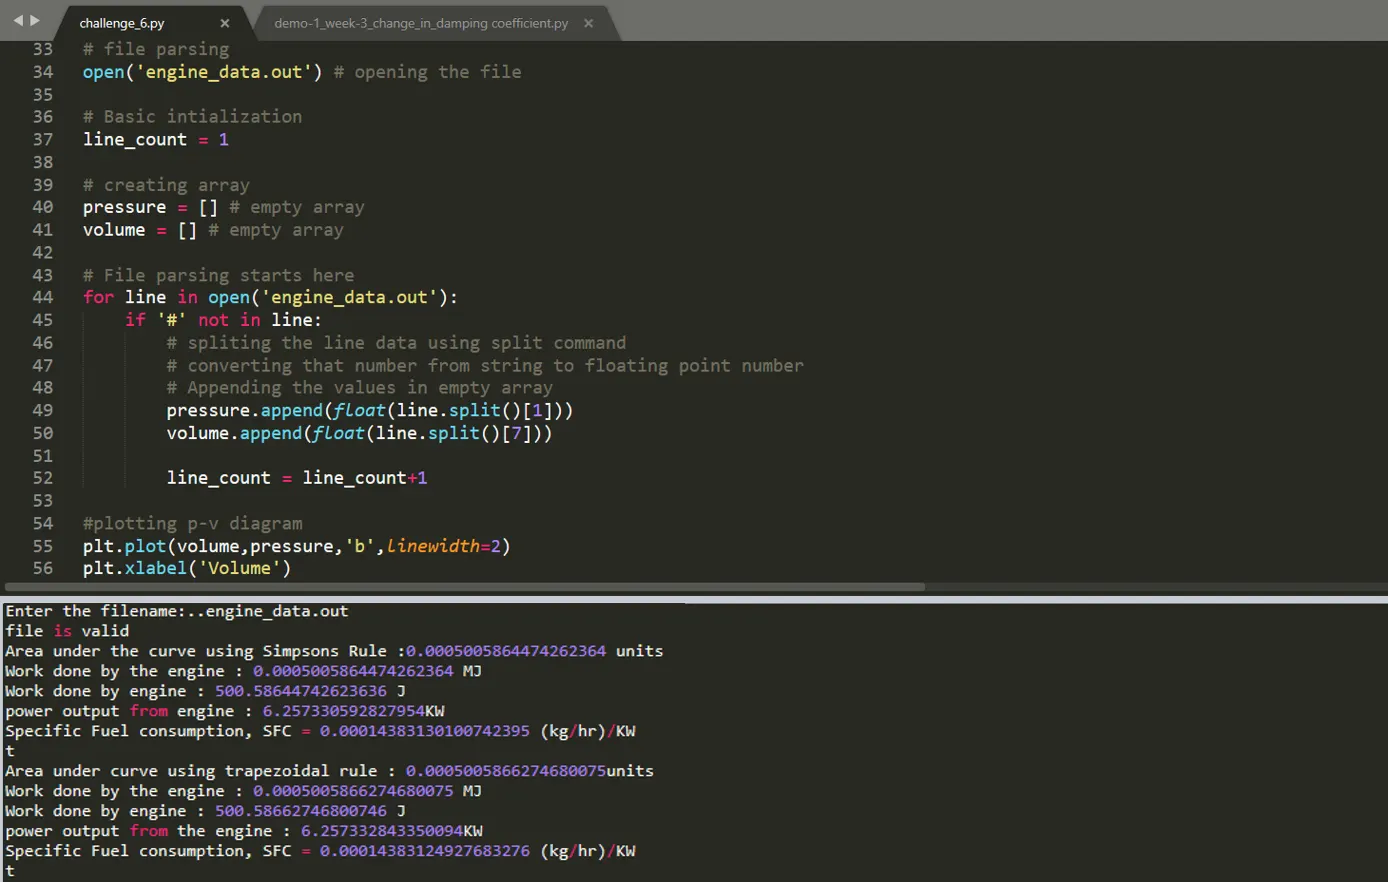
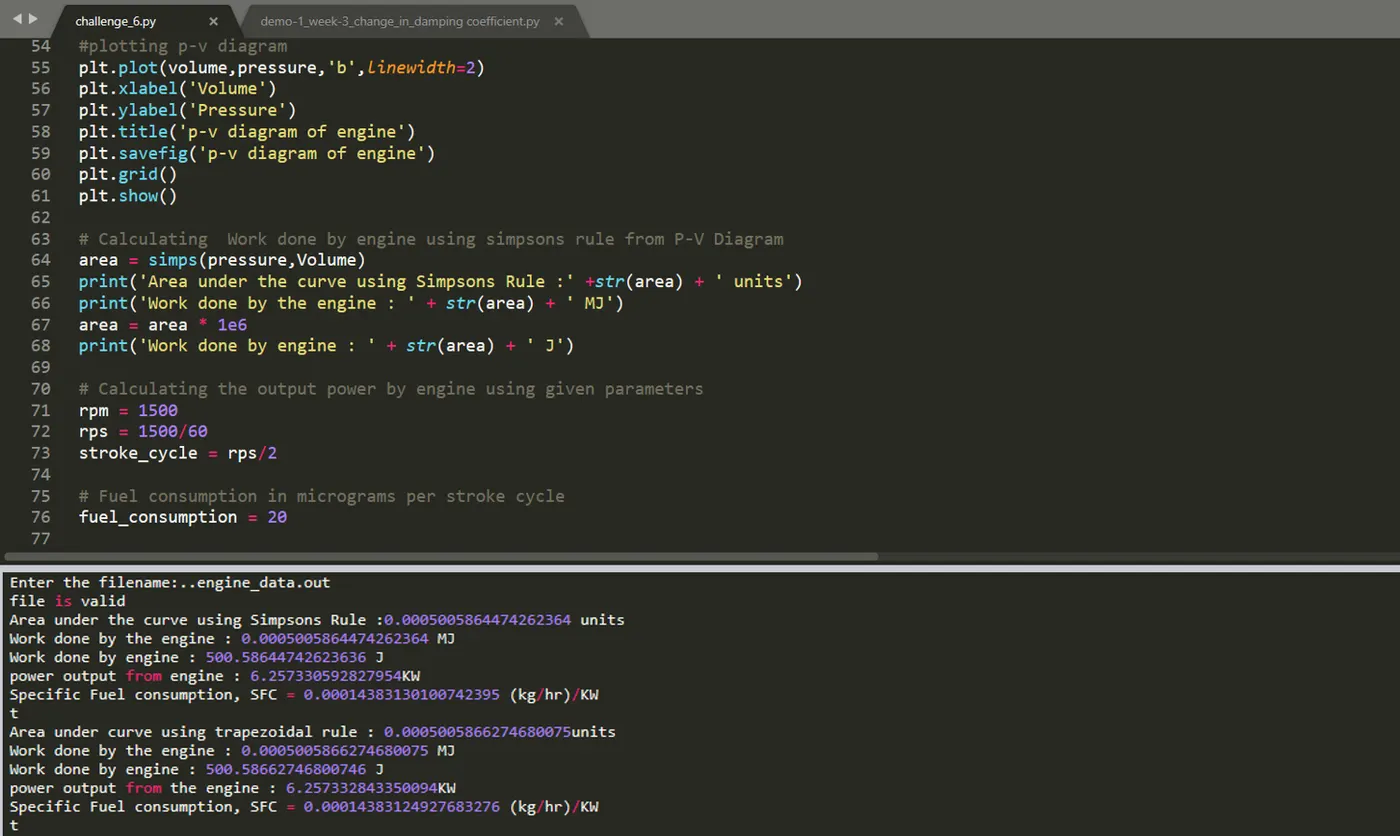
Program Explanation:
- Import the modules such as ‘Math’, ‘matplotlib’, ‘numpy’, ‘scipy’ for performing their respective functions
- For the purpose of plotting the curves between 2 quantities as per the user input, a line counter is initiated from 1. Now an "if" loop is iterated with the condition if '#' not in line all the numerical values present in the data file is now to be stored in the data array as string. Now another "if" loop is executed with the condition that line counter greater than or equal to 6 all the data will be stored in the pressure and volume array respectively.
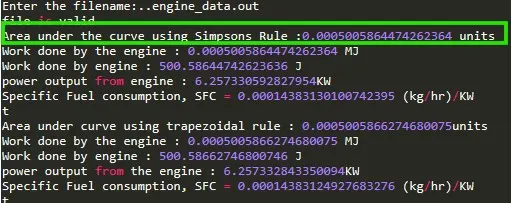
- For Engine performance calculations, the area under the PV diagram has to be calculated and we are using Simpson method for calculating it.
- Two arrays of name of parameters and their units are made as per the data file given and then the user has to choose from them to plot respective graphs. For these 2 inputs of the user are taken using the input command and data type is set as 'int'. The user is entering column number as input and results are generated.
Results:
# PV Diagram of the Engine
# Area under the PV diagram, Power output of the engine and Specific fuel consumption.- Simpson Rule
- Calculate the power output of this engine. Assume that RPM is 1500
- This engine consumed 20 micro grams of fuel (per 1 stroke cycle). Calculate its specific fuel consumption.
# Area under the PV diagram, Power output of the engine and Specific fuel consumption - Trapezoidal Rule
# Auto Extraction of plot using label header
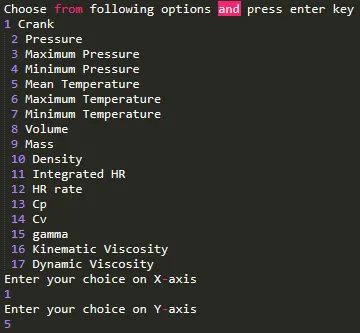
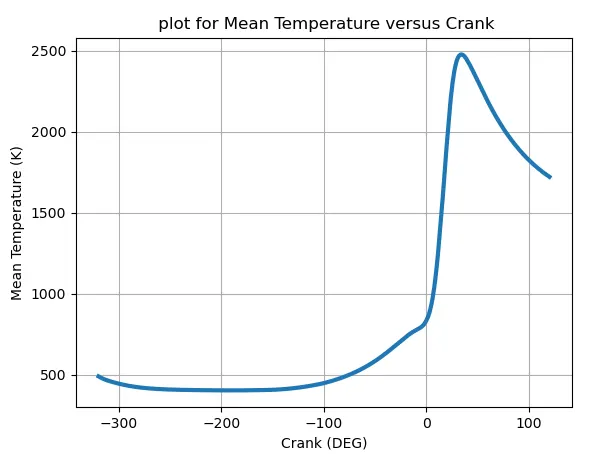
# Plot between Crank and Mean temperature using label header selection
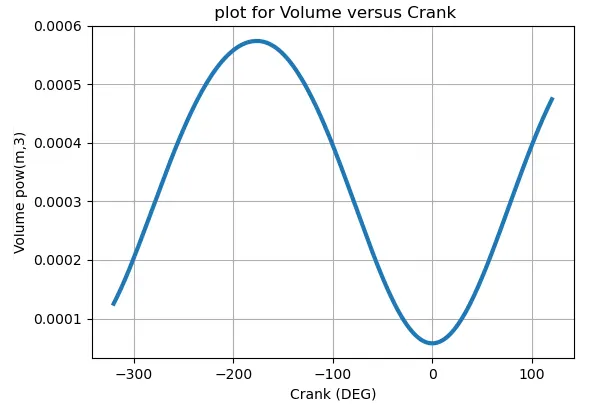
# Plot between Pressure and Volume using label header selection
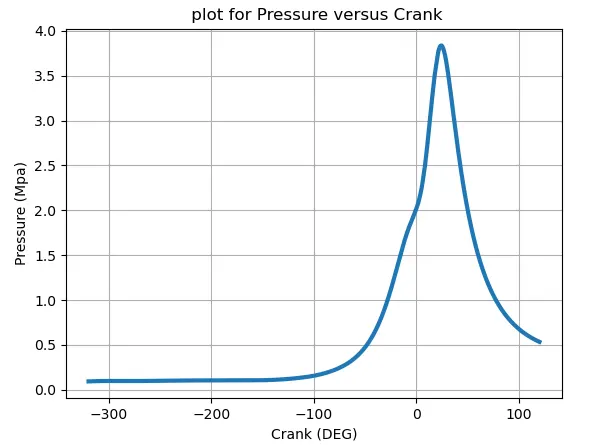
# Plot between Pressure and crank using label header selection
Conclusion:
The Data analysis of given data file has been successfully analyzed using python program. We have created python program with following, auto extraction of plot based on user input, compatibility check feature and area under PV diagram, power output of the engine and specific fuel consumption