Week 6 - Data analysis
AIM :
TO WRITE A PYTHON PROGRAM WHICH READS THE ENGINE OUTPUT PARAMETER DATA FILE AND PERFORM THE REQUIRED OBJECTIVES
OBJECTIVE :
- To read the data from a given data file.
- To take the file name as an input from user and check whether the file is present or not.
- To plot a graph between 2 parameter given by user as an input.
- To do basic performance calculation by calculating area under the P-V diagram, power output of this engine and specific fuel consumption.
PROBLEM STATEMENT :
Read the data from a given file named 'engine_data.out' using python program, plot a curve between 2 engine parameters (parameters to be given by user as an input) and perform basic performanc calculation by calculating area under the P-V diagram, power output of this engine(Assume that RPM is 1500) and specific fuel consumption (engine consumed 20 micro grams of fuel (per 1 stroke cycle)).
Link of the file- https://drive.google.com/file/d/1VgaABqU12MYxOOWJYg53I60IRDDT2jhf/view?usp=sharing
CODE-
# IMPORTING IMP MODULE
import math
import numpy as np
import matplotlib.pyplot as plt

#Taking inputs from user
file_name=input("Enter file name :")
print('------------------------------------------------------------------')
#checking for valid file
if file_name == 'engine_data.out':
    print('File found succesfully!! you may continue...n')
else:
    print('File not recognized. Please provide a valid CONVERGE output file')
    exit()
print('------------------------------------------------------------------')

#parameters given below for plot
print('The plot paramters given below in the series n')
print('1-crank,2-Pressure, 3-Max_Pressure, 4-Min_Pressure, 5-Mean_Temp, 6-Max_Temp, 7-Min_Temp, 8-Volume, 9-Mass, 10-density, 11-integrated_HR, 12-HR_Rate, 13-C_p, 14-C_v, 15-Gamma, 16-kin-Vics, 17-Dyn_Visc')

print('---------------------------------------------------------------------------------------------------------------------------------------------------------------------------------------------------------')

name=['Crank','Pressure','Max_Pres','Min_Pres','Mean_Temp','Max_Temp','Min_Temp','Volume','Mass','Density','Integrated_HR','HR_Rate','C_p','C_v','Gamma','Kin_Visc','Dyn_Visc']

# take inputs from users
x = input('Enter the first parameter you need to plot : ')
y = input('Enter the second parameter you need to plot : ')

print('------------------------------------------------------------')
# declare inputs as integer
x = int(x)
y = int(y)
# uesd to store the value
column_1 = []
column_2 = []

# look for taking required data and opening the data file
for line in open(file_name):
    if '#' not in line:
        column_1.append(float(line.split()[x-1]))
        column_2.append(float(line.split()[y-1]))
# plot
plt.figure(1)
plt.plot(column_1, column_2, linewidth=3)
plt.title(name[y-1]+' & '+name[x-1]+' Plot',fontsize=20,color='red')
plt.xlabel(name[x-1],fontsize=12)
plt.ylabel(name[y-1],fontsize=12)
plt.savefig(name[x-1] + ' vs ' + name[y-1] + '.png')
plt.grid()
plt.show()

#basic performance calculation
pressure = []
volume = []

for line in open('engine_data.out'):
    if '#' not in line:
        pressure.append(float(line.split()[1]))
        volume.append(float(line.split()[7]))

P = 1000000*np.array(pressure) # converting to pascal
V = np.array(volume)

#calculating area PV diagram
AREA = np.trapz(P, V)
print('nWorkdone (area under P-V diagram)= ',AREA ,'Joules')

# Calculating power
power = (AREA * 2* math.pi * (1500/60))/1000
print('Power out of the equation = ',power,'KW')

#calculating specific fuel consumption
sfc = 20 * pow(10, -6)* 3600 / power
print('Specific fuel consumption= ',sfc, 'g/kw.h')

#plotting P-V Diagram
plt.figure(2)
plt.plot(volume, pressure, linewidth = 3)
plt.title('P-V diagram',fontsize=20,color='red')
plt.xlabel('Volume',fontsize=12)
plt.ylabel('Pressure',fontsize=12)
plt.grid()
plt.show()
SCREENSHOT-
Graph between two parameters. Here i took CP and CV as two parameters
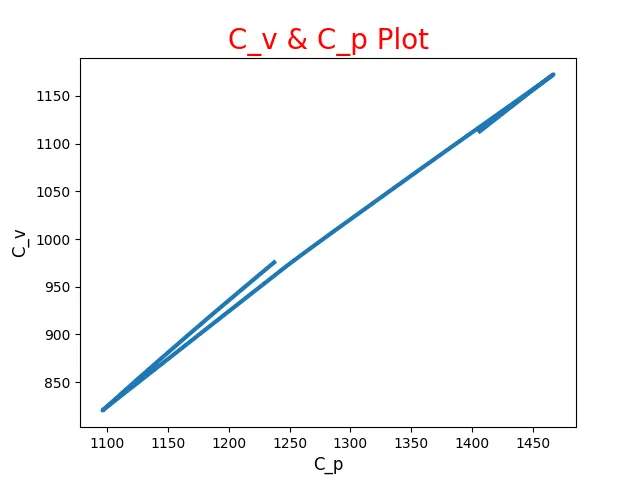
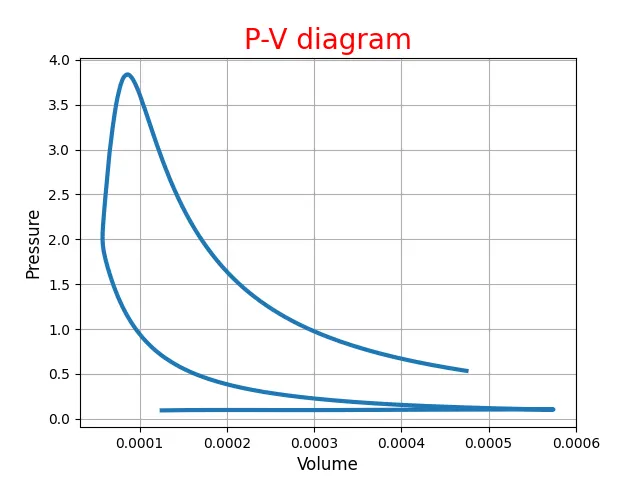
Graph Of pressure VS vessel-
SOLUTIONS-

RESULTS-
the Graph b/w two parameters, the PV diagram and other parameters are drived sucessfully.