Data analysis
Aim: To carry out data analysis by importing raw data values from a data file into Python and using those data values to produce practical and insightful graphs.
Theory: Column numbers should be input into the script, which should then plot each column as a separate image.
The script takes column numbers as the input and plot the respective columns as separate images
#Data analysis
import matplotlib.pyplot as plt
import numpy as np
#Parameters
crank = []
pressure = []
max_pressure = []
min_pressure = []
mean_temp = []
max_temp = []
min_temp = []
volume = []
mass = []
density = []
integrated_hr = []
hr_rate = []
c_p = []
c_v = []
gamma = []
kin_visc = []
dyn_visc = []
parameter = []
units = []
columns = [crank,pressure,max_pressure,min_pressure,mean_temp,max_temp,min_temp,volume,mass,density,integrated_hr,hr_rate,c_p,c_v,gamma,kin_visc,dyn_visc]
line_count = 1
We must first confirm that the converge starts with the # key. utilising the split function to divide the text line by line. adding the data to the programme after assigning the split lines to the loop. The method of indexing the supplied value for analysis is the subject of the programme.
#File parsing starts here
for line in open ('engine_data.out'):
if '#' not in line:
crank.append(float(line.split()[0]))
pressure.append(float(line.split()[1]))
max_pressure.append(float(line.split()[2]))
min_pressure.append(float(line.split()[3]))
mean_temp.append(float(line.split()[4]))
max_temp.append(float(line.split()[5]))
min_temp.append(float(line.split()[6]))
volume.append(float(line.split()[7]))
mass.append(float(line.split()[8]))
density.append(float(line.split()[9]))
integrated_hr.append(float(line.split()[10]))
hr_rate.append(float(line.split()[11]))
c_p.append(float(line.split()[12]))
c_v.append(float(line.split()[13]))
gamma.append(float(line.split()[14]))
kin_visc.append(float(line.split()[15]))
dyn_visc.append(float(line.split()[16]))
line_count = line_count+1
parameter_select = [columns]
#Printing the column parameter numbers
print('1.Crank_angle','2.Pressure','3.Maximum_pressure','4.Minimum_pressure')
print('5.Mean_temperature','6.Max_temperature','7.Min_temperature','8.Volume')
print('9.Mass','10.Density','11.Integrated_hr','12.Hr_rate','13.Constant_pressure')
print('14.Constant_volume','15.Gamma','16.Kinematic_viscosity','17.Dynamic_Viscosity')
print('Enter any two parameter column numbers')
x = int(input('Enter parameter for x_axis:'))
y = int(input('Enter parameter for y_axis:'))
Script the program along with given unit in sheet
# Data Plotting
for i in range(0, len(parameter)):
plt.plot(parameter_select[x], parameter_select[y])
plt.title('Plot of', parameter[0][x], 'vs' , units[0][y])
plt.xlabel(parameter[0][x] + units[0][x])
plt.ylabel(parameter[0][y] + units[0][y])
plt.savefig(parameter[0][x] , 'Vs', parameter[0][y] , '.png')
plt.show()
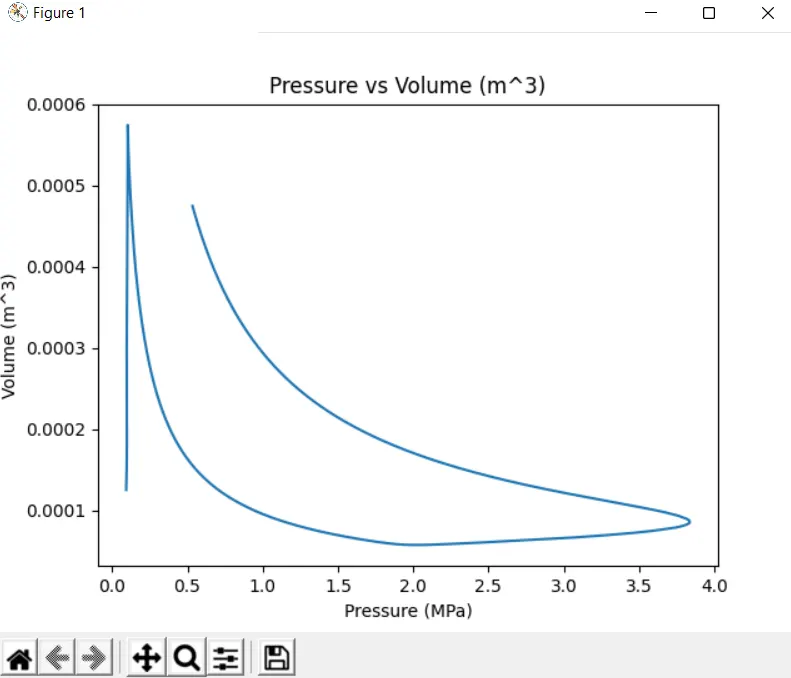
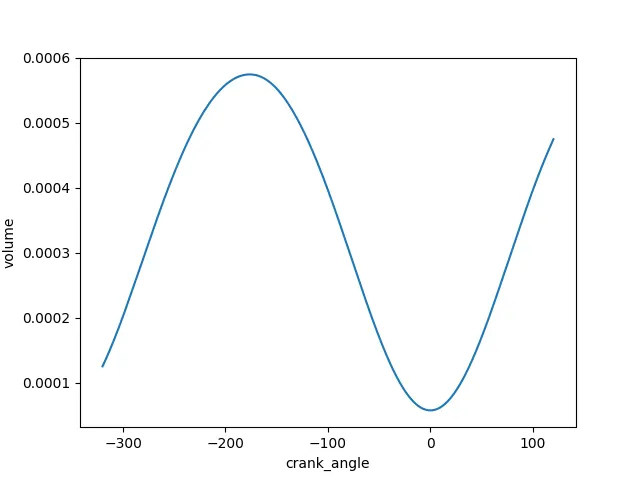
Only if Sublime Text has the "SublimeREPL" package installed will the code execute and accept "user" inputs.
Go to "Tools -> SublimeREPL -> Python -> Python -> RUN current file" after installation.
Calculate the area under the P-V diagram. P is in column 2 and V is in column 8.
Calculate the power output of this engine. Assume that RPM is 1500
This engine consumed 20 micro grams of fuel (per 1 stroke cycle). Calculate its specific fuel consumption.
# Engine Performance Calculation
fuel_consump= float(input('Fuel consumption of a engine in Micro gram/Stroke:'))
rpm = float(input('Enter the engine speed in rpm:'))
Area = float(x*y)
print(Area)
work_done = Area
print('Work Done is:' , work_done ,'J')
power = (work_done*(rpm/60))
print("Power output of Engine is:", power ,'kW')
rps=rpm/60
total_strokes = 4*rps
fuel_consump = fuel_consump * total_strokes
#Specific fuel consumption
s_f_c = (fuel_consump * 0.0036)/power
print('Fuel Consumption of a Engine:', s_f_c , 'g/kW.hr')
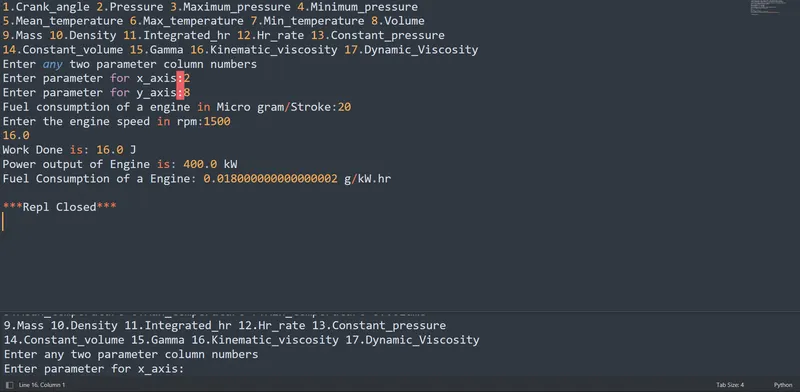
Result: As a result, the necessary data was imported from the data file and plotted using the programme mentioned above. The aforementioned screenshots also display data on area, power, and specific fuel use.