Curve fitting
Q1. What does popt and pcov mean?
Ans: The best estimates for the coefficients in the equation are contained in the array "popt". "pcov" The true variance and covariance of the parameters are contained in a square matrix.
Q2. What does np.array(temperature) do?
Ans: The true variance and covariance of the parameters are contained in a square matrix.
Q3. What does the * in *popt mean?
Ans: The best estimates for the coefficients in the equation are contained in the array is called popt.
Q4. Write code to fit a linear and cubic polynomial for the Cp data.
Ans:
# Curve fitting
import numpy as np
import matplotlib.pyplot as plt
from scipy.optimize import curve_fit
#Curve fit for lin function
def linear_func(t, a, b):
return a*t + b
#Curve fit for cubic polynomial
def cubic_func(t, a, b, c, d):
return a*pow(t,3) + b*pow(t,2) + c*t + d
#Read the data file
def read_file():
temperature = []
cp = []
for line in open('data','r'):
values = line.split(',')
temperature.append(float(values[0]))
cp.append(float(values[1]))
return [temperature, cp]
#linear curve
temperature,cp = read_file()
popt,pcov= curve_fit(linear_func,temperature,cp)
fit_cp=linear_func(np.array(temperature), *popt)
# Main Program
temperature, cp = read_file()
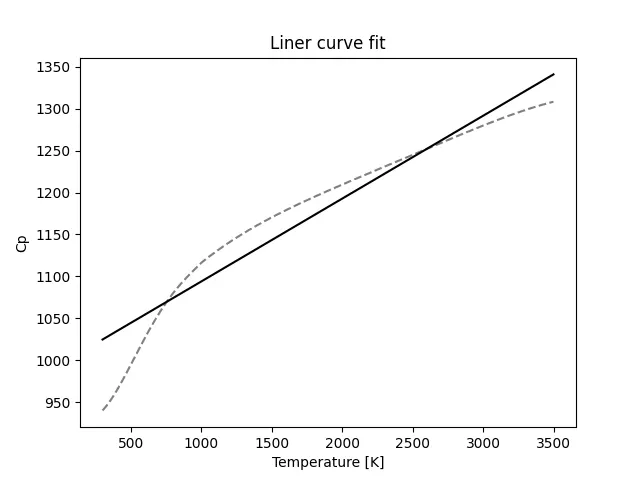
#Ploting the linear curve fit
popt, pcov = curve_fit(linear_func, temperature, cp)
fit_cp = linear_func(np.array(temperature), *popt)
plt.plot(temperature, cp, '--',)
plt.plot(temperature, fit_cp, color='black')
plt.title('Liner curve fit')
plt.xlabel('Temperature [K]')
plt.ylabel('Cp')
plt.show()
#Ploting the cubic curve fit
popt, pcov = curve_fit(cubic_func, temperature, cp)
fit_cp = cubic_func(np.array(temperature), *popt)
plt.plot(temperature, cp, '--',)
plt.plot(temperature, fit_cp, color='black')
plt.title('Cubic curve fit')
plt.xlabel('Temperature [K]')
plt.ylabel('Cp')
plt.show()
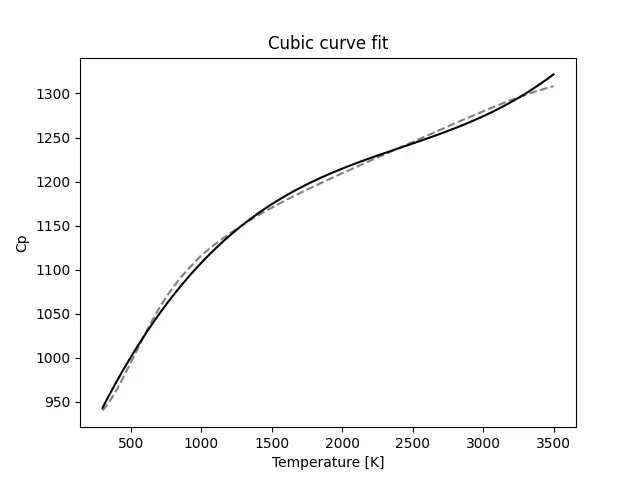
Q5. What needs to be done in order to make the curve fit perfect?
Ans: It can be done by increasing the order of polynomial, and keeping the values closer.