Week 6 - Data analysis
week 6
data analysis:
Aim:
to write a script for the following:
i)data visualizer.
ii)compactability check.
iii)basic performance calculation.
Introduction:
Data analysis is a process of inspecting, cleansing, transforming, and modeling data with the goal of discovering useful information, informing conclusions, and supporting decision-making. The purpose of Data Analysis is to extract useful information from data and taking the decision based upon the data analysis. A simple example of Data analysis is whenever we take any decision in our day-to-day life is by thinking about what happened last time or what will happen by choosing that particular decision.
- Step One: Ask The Right Questions. So you're ready to get started. ...
- Step Two: Data Collection. This brings us to the next step: data collection. ...
- Step Three: Data Cleaning. You've collected and combined data from multiple sources. ...
- Step Four: Analyzing The Data. ...
- Step Five: Interpreting The Results.
As a data analyst, you can use charts, graphs, maps, and other visual representations of data to help present your findings in an easy-to-understand way. Improving your data visualization skills often means learning visualization software, like Tableau. A data analyst reviews data to identify key insights into a business's customers and ways the data can be used to solve problems. They also communicate this information to company leadership and other stakeholders.
Procedure:
- first open the sublime text editor and save it with.py extension.
- download the data file from the source. then cut and paste in the file directory where you store the .py file.
- the above step is very important if you dont do this the file will not open and it doesnt work.
- then write the below code to do data analysis.
python code:
firstly, we have to install the REPL in sublime text editor.
1.open the tool and click on install package control. now the package control is downloaded.
2.then click on preferance>package control>install package and type sublime REPL.
3.after installation,preferance>browse package>sublime REPL>config>python>open main.sublime_builder
4.from the opened code in line number 53 add "-i"save it.
5. tool menu>build system>new tool system then write the below code:
{
"target": "run_existing_window_command",
"id": "repl_python_run",
"file": "config/Python/Main.sublime-menu"
}
6.save it in the directory where the main is saved. it with the extension of .sublime-builder.
7.buils system>saved file name >click on it.
8. now run the python code with the user input.it pop to another window.
python program:
import math
import numpy as np
from scipy.integrate import simps
import matplotlib.pyplot as plt


#file reading
file=input('enter the name of converge file with extension(.out)')

try:
	f=open(file)
except:
	print('file is not recognised, please provide a valid converge output file')


title=[]

for line in open(file):
	if '#' in line:
		title.append(line.split())

print(title)
print(title[1])
print(title[2])

s_num=[]
for sn in title[1]:
	if'#' not in sn:
		if'column' not in sn:
			s_num.append(sn)


parameter=[]
for para in title[2]:
	if'#' not in para:
		parameter.append(para)

units=[]
for u in title[3]:
	if'#' not in u:
		units.append(u)


a=int(input('enter the column number of 1st parameter: '))
b=int(input('enter the column number of 2st parameter: '))
print('\n')

x_input=parameter[a-1]
y_input=parameter[b-1]

x_unit = units[a-1]
y_unit = units[b-1]

#to store the values for plot:
value=[]
value1=[]

#to calculate the p-v
pressure=[]
volume=[]

for line in open(file):
	if '#' not in line:
		value.append(float(line.split()[a-1]))
		value1.append(float(line.split()[b-1]))
		pressure.append(float(line.split()[1]))
		volume.append(float(line.split()[2]))

area=simps(pressure,volume)
print('area under p-v curves'+str(area))
print('work done by the engine'+str(area*1e6))

rpm=int(input('enter the engine rpm:'))
rps=rpm/60
power_stroke=rps/2
power=(area*1e6)*power_stroke /1000
print('power output of the engine is'+str(power)+'kw')

#specific fuel consumption
r=int(input('enter the specific fuel consumptionper kg/sec'))
sfc=(r/power)*3600

#plotting the graph:
plt.plot(value,value1)
plt.xlabel(x_input+" "+x_unit)
plt.ylabel(y_input+" "+y_unit)
plt.title("variation of "+y_input+" vs "+x_input)
plt.show()
python code explain:
- firstly Compatability check is donw.whether the file is present in the directory or not.
- then Data visualizer is done .our script should take column numbers as the input and plot the respective columns as separate images .Each file should be saved by the name of the column.The plot labels should be extracted from the file. If, I request for a plot between column 1 (crank angle) and column 8(volume), then the label information should automatically be extracted and must appear as labels in the plots.
- now the basic calculation has to done. Calculate the area under the P-V diagram. P is in column 2 and V is in column 8. Calculate the power output of this engine. Assume that RPM is 1500. This engine consumed 20 micro grams of fuel (per 1 stroke cycle). Calculate its specific fuel consumption.
results:
with build the python code:
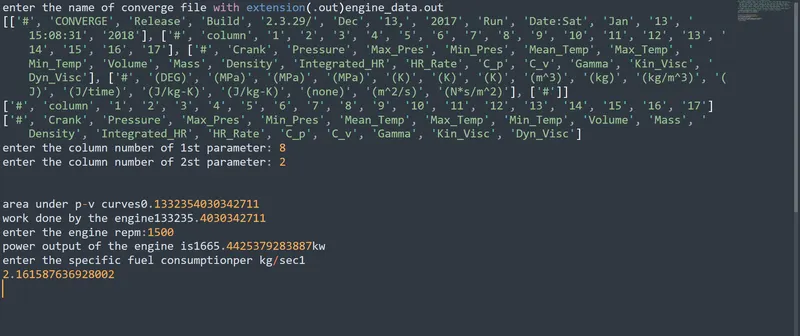
the specific fuel consumption is 2.16158 kg/kwhr
the power output of the engine is 1665.442 kw
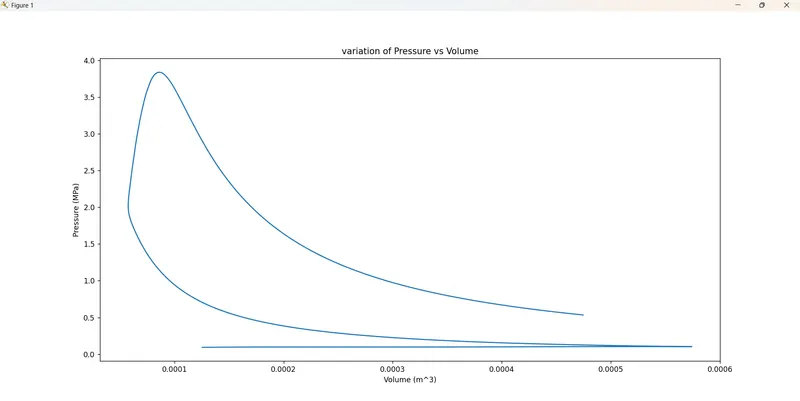
the above diagram show the p_v diagram for the given data.
conclusion:
from the above python code, we have done the following:
i)data visualizer.
ii)compactability check.
iii)basic performance calculation.
hence the calculation is done and the value are shown.
then the graph for p-v is shown in the above.
-=-=-=-=-=-=-=-=-=-=-=-=-=-=-thank you=-=-=-=-=-=-=-=-=-=-=-=-=-=-=-=-=-=-=-=-=-=-=-=