Week 3 - Solving second order ODEs
clear all
close all
clc

% parameters:
b=0.05; % no unit
g=9.81; % m/s2
l=1; % m
m=1; % kg

%initial condition:
theta_0=[0;3];

% time plot
t_span=linspace(0,20,500);

% applying ode solver;
[t,results]=  ode45(@(t,theta) ode_function(t,theta,b,g,l,m),t_span,theta_0);


figure(1)
plot(t,results(:,1));
hold on
plot(t,results(:,2));
xlabel('amplitude')
ylabel('time')
axis([0 20 -5 5])
grid on

%below for code to animate
figure(2)
ct=1;

for i=1:length(results(:,1))
    x0=0;
    y0=0;
    plot([-1 1],[0 0],'linewidth',3,'color','k')
    hold on

    %position of the bob
    x1=l*sin(results(i,1));
    y1=-l*cos(results(i,1));

    %plotting the pendulum
    plot([x0,x1],[y0,y1],'linewidth',2,'color','r')

    %plotting the fixed end
    plot(x0,y0,'-s','markeredgecolor','k','markerfacecolor','b','markersize',30)

    %plotting the bob
    plot(x1,y1,'-o','markeredgecolor','k','markerfacecolor','y','markersize',20)
    hold off
    axis([-1.5 1.7 -1.5 0.5])
    grid on

    M(ct)=getframe(gcf);
    ct=ct+1;

end

%code to animate the movie
movie(M)
Videofile=VideoWriter('odesimplependulum.avi','uncompressed AVI');
open(Videofile)
writeVideo(Videofile,M)
close(Videofile)


second code (function)
%function of second oder ode

function[dtheta_dt]=ode_function(t,theta,b,g,l,m)

theta1=theta(1);
theta2=theta(2);

dtheta1_dt=theta2;
dtheta2_dt=-(b/m)*theta1-(g/l)*sin(theta1);
dtheta_dt=[dtheta1_dt;dtheta2_dt];

end
the video is attached in the browse section not in this sample code.
explanation
introduction
to write a program to animate the simple pendulum.
firstly, open the matlab and click new script sheet.
then write clear all,close all and clc.
the above is to clear the format.
%code explanation:
firstly give the input parameters. such as b,g,l,m.
then write the initial condition as theta_0, which contains initial displacement and initial angular velocity.
then write the time span of the pendulum which is about 20sec.
now write the ode function ie, syntax[t,y]=ode45(odefunction,t_span,y0).
ode45 is a solver inbuilt in the matlab.
now the code gets into the ode function
that is function dtheta_dt=odefunction(t,theta,b,g,l,m)
theta_1 is the first order function,theta_2 is the second order ode.
then differntiate theta1 and theta2; which gives the function of ode.
then the value is stored in dtheta_dt in column vector.
end the function.
now plotting the figure (1)
first plot the t in xaxis and results1 in yaxis. then use hold on comment to complete the plots.
now plot again the t in xaxis and results2 in yaxis. then label x in ampiltude and y in time.
this is to plot the time vs amplitude graph.
then run the code to get the graph.
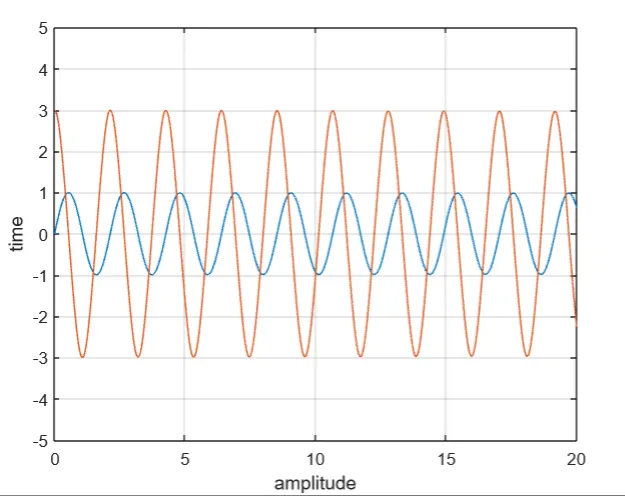
(note:this is to done separately to get the graph)
now for figure (2)
start the counter
with the help of for loop.
i=1 to length of results1. intial condition as x0=0,y0=0.
then plot the fixed end.
now to position the bob, x1=l*sin(results(i,1));y1=-l*cos(results(i,1)) is used.
then plot the pendulum with (x0,y1);(y0,y1).
next step is to plot the fixed end and then the bobof the pendulum using the codes.
then create the animation using M(ct)=getframes(gcf), then ct+=1.
then create a animation video using the code of movie,videofile,open,writevideo and close.
now, run the code to get the animation video.
thank you