Week 6 - Data analysis
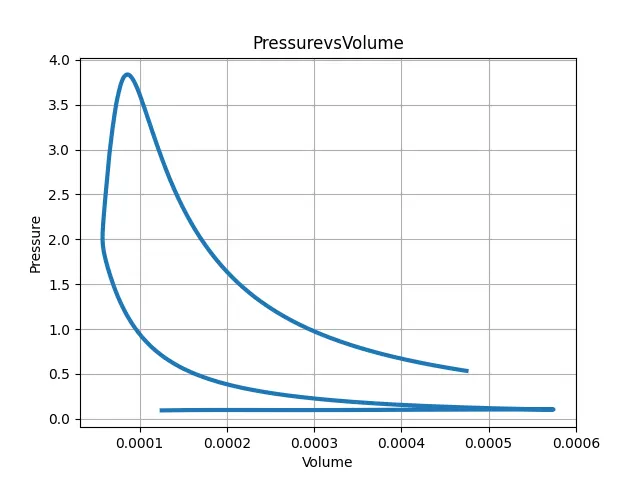
Aim- to analyze the given data( engine data) and check the compatiblity and plot of pressure- volume and find the area under the curve.
Theory- Data analysis deals with the analysis of any given data by the use of programming language such that one can easily understand and do desired task with that data.
NLP, natural language processing is concerned with programming the computers to process and analyze the human written language.
Data analysis helps to automate certain thgings for better analysis.
Problem apporoach-
- We have a data of engine with various values , first we need to check compatebility weather that file is read or not,and then ceratin calculations will be done like area under the pressure-volume plot.
Python code-
import math
import numpy as np
import matplotlib.pyplot as plt
from scipy.integrate import simps
from tabulate import tabulate
import cmath

#file input
File = input("Enter the name of CONVERGE output filename with extension (.out):")

#checking if filoe is a valid converge o/p file
try:
	f = open(File)

except FileNotFoundError:
	print('file not recognized')


# Defining the title
titles = []
for line in open(File) :
	if '#' in line:
		titles.append(line.split())
print(titles)
#print(titles[1])

# To get column number
S_num = []
for sn in titles[1]:
	if '#'  not in sn:
		if'column' not in sn:
			S_num.append(sn)
print(S_num)

# to get parameter name
parameters = []
for p in titles[2]:
	if '#' not in p:
		parameters.append(p)
print(parameters)

# printing parameters with units and column no.
headers = ['column No','parameters']
data = tuple(zip(S_num,parameters,))
print(tabulate(data,headers=headers))

a = int(input('Enter column no of 1st parameter:'))
b = int(input('Enter column no of 2st parameter:'))
print('\n')

# to genrate labels for plots
x_1 = parameters[a-1]
y_1 = parameters[b-1]

# to store required value to plot
value_1 = []
value_2 = []

# to calculate work done from p-v curve
pressure = []
volume = []


# creating a loop to get required value
for line in open(File):
	if '#' not in line:
		value_1.append(float(line.split()[a-1]))
		value_2.append(float(line.split()[b-1]))
		pressure.append(float(line.split()[1]))
		volume.append(float(line.split()[7]))

# to calculate area under pv plot
Area = simps(pressure,volume)
print('Area under p-v curve:' + str(Area))
print('work done by engine:' +str(Area*1e6))
print('n')

# to calculate power output of engine
rpm = int(input('Enter the engine RPM'))
rps = rpm/60
power_strokes = rps/2 # no. of power stroke in 1 revolution of crank
power = (Area*1e6)*power_strokes/1000  # power in KW
print('power output of engine is:' + str(power)+'kw')
print('\n')

# to calculate specific fuel consumption
r = int(input('Enter the specific fuel consumption in kg'))
sfc = (r/power)*3600
print('specific fuel consumption of the engine:' +str(sfc)+'kg/kwhr')

# plotting thge graphs
plt.plot(value_1,value_2, linewidth = 3)
plt.title(y_1+"vs"+x_1)
plt.xlabel(x_1)
plt.ylabel(y_1)
plt.grid()
plt.savefig('p-v plot')
plt.show()
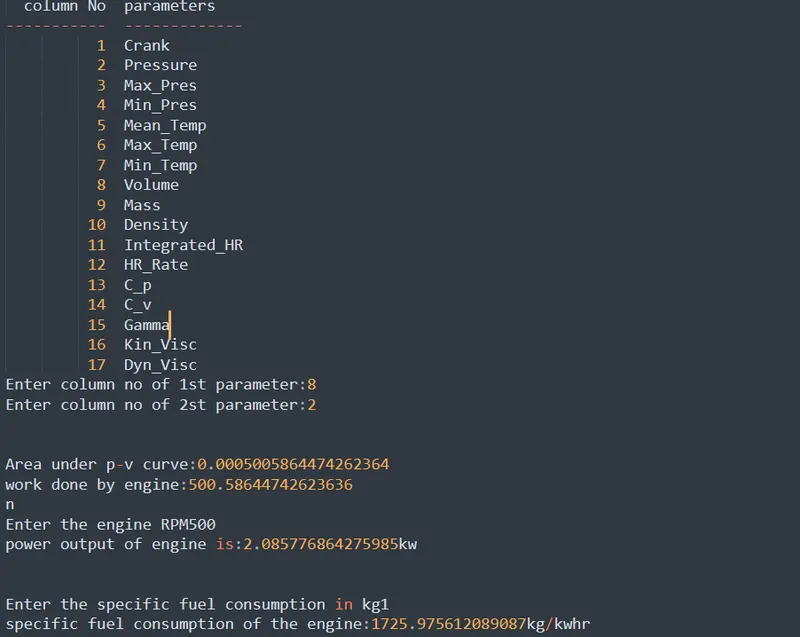
Input parameres given - rpm- 500, fuel consumption = 1kg .
Result - shown in image below-
P-V graph -