Week 6 - Data analysis
Data visualizer (100 points)
- Your script should take column numbers as the input and plot the respective columns as separate images
- Each file should be saved by the name of the column
- The plot labels should be extracted from the file. If, I request for a plot between column 1 (crank angle) and column 8(volume), then the label information should automatically be extracted and must appear as labels in the plots. THIS SHOULD NOT BE DONE MANUALLY
Compatability check (30 points)
- You code should exit gracefully, if a non-compatible file is provided as an input. It should say something like "File not recognized. Please provide a valid CONVERGE output file"
import math
import numpy as np
import matplotlib.pyplot as plt
from scipy.integrate import simps as simps, trapz as trapz


# Compatibility Check

file_name = input('Enter the CONVERGE file having out Extension = ')

if file_name == 'engine_data.out':

    print('\nData file is succesfully opened.')

else:

    print('\nPlease Enter a valid filename.\n')
    exit()

# file naming with the name of the column

#Empty array of inputs

crank = []
Pressure=[]
Max_Pres=[]
Min_Pres=[]
Mean_Temp=[]
Max_Temp=[]
Min_Temp=[]
Volume=[]
Mass=[]
Density=[]
Integrated_HR=[]
HR_Rate=[]
C_p=[]
C_v=[]
Gamma=[]
Kin_Visc=[]
Dyn_Visc=[]

# using for loop for all parameters iterations

for data in open('engine_data.out'):

    if '#' not in data:
        crank.append(float((data.split()[0])))
        Pressure.append(float((data.split()[1])))
        Max_Pres.append(float((data.split()[2])))
        Min_Pres.append(float((data.split()[3])))
        Mean_Temp.append(float((data.split()[4])))
        Max_Temp.append(float((data.split()[5])))
        Min_Temp.append(float((data.split()[6])))
        Volume.append(float((data.split()[7])))
        Mass.append(float((data.split()[8])))
        Density.append(float((data.split()[9])))
        Integrated_HR.append(float((data.split()[10])))
        HR_Rate.append(float((data.split()[11])))
        C_p.append(float((data.split()[12])))
        C_v.append(float((data.split()[13])))
        Gamma.append(float((data.split()[14])))
        Kin_Visc.append(float((data.split()[15])))
        Dyn_Visc.append(float((data.split()[16])))
title = []
units = []
line_count=1
for data in open('engine_data.out'):
    if line_count == 3:
        title.append(data.split())
    if line_count == 4:
        units.append(data.split())

    line_count +=1

all_coloumn = [crank,Pressure,Max_Pres,Min_Pres,Mean_Temp,Max_Temp,Min_Temp,Volume,Mass,Density,Integrated_HR,HR_Rate,C_p,C_v,Gamma,Kin_Visc,Dyn_Visc]

# taking column numbers as the input and plotting the respective columns as separate images
x_axis = int(input('enter the x_axis column number = '))
y_axis = int(input('enter the y_axis column number = '))


plt.figure()
plt.plot(all_coloumn[x_axis],all_coloumn[y_axis])
plt.xlabel(title[0][x_axis+1]+units[0][x_axis+1])
plt.ylabel(title[0][y_axis+1]+units[0][y_axis+1])
plt.show()
Explanation:
- import numpy as np and matplotlib.pyplot as plt.
- take the data from the question and place it in file place.
- checking for Compatibility coding is written at first to know whether the file is correct or not.
- file naming with the name of the column:
- now taking input parameters which are in data file.
- for loop is used here to differ the lines using '#'.
- if # is in data then using for loop inside if condition, it will be stored in label and units using append command and then splitting.
- line count will be consider here.
- if # is not in data and line_count == 1.
- taking line line_count =1 for counting the lines.
- line label and units to store the dta of 3 and 4 lines from data file.
- then that data will be stored in parameters simulataneously.
- after storing all parameters, all_coloumn is used to store them by converting into arrays.
- here arrays are used to store the multiple values of variables.
- later, x_axis and y_axis are used to enter the arrays.
- fig will be named with x_axis and y_axis label command by converting into string.
- for plotting, from all_coloumn of x and y-axis.
- for x and y labelling, from all_coloumn of x and y-axis labeling and units are used.
- title and save the figure with fig_name.
- now plot the figure.
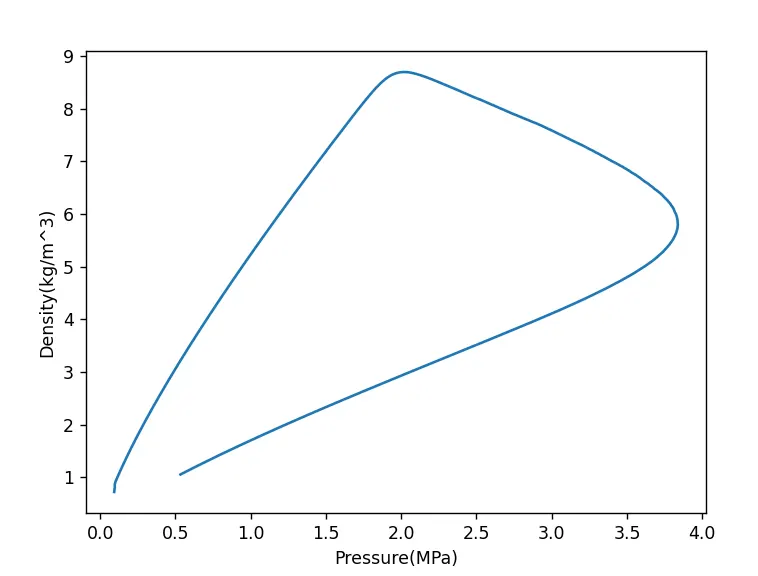
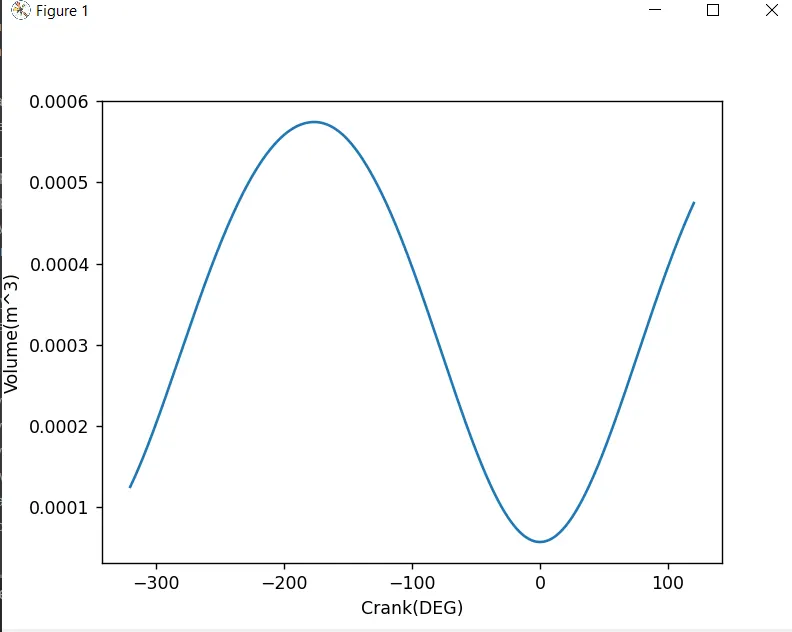
some plots from above code given below.
Basic performance calculation (50 points)
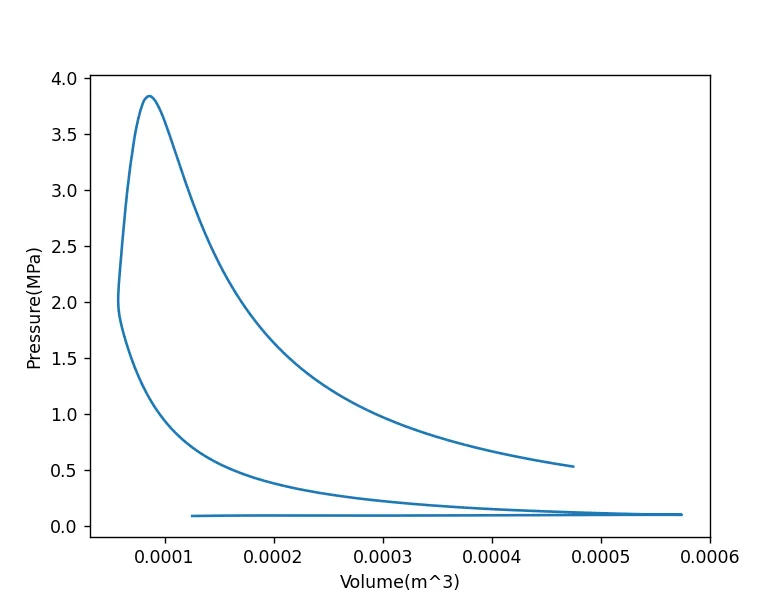
- Calculate the area under the P-V diagram. P is in column 2 and V is in column 8.
- Calculate the power output of this engine. Assume that RPM is 1500
- This engine consumed 20 micro grams of fuel (per 1 stroke cycle). Calculate its specific fuel consumption.
CODE:
import math
import numpy as np
import matplotlib.pyplot as plt
from scipy.integrate import simps as simps, trapz as trapz
# input parameters
crank = []
Pressure=[]
Max_Pres=[]
Min_Pres=[]
Mean_Temp=[]
Max_Temp=[]
Min_Temp=[]
Volume=[]
Mass=[]
Density=[]
Integrated_HR=[]
HR_Rate=[]
C_p=[]
C_v=[]
Gamma=[]
Kin_Visc=[]
Dyn_Visc=[]

# using for loop for all parameters iterations

for data in open('engine_data.out'):

    if '#' not in data:
        crank.append(float((data.split()[0])))
        Pressure.append(float((data.split()[1])))
        Max_Pres.append(float((data.split()[2])))
        Min_Pres.append(float((data.split()[3])))
        Mean_Temp.append(float((data.split()[4])))
        Max_Temp.append(float((data.split()[5])))
        Min_Temp.append(float((data.split()[6])))
        Volume.append(float((data.split()[7])))
        Mass.append(float((data.split()[8])))
        Density.append(float((data.split()[9])))
        Integrated_HR.append(float((data.split()[10])))
        HR_Rate.append(float((data.split()[11])))
        C_p.append(float((data.split()[12])))
        C_v.append(float((data.split()[13])))
        Gamma.append(float((data.split()[14])))
        Kin_Visc.append(float((data.split()[15])))
        Dyn_Visc.append(float((data.split()[16])))


all_coloumn = [crank,Pressure,Max_Pres,Min_Pres,Mean_Temp,Max_Temp,Min_Temp,Volume,Mass,Density,Integrated_HR,HR_Rate,C_p,C_v,Gamma,Kin_Visc,Dyn_Visc]

# taking column numbers as the input and plotting the respective columns as separate images
x_axis = int(input('enter the x_axis column number = '))
y_axis = int(input('enter the y_axis column number = '))


if x_axis==7 and y_axis==1:

    RPM =1500
    Area= np.trapz(all_coloumn[x_axis],all_coloumn[y_axis])
    Workdone=Area*1000
    Power = 2*(math.pi)*RPM*Workdone/60
    Fuel_per_Stroke =20*1e-6
    Fuel_per_Sec =Fuel_per_Stroke*RPM*(0.5/60)
    Fuel_per_Hour= Fuel_per_Sec*3600
    BSFC =Fuel_per_Hour/Power

    print('Area under the P-V diagram (Workdone):', Workdone, 'KJ')
    print('Power Output of this Engine : ',Power, 'KW')
    print('Specific Fuel Consumption:',BSFC, 'g/KWh')

plt.figure()
plt.plot(all_coloumn[x_axis],all_coloumn[y_axis])
plt.xlabel('Volume(m^3)')
plt.ylabel('Pressure(MPA)')
plt.show()
Explanation:
- here separate coding is done for this question particularly.
- import numpy as np and matplotlib.pyplot as plt.
- take the data from the question and place it in file place.
- using for loop all iterations are done.
- later, taking column numbers as the input and plotting the respective columns as separate images
- here using if condition the x_axis==7 and y_axis==1, we given this condtion and pv diagram will be plotted as shown below.
- for the Area under the P-V diagram calculation we use, from scipy.integrate import simps as simps, trapz as trapz.
- area will be calculated and in output it will be shown.
- power formula will be given as 2*(math.pi)*RPM*Workdone/60.
- for specific fuel consumption formulae is given by, Fuel_per_Sec =Fuel_per_Stroke*RPM*(0.5/60)
- Fuel_per_Stroke given in the challenge.
- to make it in hours multiplying with 3600.
- for Basic specific fuel consumption = Fuel_per_Hour/Power
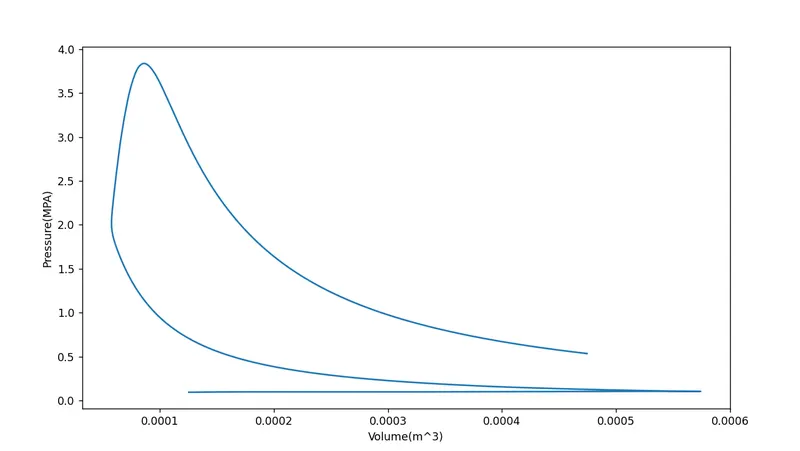
output:
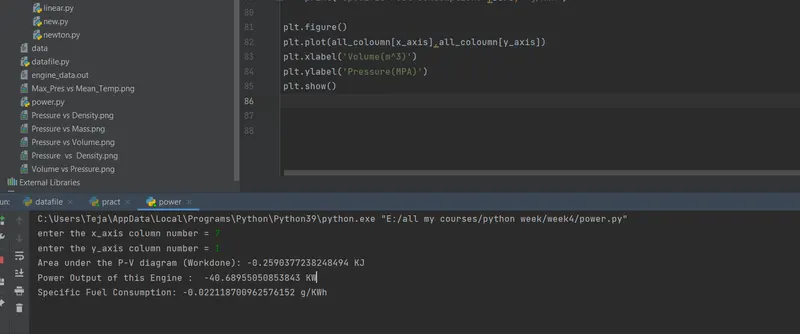
enter the x_axis column number = 7
enter the y_axis column number = 1
Area under the P-V diagram (Workdone): -0.2590377238248494 KJ
Power Output of this Engine : -40.68955050853843 KW
Specific Fuel Consumption: -0.022118700962576152 g/KWh