Week 6 - Data analysis
AIM :
to write a python program which reads the engine output parameter data file and perform the requried objectives.
OBJECTIVE:
- To read data from a given data file.
- to take fiile name as an input from user and check whether the file is present or not.
- to plot a graph between 2 parameter given by user as an input.
to do basic performance calculations by calculating area under the p-v diagram. power output of this engine and specific fuel consumption.
PROBLEM STATEMENT:
Read the data from given file named 'engine_data.out' using python program. plot curve between 2 engine parameters and perform basic perrformance calculation by calculating area under the p-v diagram, power output of this engine we are assuming RPM = 1500 and engine consumes 20 micro grames of fuel (per 1 stroke cycle)
PROCEDURE:
- Using python program initially the name of the data file is taken as an input from the user and checked weather the file is present or not,if the file is not present then the programe is terminated.
- then the file is opened and data is read line by line and stored.
- the name of parameters, their unit their column number are stored as an array displayed in the form of table for the user to select the requried column.
- and then those column are extracted data filr and further plotted.
- from the p-v curve is calculated is calulated using the trapezoidal rule as we know an area under the p-v diagram is equal to work done
- by calculating workdonne then we have calculated power which is equal to workdone*speed
- then we have calculated specific fuel consumption.
where ,
specific fuel consumption = mass of fuel consumption per hour/power devloped in KW.
CODE:
#PYTHON CODE BY SHRIKANT GAIKWAD

import matplotlib.pyplot as plt
import math
import numpy as np
from numpy import trapz

print('General Instruction')
print('Please make sure that the CONVERGE data file is saved in the same directory where Python code is saved.')

file_name=input('Enter the CONVERGE file having .out extension : ')

#Compatability check
try :
    data = open(file_name,'r')
    print('nData file is succesfully opened.')


except FileNotFoundError:
    print('nPlease Enter a valid filename.n')


line_count=1
for line in data:


    if line_count==3:
        Parameter=line.split()

        Columns=len(Parameter)
        print('nThis CONVERGE file contains following data which is derived from I.C. Engine Simulation :')
        print('It has total %d Data Columns' %(Columns-1))


        for Line in data:
            if line_count==4:
                Unit=Line.split()
            break

        for C_no in range(1,Columns):
            print(C_no,line.split()[C_no],Line.split()[C_no])
        break
    line_count=line_count+1


print('nChoose any Two Parameter From Above.')
print('Enter a number corresponding to parameter 1 to 17.n')
x=int(input("Enter X-axis Parameter : "))

y=int(input("Enter Y-axis Parameter : "))


x_data=[]
y_data=[]


line_count=1
for line in open(file_name,'r'):
    if line_count==3:
        X_label = line.split()[x]
        Y_label = line.split()[y]
        if line_count<=4:
            x_label=line.split()[x]+Line.split()[x]
            y_label=line.split()[y]+Line.split()[y]


    if '#' not in line:
        x_data.append(float(line.split()[x-1]))
        y_data.append(float(line.split()[y-1]))

    line_count=line_count+1


filename=Y_label+'vs'+X_label+'.png'

plt.figure()
plt.plot(x_data,y_data)
plt.xlabel(x_label)
plt.ylabel(y_label)
plt.title(Y_label+' vs '+X_label)
plt.savefig(filename)
plt.show()

#performance calculation
if x==2 and y==5:
    RPM=1500
    Area=np.trapz(y_data,x_data)
    Workdone=Area*1000
    Power=2*math.pi*RPM*Workdone/60
    Fuel_per_Stroke=20*1e-6
    Fuel_per_Sec=Fuel_per_Stroke*RPM*(0.5/60)
    Fuel_per_Hour=Fuel_per_Sec*3600
    BSFC=Fuel_per_Hour/Power

    print('Area under the P-V diagram(Workdone) :',Workdone,'kJ')
    print('Power Output of this Engine :',Power,'kW')
    print('Specific Fuel Consumption :',BSFC,'g/kWh')
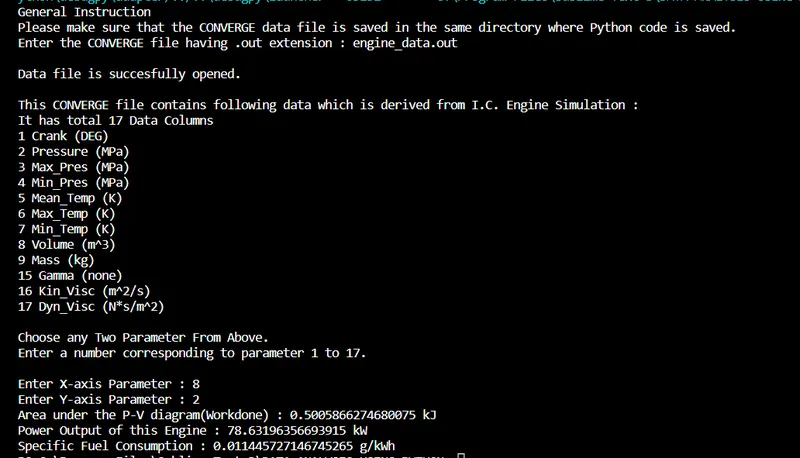
OUTPUT RESULT AND SCREENSHOT:
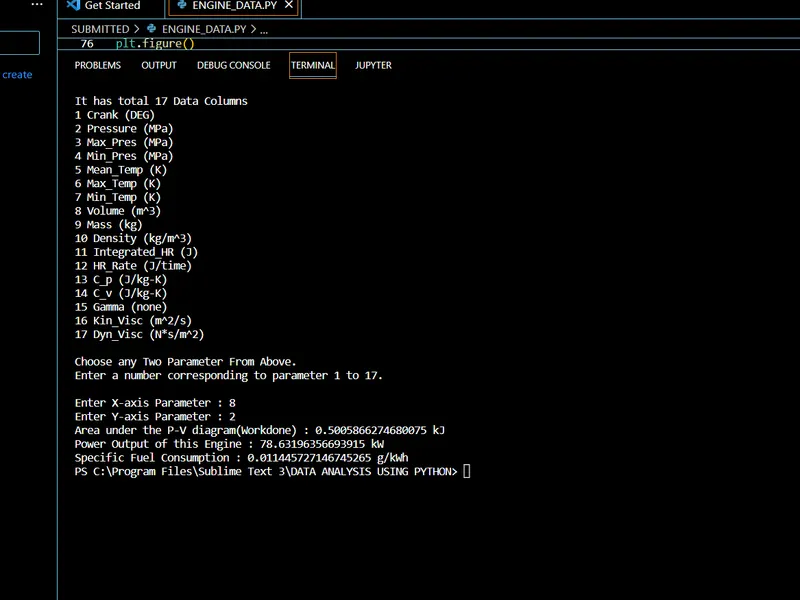
SIMILARLY WE GENRATED FIG AND CALCULATIONS:
FIG-1
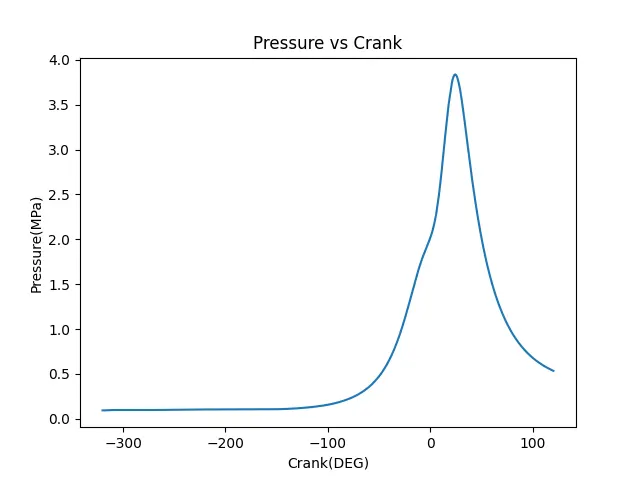
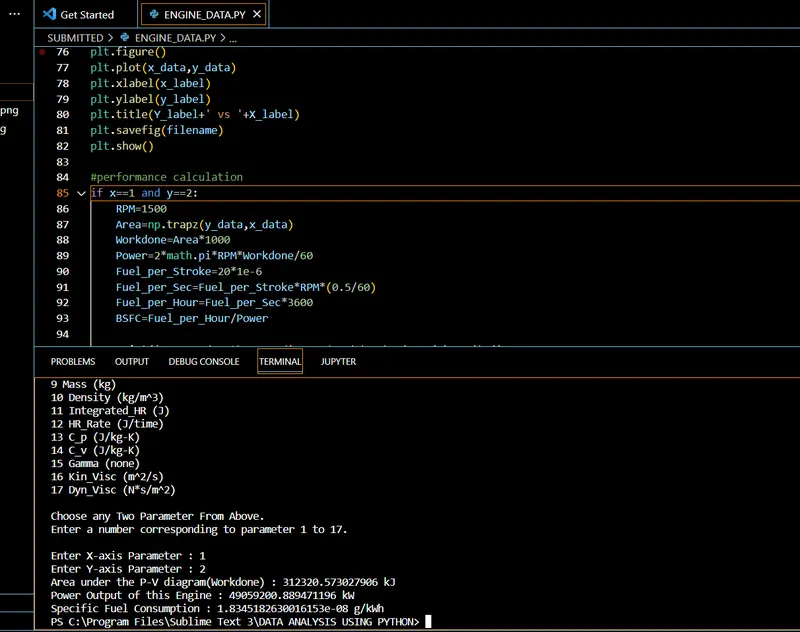
FIG-2
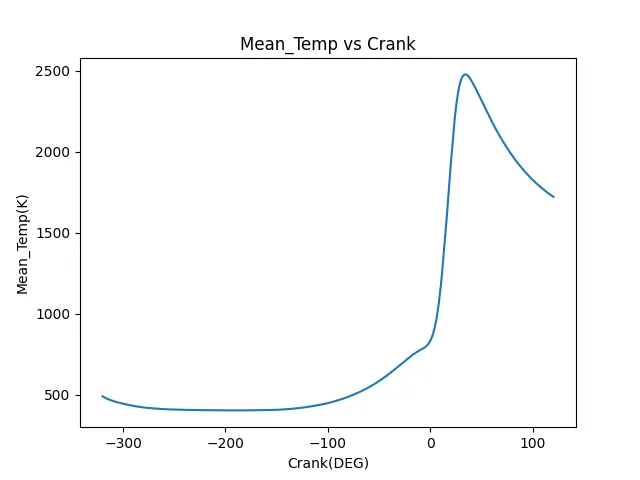
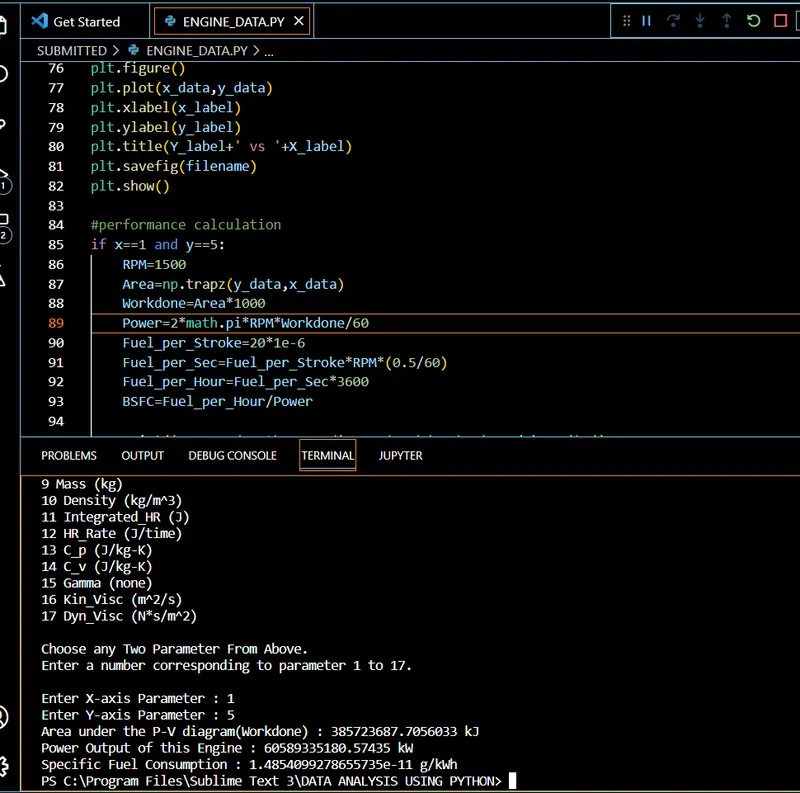
FIG.3
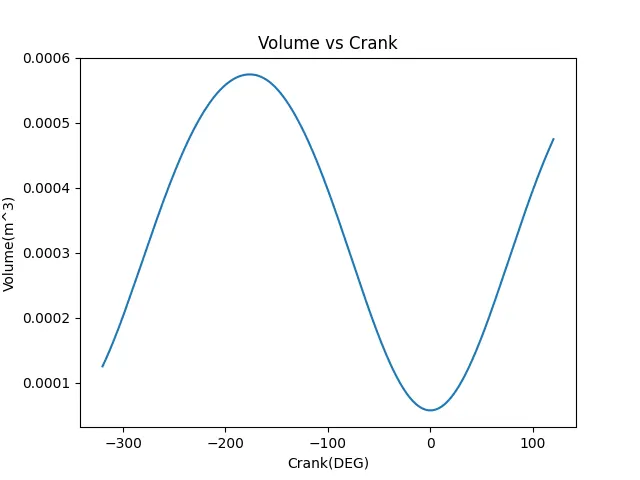
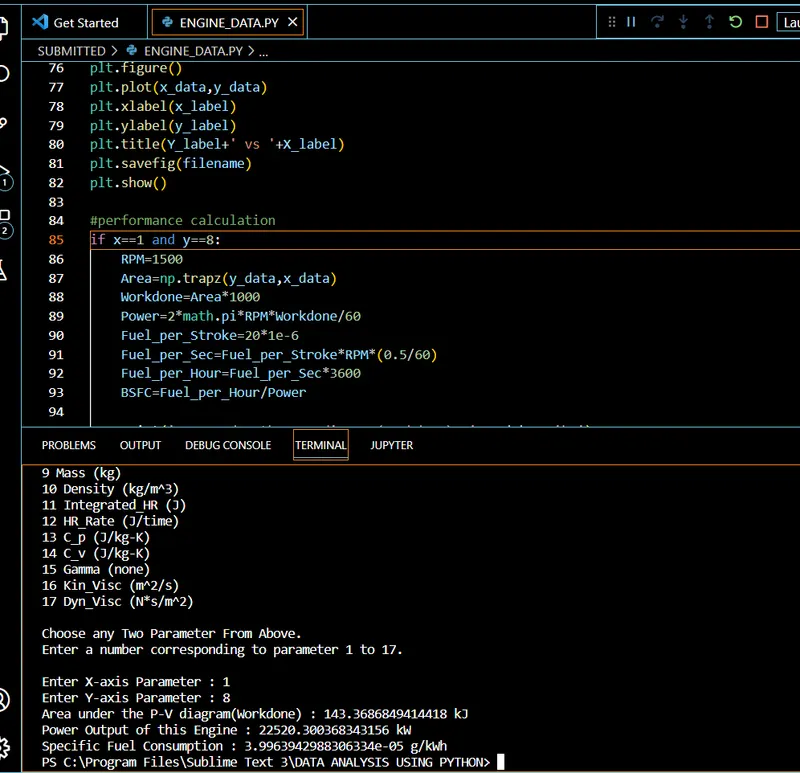
FIG.4
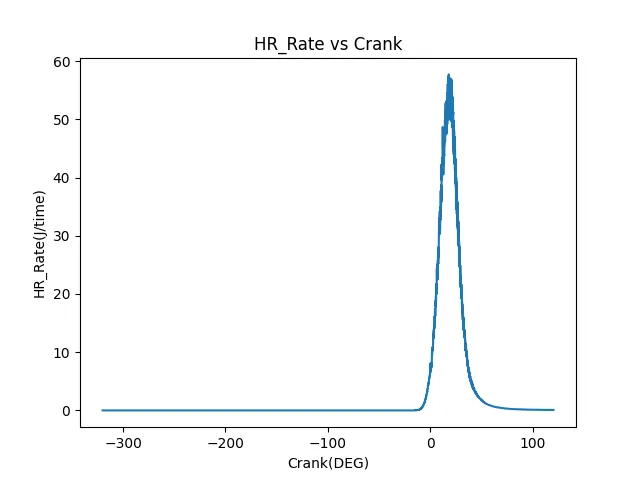
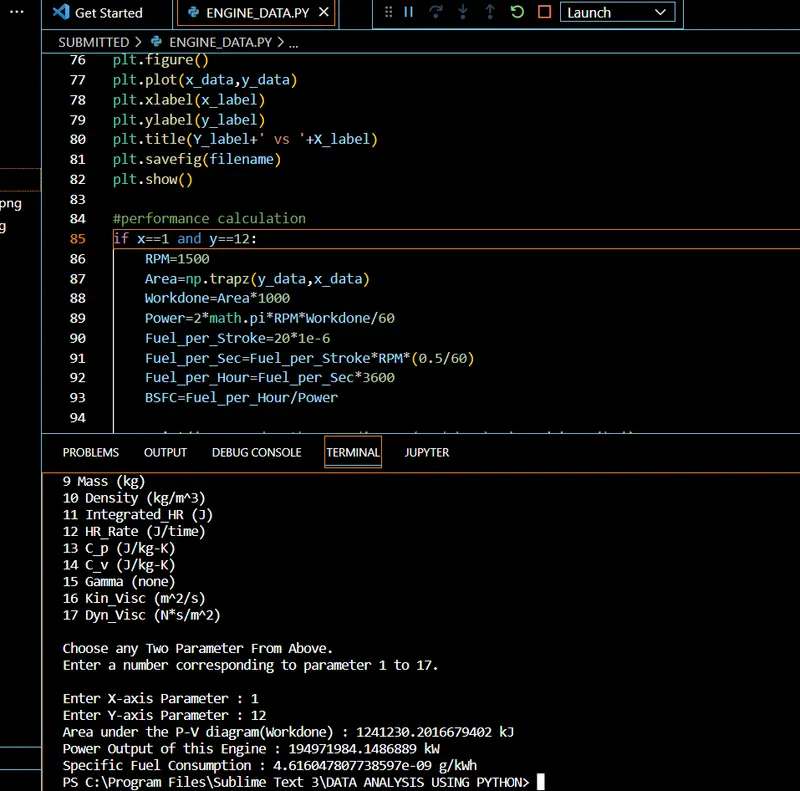
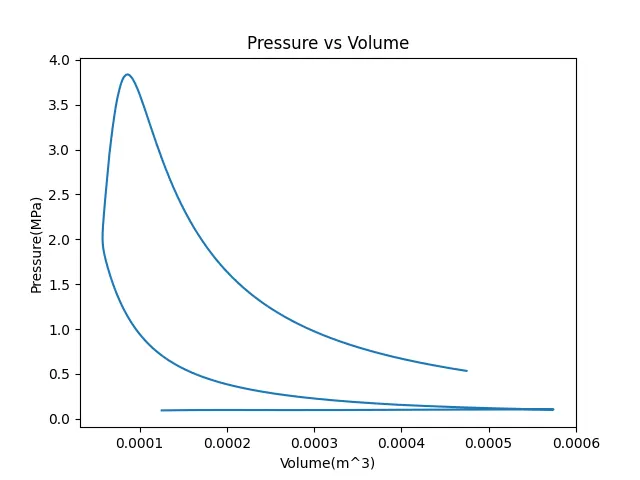
SECOND FIGURE OF PLOT PV DIAGRAM:
CONCLUSION:
- The data from the output file was read succesfully and the plotrequired as per the user need was made.
- the performance calculation done and displayed successfully.
- workdone(area under P-V diagram = 500.58662746 joules
- power out of the equation = 78.63196356693916 KW
- specific fuel consumption = 0.0009156581717396209